/
MAE 6291  Biosensors and MAE 6291  Biosensors and

MAE 6291 Biosensors and - PowerPoint Presentation

terrificycre
terrificycre . @terrificycre
Follow
342 views
Uploaded On 2020-06-15

MAE 6291 Biosensors and - PPT Presentation

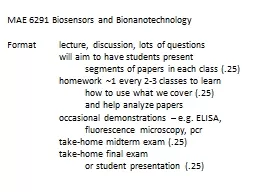
Bionanotechnology Format lecture discussion lots of questions will aim to have students present segments of papers in each class 25 homework 1 every 23 classes to learn ID: 777381

analyte molecules binding molecule molecules analyte molecule binding sequence proteins interactions units dna typical acids protein conc antibody biological

Share:

Link:

Embed:

Download Presentation from below link

Download The PPT/PDF document "MAE 6291 Biosensors and" is the property of its rightful owner. Permission is granted to download and print the materials on this web site for personal, non-commercial use only, and to display it on your personal computer provided you do not modify the materials and that you retain all copyright notices contained in the materials. By downloading content from our website, you accept the terms of this agreement.


Presentation Transcript

Slide1

MAE 6291

Biosensors and

Bionanotechnology

Format lecture, discussion,

lots of questions

will aim to have students present

segments of papers in each class (.25)

homework

~

1 every

2-3

classes to learn

how to use what we cover (.25

)

and help analyze papers

occasional

demonstrations – e.g. ELISA,

fluorescence microscopy,

pcr

take-home midterm exam (.25)

take-home

final exam

or student presentation (.25)

Slide2

Goals –

1. learn about nanotechnology-based biosensors

molecules (

analytes

) detected

molecules used to provide specificity

transducing

modalities (light, mass, electricity)

assay formats (sandwich, labels, label-free)

processes affecting time to get signal

(diffusion,

binding kinetics)

and

sensitivity

multiplex

methods (e.g. hybridization arrays)

massively parallel DNA sequencing methods

clini

cal

significance of assays

Slide3

More Goals

2

. Quantitative understanding of relevant

nanoscale

processes and phenomena

, including Brownian

motion, reaction kinetics, mechanical properties of

biopolymers like DNA at the single-molecule level

3.

Understand how some subcellular biological systems, like

molecular motors, transduce chemical energy

into motion

4. Appreciate overlap between engineering and biology

5

.

Gain experience reading

research papers critically

Slide4

Contact info:

jesilver@gwu.edu

,

tel

240 447 3268

set up time to meet for office hours

Much better to meet often to go over questions early

References

for class 1

Philip Nelson Biological Physics

Ch

1, 1.4-1.5

Dimensional

analysis, molecules pp. 18-29

Ch

2, 2.2 Molecular

Parts List, pp.45-62

.

Slide5

Molecules

(things) to be

detected and how they interact

ions

small

molecules (MW < 600g/mole=10

-21

g,

or ~50 atoms – e.g. glucose)

peptides – short string of amino acids

proteins

– string(s) of up to ~1000 amino acids

viruses - ~1000

+

proteins + NA genome (>10

4

bases

)

oligonucleotides – short string of nucleic acids = bases A, G, C, T (U) – joined via sugar-PO

4

nucleic

acid

sequence

Slide6

Ions – e.g. Na

+

, K

+

, Mg

++, Cl-, PO4— typical size?In solution: typical concentration, 1-100mM units: 1M = NA/liter = 6x10²³/10-3m3 how many is that /cm3 or ml? how far apart are they?Why do they move?How will they be distributed near charged objects?Typical distances over which fixed charges are shielded Debye length =.3nm/I1/2 (I in M)What does this mean in terms of electrostatic interactions?

Slide7

Small molecules – e.g. sugars,

<

100 atoms, size? (

~1

nm)

What is significance of glucose in biology/medicine?Diabetes – does it go up or down? problems if it goes up problems if it goes downH, O, C = hydrogen, oxygen, carbon atoms, etc.Vertices = C atoms (understood)Lines = covalent bonds strength ~eV (1.6x10⁻¹⁹J)

Slide8

More on units

Molecular weight = weight of N

A

(6x10

23) molecules (=1 mole) in gramsH has molecular weight =1g/moleC “weighs” 12 g/mole“Small” molecules defined as above have MWs ~ or <500

Slide9

Aside on energy scales

molecules always jiggling in water

Average energy of molecule

, each “mode” of

interaction, e.g. translation, vibration between atoms = kBT (4x10-21J at room temp = 1/40th ev)Do all molecules have average energy in solution?What is probability that a molecule has energy E? Boltzman distribution: p ~ exp(-E/kBT)

Slide10

What is relative probability that a sugar

molecule

hit by a

particularly energetic water molecule

at room temperature will get enough energy to break a covalent bond? p ~ exp(-40kBT/kBT) = 10-18So are covalent bonds usually stable at room temp.?

Slide11

Another class of small

molecules

All

NH

2

-CHX-COOH side groups X differ some have + or – charge others partial charge others hydrophobic “greasy”-> weak interactions (~kBT) w/ other molecules

Slide12

Protein = linear polymer of amino acids (

aa

)

chains from

a few

(“peptide”) to ~1000 aa long MWs ~100,000 g/mole (aka “kiloDalton”, kDa)Protein polymers “fold up” into fairly compact units ~10nm, based on weak interactions between amino acids

Slide13

Some proteins fairly rigid = “fixed” structure

often known from crystallography

Others don’t crystallize, probably “floppy”

(or have parts that are floppy) in solutionSome have a few, alternative “rigid” shapes (important!)Surface distribution of charged, polar (partially charged), hydrophobic, etc groups -> specific interactions with other moleculesNote how different from usual physics – gazillions of identical electrons interacting uniformly

Slide14

Glucose

oxidase

~

600

aa protein enzyme that binds and oxidizes glucose. Ribbon model of its aa backbone, por-tions of which form helices. Note size, complexity relative to glucose, a simple sugar typical of small molecule targets

~ 3 nm

Slide15

Model of

a particular protein

showing charged

surface regions (red -, blue +), and some drug molecules

in binding pockets. Note complexity of surface

allowing complex interaction with other moleculeshttp://www.pnas.org/content/104/1/42/F6.expansion.html

Slide16

Proteins can interact forming larger polymers

(of polymers) –> structural elements like

f

ibers of collagen or microtubules (~25nm in

d

iameter, microns long)Proteins also can act as enzymes, “catalyzing”chemical reactions that break and reformcovalent bondshttp://upload.wikimedia.org/wikipedia/commons/2/24/Induced_fit_diagram.svg

Slide17

Antibody – class of

proteins with common

structure: region

that is invariant and

region that varies a lot

(in different ab’s), thelatter having high, specificaffinity for some othermolecule (antigen, ligand)Nature’s “professionalbiosensor” molecule

Slide18

Ball and stick m

odel of

crystal structure of portion

of

antibody (left) binding protein from

HIV (green, right). Variable region ofantibody (purple)Antibodies are most common moleculesused to make bio-assays specificAntibodies to particular antigens can be generated inanimals, then made in large quantities in vitro

Slide19

Base pairing –

at edges –

holds strands

together; each

bp

= weak bond(~1 kBT) but runsof complementarysequence ->tight binding; canbe used for specific

recogni

-

tion

of NA’s with

compl

. sequence

Nucleic

acids – polymers of “bases”

Slide20

Biological Macromolecules - DNA

Base pairing –

at edges –

holds strands

together

Base stacking –above & below -compressesds into helixBoiling separatesstrands

RNA – like DNA, except OH at 2’ position, and

Uridine

for Thymine

Slide21

Single-stranded (

ss

) nucleic acids (NA’s) often

used to detect complementary

ssNA’s

because of incredible specificity1 base mismatch can be detected in a 20 base long dnaHow many different 20 base sequences are there? 420 = 1012

Slide22

Aptamer

= single

stranded nucleic

acid that happens

to have high

affinity for anothermolecule Aptamers can beengineered and selected for ability tobind particular targets ss NA’s can also fold into shapes that bind other molecules besides complementary NA’s

Slide23

Molecules

used to provide

specificity in biosensors

Enzymes – e.g. glucose oxidase for glucose Antibodies Genetically engineered antibody variants Nucleic acids – hybridization Aptamers – ss NAs that bind small molecules natural and engineered

Slide24

Fundamental relationship between NAs and proteins

Some protein enzymes move along DNA molecules

(

molecular motors

!), making RNA copy with equivalent base sequence (“transcription”)The RNA copy is then converted into a protein whose amino acid sequence is determined by the sequence of bases in the RNA (“translation”, “genetic code”)How do these motors work? How can they be studied? = topics of later classes!

Slide25

Immense medical significance

Variants in DNA sequence -> proteins with

variant amino acid sequence

Amino acid sequence determines how protein

folds, and hence its functionEngineered changes in DNA sequence -> novel proteins, with possibly new functionsSo big interest in sensors that determine DNA sequence

Slide26

While we will focus on biosensors (and a few

m

olecular motors), they are based on

t

he same interactions that occur naturally in

biological systems and hence provide insight into biological systems opportunity to develop innovative uses of biological materials opportunity to apply engineering tools to better understand how biological systems work

Slide27

Approach – qualitative understanding of biosensor

phenomena, then quantitative analysis

Proto-typical biosensor – ELISA

Enzyme-linked

immunosorbant assay

Slide28

1. Capture antibody

(“receptor”)

usually immobilized

on

surface, e.g. plastic 96 well (“mircrotiter “) plate3. Add detection antibody that binds different site on target, wash4. Detection antibody may be directly attached to an enzyme (e.g. HRP) that converts a substrate dye to a colored molecule, or the enzyme can be added on a 3rd molecule that binds the detection antibody

5. Wash away enzyme not specifically attached

6. Add substrate and measure

color change

“receptor”

Typical ELISA format

2. Test sample, that may contain target antigen (=

analyte

,

ligand

), is added to well; target molecule sticks to capture antibody;

wash away

whatever doesn’t stick

Slide29

Typical protocol

Add sample in

~

200

m

l, incubate ~1.5h (why so long?), washAdd 20 Ab coupled to enzyme (e.g HRP).incubate 1.5h, washAdd enz. substrate (e.g. tetramethylbenzene)Incubate 30min (in dark)Add stop solution (H2SO4) (why?), read OD (within 30min)Analyte with know concentration serially diluted in some wells to compare intensities to that of test sampleResult: analyte conc. in sample

Slide30

Many other assays are variants on this

with different “transducing” methods

e.g. fluorescence instead of dye color,

measure mass of attached molecules instead of enzyme activity measure electrical effects of captured complex

Slide31

What determines sensitivity,

incubation

times

?

How can we measure binding strength to target

vs other molecules in sample (-> false positives)?Next few classes will develop simple binding kinetics model to answer these questions

Slide32

Reaction

(receptor binding)

kinetics

Let

b

m = total receptor conc. on sensor surface [moles/area] b(t) = conc of receptors that have bound analyte at time tAssume analyte binds receptor at rate ~ free analyte conc., c

0

,*

free receptor conc

.,

[

b

m

– b(t)]

and

dissociates

from receptor at rate

~

b(t

)

db(t)/

dt

=

k

on

c

0

[

b

m

– b(t)]

k

off

b(t)

k

on

and

k

off

are

proportionality constants

Slide33

db(t)/

dt

=

kon c0 [bm – b(t)] – koff b(t)Interpretation of binding constantskon = av. # “binding” collisions per sec each receptor molecule

makes

with an

analyte

molecule when

analyte

conc

= 1

in

whatever units you use, e.g. #/m

3

or “molar”, M, moles/l

Units of

k

on

are #/conc.*time, e.g. M

-1

s

-1

k

off

= rate each receptor-

analyte

complex dissociates in #/s

Define K

D

=

k

off

/

k

on

Units of K

D

are conc., e.g. M

Slide34

db

(t)/

dt

= kon c0 [bm – b(t)] – koff b(t)At steady-state, d/dt (b(t)) = 0, so k

on

c

0

[

b

m

– b(t)]

=

k

off

b(t

)

=>

b(t)/

b

m

=

c

0

/K

D

/(1 + c

0

/K

D

)]

LHS = fraction of receptors that have bound target

Note it is natural to measure concentration of

free target molecules in units of K

D

(unit check: are units of K

D

concentration?)

Slide35

b(t

)/

b

m

= c0/KD /(1 + c0/KD)] at steady stateIf c0 = KD, half of receptors have bound analyte c0

>> K

D

, fraction of receptors with

analyte

-> 1

c

0

<< K

D

,

fraction of receptors with

analyte

~

c

0

/K

D

i.e. most

receptors are

unoccupied

Slide36

db(t)/

dt

=

k

on c0 [bm – b(t)] – koff b(t)More generally, if c0

considered constant (often not true!),

b(t

)/

b

m

=

fraction of receptors with

analyte

=

A

(1-e

-

B

t

)

where

A = [c

0

/K

D

/(1 + c

0

/K

D

)]

and

B = k

on

c

0

+

k

off

b(t)/

b

m

time

A = c

0

/K

D

/(1 + c0/KD)t = 1/B = koff-1/(1+c0/KD)Note exponentialapproach to equil.with characteristictime t

Slide37

b(t)/

b

m

time

c

0

/K

D

/(1 + c

0

/K

D

)

t =

k

off

-1

/

(1 + c

0

/K

D

)

typical

values

k

on

~

10

6

/Ms

( =10

-21

m

3

/s) fairly constant

k

off

~

1/s to 1/10

3

s (varies a lot)

K

D

~ mM (weak) to nM (tight binding) Note smaller KD <-> tighter binding (slower koff

)

Slide38

There are many caveats to this model,

but it provides a simple way to begin

to evaluate systems quantitatively

The reasoning is completely general to other biochemical interactionsBegin to think in terms of KD’s as natural measures of strength of interactions

Slide39

Main points:

Biological molecules are often polymers of simpler subunits

They interact by standard laws of physics but

because their surfaces are highly variable (in

charge, dipolarity, other weak interactions) they interact with each other in highly “molecule-specific” waysThese interactions are often ~kBT so that complexes form and dissociate at room temperature