PPT-Analysing a visual document
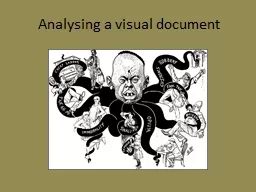
Answering A and B Answer in full sentences Refer to the image This image suggest that the Chinese brought increased unemployment for European settlers to the Gold
Download Presentation
"Analysing a visual document" is the property of its rightful owner. Permission is granted to download and print materials on this website for personal, non-commercial use only, provided you retain all copyright notices. By downloading content from our website, you accept the terms of this agreement.
Presentation Transcript
Transcript not available.