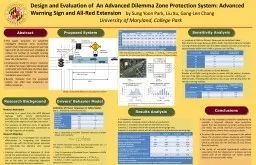
by Sung Yoon Park Liu Xu GangLen Chang University of Maryland College Park Abstract This paper proposes an advanced intelligent dilemma zone protection system that integrates advanced warning signs with allred extension strategies to reduce the number of redlight running ve ID: 733366
Download Presentation The PPT/PDF document "Design and Evaluation of An Advanced Di..." is the property of its rightful owner. Permission is granted to download and print the materials on this web site for personal, non-commercial use only, and to display it on your personal computer provided you do not modify the materials and that you retain all copyright notices contained in the materials. By downloading content from our website, you accept the terms of this agreement.
Slide1
Design and Evaluation of An Advanced Dilemma Zone Protection System: Advanced Warning Sign and All-Red Extension
by Sung Yoon Park, Liu Xu, Gang-Len Chang
University of Maryland, College Park
Abstract
This paper proposes an advanced intelligent dilemma zone protection system that integrates advanced warning signs with all-red extension strategies to reduce the number of red-light running vehicles and also to provide extra time to clear the intersection.A behavioral model for drivers’ response on yellow has been rigorously developed ,calibrated with field data and then been incorporated into VISSIM for extensive simulation experiments.Results indicates that the proposed system can offer best protection on safety measures.
Research Background
Research MotivationAccording to a report from the 2009 National Highway Traffic Safety Administration, approximately, 165,000 people were injured annually by the neglect of red-light instruction .The existence of dilemma zones at signalized intersections is one of the main contributors to the high frequency of accidents.Research ObjectiveThis research is to investigate the compound effectiveness of integrating the advanced warning sign with the all-red phase extension on minimizing the dilemma zone caused accidents. Empirical observations of responses of driver during the yellow phase at six intersections are used to calibrate a driver’s behavior model, and use as the basis for conducting laboratory experiments and performance evaluation.
Conclusions
This study has employed simulation experiments to evaluate a proposed dilemma zone protection system that uses advanced warning to advise drivers and exerts the all-red extension to prevent those non-compliance drivers from causing
accidents.
To reflect the actual drivers’ responses to the yellow phase, the simulation system developed with VISSIM has been incorporated with a driver behavior model which is calibrated with the field data of 1123 drivers from six locations.The results of simulated experiments confirm an expectation that the integration of advance warning system with all-red extension can better protect drivers and improve traffic safety.
Proposed
System
Drivers’ Behavior
M
odel
Design of proposed dilemma zone protection system
Calibration of Drivers’ Responses on Yellow
M
odel
Step 1
:
: Identifying Contributing
Factors.
Step
2
:
Calibration of VISSIM’s Embodied “Reaction to Amber” Model with Field
Data.
The initially estimated values of those key parameters are:
from field data.
Step
3
:
Comparison of Simulated Drivers’ Responses in VISSIM with the Field DataWith the initial calibrated parameters () seem do not offer the promise for laboratory experiments.
VARIABLESCoeff.P-ValueInitial_Speed0.0430Initial_Position-0.2710Age[Middle]1.5770.008Age[Senior]4.8110Phone[not on = 0]-2.7740Passenger[ None = 0]-2.1520Costant-1.5290.59
SpeedmphLocation of vehicle from stop line onset of yellow0 - 100 ft100 - 200 ft200 - 300 ft300 - 400 ft400 - 500 ftFieldInitialFinalFieldInitialFinalFieldInitialFinalFieldInitialFinalFieldInitialFinal30 - 40100%100%100%86%100%59%21%100%48%2%89%18%0%18%0%40 - 50100%100%100%100%100%100%74%100%56%50%100%64%20%100%8%50 - 60 100%100%100%100%100%100%88%100%80%50%100%71%0%100%0%Field: percentage of driver taking the “Pass” decision from field observationsInitial: percentage of driver taking the “Pass” decision fromVISSIM with initial coefficientsFinal: percentage of driver taking the “Pass” decision from VISSIM after re-calibration.
After adjusting parameters, were chosen for the minimized total difference as shown in following table.
Target intersection
Turning Movements
Speed distributions from field and simulation for 200 feet and 800 feet from the stop line
Sensitivity Analysis
Results Analysis
Comparison scenarios
Base Scenario
: actuated control without any protection.
Scenario 1:
actuated control with all-red extension only.
Scenario 2:
actuated control with advanced warning sign only.Scenario 3: actuated control with all-red extension and advanced warning sign.
Base ScenarioScenario 1Scenario 2Scenario 3Total number of vehicles run on red175141151138Vehicle running on red rate (per 1000 veh)10.88.79.38.5Average remaining all-red time (sec)1.472.081.42.13Total number of vehicles 16206162061620616206Simulation durations (hr)10101010% of changes in number of vehicles running on red (%) from Base line Scenario*--19%-14%-21%Additional remaining all-red time from Base line Scenario (sec) **-0.61-0.070.66* (total number of vehicles run on red from scenario each - total number of vehicles run base scenario)/total number of vehicles run base scenario** average remaining all-red time from base scenario - average remaining all-red from each scenario
Locations of AWS on Drivers’ Responses to the Yellow PhaseNote that in the range between 300 to 500ft, the total number of red-light running vehicles decrease with the AWS’s distance increases, but reach an approximately stable level if AWS is placed over 500 feet. The Impact of Traffic Volume on Driver BehaviorNumber of red-light running vehicles increases with the volume. However, the rate of red-light running vehicles remains around ten vehicles per 1000 vehicles, indicating that volume is not a major contributing factor for red light running vehicles.
Locations of AWS(ft)Total number of red-light runnersAverage remaining All-red time (sec)300 1672.5400 1572.3500 1382.1600 1391.8700 1341.8
Volume level
Total number of
red-light running vehicle
Average remaining
All-red interval for red-light running vehicles (sec)
Average number of run on red vehicles per 1000 vehicles
Low (500 veh/hr/ln)
138
2.3
10.35
Medium (750 veh/hr/ln)
202
1.9
10.05
High (1000 veh/hr/ln)
263
1.7
9.75