/
The Military Health Service Population Health Portal (MHSPHP) in The Military Health Service Population Health Portal (MHSPHP) in

The Military Health Service Population Health Portal (MHSPHP) in - PowerPoint Presentation

test
test . @test
Follow
414 views
Uploaded On 2018-09-17

The Military Health Service Population Health Portal (MHSPHP) in - PPT Presentation

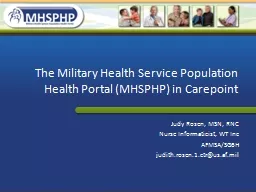
Carepoint Judy Rosen MSN RNC Nurse Informaticist WT Inc AFMSASG6H judithrosen1ctrusafmil Overview Overview Page Patient Management Patient detail view Data entry and exclusions ID: 667945

select data menu page data select page menu navigation overview updated enrollment portlets nightly monthly functional list patient click

Share:

Link:

Embed:

Download Presentation from below link

Download Presentation The PPT/PDF document "The Military Health Service Population H..." is the property of its rightful owner. Permission is granted to download and print the materials on this web site for personal, non-commercial use only, and to display it on your personal computer provided you do not modify the materials and that you retain all copyright notices contained in the materials. By downloading content from our website, you accept the terms of this agreement.


Presentation Transcript

Slide1

The Military Health Service Population Health Portal (MHSPHP) in Carepoint

Judy Rosen, MSN, RNC

Nurse

Informaticist

, WT Inc

AFMSA/SG6H

judith.rosen.1.ctr@us.af.milSlide2

Overview

Overview Page

Patient Management:

Patient detail viewData entry and exclusionsNotes Manipulating lists Medical Home MetricsReportingHELP and Methodology

2Slide3

https://carepoint.afms.mil

The address of the MHSPHP

3Slide4

http://carepoint.afms.milSlide5

Application entry pageSlide6

How to re quest Patient Data Access

Select Administration from page menu

Select My Account

Select “Request Additional Access”Select request functional level access6Slide7

Overview PageSlide8

Overview Page

Contains Summary data

Page filter to select data source

Navigation Menu on the leftChartsAction List counts reflect medical home dataExclusions take effect instantlyLabs are updated nightly

8Slide9

Overview Page:

Overview Page: All data updated monthly except…Action list counts will be updated nightly

- Action list counts only visible to functional level usersSlide10

How to switch from Aggregate to Functional

10

When you click on the functional view you will only see the MTFs you have permission to see patient level information Slide11

Data Sources

Direct Care (most monthly some nightly)

Purchased Care (monthly updates)

Enrollment information (monthly updates)DEERS enrollment info is the key to all metrics and listsOnly enrolled pts appear on listsMetrics reflect only data through the enrollment dateUser Entered Data (updated nightly)11Slide12

Why are metrics only updated monthly?

Metrics are tied to enrollment

Enrollment information released from DEERS monthly

Metrics only reflect tests or encounters that occurred prior to that end enrollment dateWe don’t know if pt enrolled after that dateIndentifying patients for lists based on encounter/enrollment data up to that end enrollment date12Slide13

Direct Care Data Sources:

Nightly Updates

Lab test data updated nightly on action lists and patient charts

A1C, Cholesterol, PapsTests are pulled by test name and/or CPT codesIf MTF changes test name, please verify data reaches MHSPHPMammograms updated nightlyTests are pulled by name and/or CPT codesIf MTF changes test name, please verify data reaches MHSPHPColorectal screens updated nightly

13Slide14

How is data displayed?

Portlets!

Boxes of data displayed to meet user’s needs

Tables or graphsMovableExportableCan remove or add to workspaceSlide15

Overview Page PortletsSlide16

Expanded PortletsSlide17

Navigation MenuSlide18

Overview – Expanded Navigation Menu

Navigation MenuSlide19

Adding PortletsSlide20

New portlets are placed in upper left corner of page

Adding PortletsSlide21

Closing and Minimizing Portlets

Red box with white X closes

portlet

. Return

portlet

to screen by using the navigation menu. “Minus” icon minimizes to header only.Slide22

Minimized

portlet

Maximize by clicking on the rectangle icon.Slide23

Chart PropertiesSlide24

Hiding the Navigation MenuSlide25

Hidden Navigation BarSlide26

The Thumbtack pointed to the left means navigation bar is floating—will disappear as move mouse away or if click on X

If you click the thumbtack it will dock the navigation bar menu to remain on screenSlide27

Display print Preview of screen

Save Workspace

Return to default workspace of 4 count tables

Delete a saved workspace

Other IconsSlide28

Data Options on Overview pageSlide29

Change Data Source: Search

Search by MTF name, location or DMIS

Then Click the looking glass

Or scroll through list….Press Control key while clicking on DMIS location to select multiple items rolled up

* Cannot select provider group or PCM name when multiple locations selected.Slide30

Select which Facility then Click Apply to display highlighted location’s data or Clear to return to default location

Select Facility from listSlide31

Change from Facility functional data to Aggregate dataSlide32

Select CommandSlide33

Lists Command’s Facilities then Select Apply Slide34

Aggregate Default ViewSlide35

HELP and Methodology

35Slide36

HELP !

Documentation tab of menu has HELP!

Contact info—help desk phone and email addresses

User Guide-big document referenceFAQs-answers to frequent questionsQuick Guides—targeted reference for password change, fixing dates in ExcelMethodology documents explain each list and metric36