/
Young Young

Young - PowerPoint Presentation

test
test . @test
Follow
363 views
Uploaded On 2015-10-16

Young - PPT Presentation

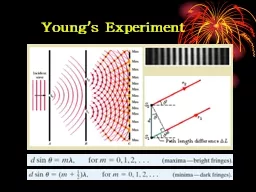
s Experiment 2 Coherence 35 Two sources to produce an interference that is stable over time if their light has a phase relationship that does not change with time E t E ID: 162357

fig diffraction light slit diffraction fig slit light single phase interference intensity wavelength reflection difference sources bright minimum ray

Share:

Link:

Embed:

Download Presentation from below link

Download Presentation The PPT/PDF document "Young" is the property of its rightful owner. Permission is granted to download and print the materials on this web site for personal, non-commercial use only, and to display it on your personal computer provided you do not modify the materials and that you retain all copyright notices contained in the materials. By downloading content from our website, you accept the terms of this agreement.


Presentation Transcript

Slide1

Young’s ExperimentSlide2

2Coherence

35-

Two sources to produce an interference that is stable over time, if their light has a

phase

relationship

that does not change with time:

E(t)=E0cos(wt+f)

Coherent sources: Phase f must be well defined and constant. When waves from coherent sources meet, stable interference can occur - laser light (produced by cooperative behavior of atoms)

Incoherent sources

:

f

jitters randomly in time, no stable interference occurs

sunlightSlide3

3

Fig. 35-13

Intensity and phase

35-

Eq. 35-22

Eq. 35-23Slide4

E

1

E

2

4

Intensity in Double-Slit Interference

35-Slide5

5Intensity in Double-Slit Interference

35-

Fig. 35-12Slide6

Ex.11-2 35-2wavelength 600 nm

n2

=1.5 andm = 1 → m = 0Slide7

Interference form Thin FilmsSlide8

8Reflection Phase Shifts

35-

Fig. 35-16

n

1

n

2

n

1 > n2n1n2

n

1

< n

2

Reflection

Reflection

Phase Shift

Off lower index 0

Off higher index 0.5 wavelengthSlide9

9Phase Difference in Thin-Film

Interference

35-

Fig. 35-17

Three effects can contribute to the phase difference between

r

1

and r2.Differences in reflection conditionsDifference in path length traveled.

Differences in the media in which the waves travel. One must use the wavelength in each medium (l / n), to calculate the phase.Slide10

10Equations for Thin-Film Interference

35-

½ wavelength phase difference to difference in reflection of

r

1

and

r

2Slide11

11Color Shifting by

Paper Currencies,paints and

Morpho Butterflies

35-

weak mirror

looking directly down

red or red-yellow tilting :greenbetter mirror

soap filmSlide12

大藍魔爾蝴蝶Slide13

雙狹縫干涉之強度Slide14

Ex.11-3 35-3 Brighted reflected light from a water film

thickness 320 nm

n2

=1.33

m = 0, 1700 nm, infrared

m = 1, 567 nm, yellow-green

m = 2, 340 nm, ultravioletSlide15

Ex.11-4 35-4 anti-reflection coating Slide16

Ex.11-5 35-5 thin air wedgeSlide17

17

Fig. 35-23

Michelson Interferometer

35-Slide18

18Determining Material thickness L

35-Slide19

19Problem 35-81

35-

In Fig. 35-49, an airtight chamber of length

d = 5.0 cm

is placed in one of the arms of a Michelson interferometer. (The glass window on each end of the chamber has negligible thickness.) Light of wavelength

λ

=

500 nm is used. Evacuating the air from the chamber causes a shift of 60 bright fringes. From these data and to six significant figures, find the index of refraction of air at atmospheric pressure.Slide20

20Solution to Problem 35-81

35-

φ

1

the phase difference with air

2 :vacuum

N fringesSlide21

21

Diffraction Pattern from a single narrow slit.

11-3 Diffraction

and

the Wave Theory of Light

36-

Central

maximum

Side or secondary

maxima

Light

Fresnel Bright Spot.

Bright

spot

Light

These patterns cannot be explained using geometrical optics (Ch. 34)!Slide22

The Fresnel Bright Spot (1819)

Newton

corpuscle

Poisson

Fresnel

wave Slide23

Diffraction by a single slitSlide24

單狹縫繞射之強度Slide25

Double-slit diffraction (with interference)

Single-slit diffraction

雙狹縫與單狹縫Slide26

26

36-

Diffraction by a Single Slit: Locating the first minimum

(first minimum)Slide27

27

36-

Diffraction by a Single Slit:

Locating the Minima

(second minimum)

(minima-dark fringes)Slide28

Ex.11-6 36-1 Slit widthSlide29

29

Fig. 36-7

Intensity in Single-Slit Diffraction, Qualitatively

36-

N=18

q

= 0

q small

1st min.1st sidemax.Slide30

30Intensity and path length difference

36-

Fig. 36-9Slide31

31

Here we will show that the intensity at the screen due to a single slit is:

36-

Fig. 36-8

Intensity in Single-Slit Diffraction, Quantitatively

In Eq. 36-5, minima occur when:

If we put this into Eq. 36-6 we find:Slide32

Ex.11-7 36-2Slide33

33Diffraction by a Circular Aperture

36-

Distant point

source,

e,g

., star

lens

Image is not a point, as expected from geometrical optics! Diffraction is responsible for this image pattern

d

q

Light

q

a

Light

q

aSlide34

34Rayleigh’s Criterion: two point sources are barely resolvable if their angular separation

θR

results in the central maximum of the diffraction pattern of one source’s image is centered on the first minimum of the diffraction pattern of the other source’s image.

Resolvability

36-

Fig. 36-11Slide35

11-4.9 Diffraction – (

繞射)Slide36

Ex.11-8 36-3 pointillism

D = 2.0 mmd = 1.5 mmSlide37

Ex.11-9 36-4

d = 32 mmf = 24 cm

λ= 550 nmSlide38

38

The telescopes on some commercial and military surveillance satellites

36-

l

=

550

× 10–

9 m.(a) L = 400 ×

10

3

m

D

= 0.85 m

d

= 0.32 m.

(b)

D

= 0.10 m

d

= 2.7 m.

Resolution of 85 cm and 10 cm respectivelySlide39

39Diffraction by a Double Slit

36-

Two vanishingly narrow slits

a

<<

l

Single slit

a~lTwo Single slits a~lSlide40

Ex.11-10 36-5

d = 32 μm

a = 4.050

μ

m

λ

=

405 nmSlide41

41Diffraction Gratings

36-

Fig. 36-18

Fig. 36-19

Fig. 36-20Slide42

42Width of Lines

36-

Fig. 36-22

Fig. 36-21Slide43

43Separates different wavelengths (colors) of light into distinct diffraction lines

Grating Spectroscope

36-

Fig. 36-23

Fig. 36-24Slide44

Compact DiscSlide45

45Optically Variable Graphics

36-

Fig. 36-27Slide46

全像術Slide47

Viewing a holographSlide48

A HolographSlide49

49Gratings: Dispersion

36-

Differential of first equation (what change in angle does a change in wavelength produce?)

Angular position of maxima

For small anglesSlide50

50Gratings: Resolving Power

36-

Substituting for

D

q

in calculation on previous slide

Rayleigh's criterion for half-width to resolve two linesSlide51

51Dispersion and Resolving Power Compared

36-Slide52

52X-rays are electromagnetic radiation with wavelength ~1

Å = 10-10

m (visible light ~5.5x10⁻⁷

m)

X-Ray Diffraction

36-

Fig. 36-29

X-ray generationX-ray wavelengths to short to be resolved by a standard optical gratingSlide53

53d

~ 0.1 nm

→ three-dimensional diffraction

grating

Diffraction of x-rays by crystal

36-

Fig. 36-30Slide54

5436-

Fig. 36-31

X-Ray Diffraction, cont’dSlide55

Structural Coloring by DiffractionSlide56