/
Journal of Cancer Journal of Cancer

Journal of Cancer - PDF document

tracy
tracy . @tracy
Follow
343 views
Uploaded On 2022-10-11

Journal of Cancer - PPT Presentation

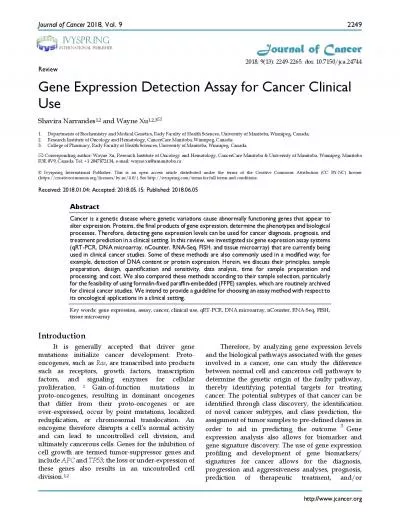
20 18 Vol 9 httpwww jcancer org 22 49 J J o o u u r r n n a a l l o o f f C C a a n n c c e e r r 201 8 9 1 3 2249 2 265 doi 107150 jca 24744 Review Gene Expression Detecti ID: 958441

gene cancer pcr rna cancer gene rna pcr clinical samples expression analysis assay microarray tissue dna data sample genes

Share:

Link:

Embed:

Download Presentation from below link

Download Pdf The PPT/PDF document "Journal of Cancer" is the property of its rightful owner. Permission is granted to download and print the materials on this web site for personal, non-commercial use only, and to display it on your personal computer provided you do not modify the materials and that you retain all copyright notices contained in the materials. By downloading content from our website, you accept the terms of this agreement.


Presentation Transcript

Journal of Cancer 20 18 , Vol. 9 http://www. jcancer .org 22 49 J J o o u u r r n n a a l l o o f f C C a a n n c c e e r r 201 8 ; 9 ( 1 3 ) : 2249 - 2 265 . doi: 10.7150/ jca . 24744 Review Gene Expression Detection Assay for Cancer Clinical Use Shavira Narrandes 1,2 and Wayne Xu 1,2,3  1. Departments of Biochemistry and Medical Genetics, Rady Faculty of Health Sciences, University of Manitoba, Winnipeg, Canada; 2. Research Institute of Oncology and Hematology, CancerCare Manitoba, Winnipeg, Canada; 3. College of P harmacy, Rady Faculty of Health Sciences, University of Manitoba, Winnipeg, Canada.  Corresponding author : Wayne Xu, Research Institute of Oncology and Hematology, CancerCare Manitoba & University of Manitoba, Winnipeg, Manitoba R3E 0V9, Canada. Tel: +1 2047872134, e - mail: wayne.xu@umanitoba.ca © Ivyspring International Publisher. This is an open access article distributed under the terms of the Creative Commons Attri bution (CC BY - NC) license (https://creativecommons.org/licenses/by - nc/4.0/). See http://ivyspring.com/terms for full terms and conditions. Received: 201 8 . 01 . 04 ; Accepted: 201 8 . 0 5 . 15 ; Published: 2018.0 6 .0 5 Abstract Cancer is a genetic disease where genetic variations cause abnormally functioning genes that appear to alter expression. Pr oteins, the final products of gene expression, determine the phenotypes and biological processes. Therefore, detecting gene expression levels can be used for cancer diagnosis, prognosis, and treatment prediction in a clinical setting. In this review, we in vestigated six gene expression assay systems (qRT - PCR, DNA microarray, nCounter, RNA - Seq, FISH, and tissue microarray) that are currently being used in clinical cancer studies. Some of these methods are also commonly used in a modified way; for example, de tection of DNA content or protein expression. Herein, we discuss their principles, sample preparation, design, quantification and sensitivity, data analysis, time for sample preparation and processing, and cost. We also compared these methods according to their sample selection, particularly for the feasibility of using formalin - fixed paraffin - embedded (FFPE) samples, which are routinely archived for clinical cancer studies. We intend to provide a guideline for choosing an assay method with respect to its o ncological applications in a clinical setting. Key words: gene expression, assay, cancer, clinical use, qRT - PCR, DNA microarray, nCounter, RNA - Seq, FISH, tissue microarray Introduction It is generally accepted that driver gene mutations initialize cancer development. Proto - oncogenes, such as Ras , are transcribed into products such as receptors, growth factors, transcription factors, and signaling enz ymes for cellular proliferation. 1 Gain - of - function mutations in proto - oncogenes, resulting in dominant oncogenes that differ from their proto - oncogenes or are over - expressed, occur by point mutations, localized reduplication, or chromosomal translocation. An oncogene therefore disrupts a c ell’s normal activity and can lead to uncontrolled cell division, and ultimately cancerous cells. Genes for the inhibition of cell growth are termed tumor - suppressor genes and include APC and TP53 ; the loss or under - expression of these genes also results i n an uncontrolled cell division. 1, 2 Therefore, by analyzing gene expression levels and the biological pathways associated with the genes involved in a cancer, one can study the difference between normal cell and cancerous cell pathways to determine the gen etic origin of the faulty pathway, thereby identifying potential targets for treating cancer. The potential subtypes of that cancer can be identified through class discovery, the identification of novel cancer subtypes, and class prediction, the assignment of tumor samples to pre - defined classes in order to aid in predicting the outcome. 3 Gene expression analysis also allows for biomarker and gene signature discovery. The use of gene expression profiling and development of gene biomarkers/ signatures for ca ncer allows for the diagnosis, progression and aggressiveness analyses, prognosis, prediction of therapeutic treatment, and/or Ivyspring International Publisher Journal of Cancer 20 18 , Vol. 9 http://www. jcancer .org 2250 identific at i on of patients who would benefit from therapeutic treatment to better understand the disease and its biology. 4 Various assay technologies have been developed for gene expression analysis ( Fig 1 ). For example, qRT - PCR amplifies a gene of interest and uses fluorescent probes or dyes to de pict the gene expression; NanoString nCounter uses probe pairs to anneal to a region of RNA and detect genes; DNA microarrays allow cDNA targets to hybridize to probes on a solid slide and can use fluorescence to detect genes; Illumina MiSeq RNA - Seq bridge amplifies nucleic acid samples to create clusters, which are then interpreted by the MiSeq system; and lastly, tissue microarrays (TMAs) study circular punches from tissue sample blocks with labelled probes or antibodies to determine the gene expression. Each of these assays has been used in diagnosis, prognosis, and treatment prediction for a variety of cancers. Some assays have been commercialized for clinical cancer use. For example, Afirma® is a microarray test for thyroid cancer diagnosis and the Onco type DX qRT - PCR test is for guiding breast cancer treatment. Many assays are under investigation in clinical trials or studies. However, numerous challenges involved with tumor sample collection, experimental design and determining the proper assay to use, analytical and diagnostic factors (such as the interpret

ation of samples and biomarker performance analysis), assay detection limits and specificity, drug development for rare cancers, and clinical distribution of a significant biomarker must be overcome to develop a novel clinical assay for cancer patients. Biomarker development is also naturally affected by a patient’s natural biology and history, intratumor heterogeneity, cancer progression, and germ - line mutations. This results in a prolonged period fr om the biomarker discovery to patenting and clinical translation stages. 4, 5 , 6 , 7 Therefore, we intend to provide a guideline for choosing an assay method with respect to its oncological applications in a clinical setting. qRT - PCR Principle and Clinical Assa y Principle PCR (polymerase Chain Reaction) was first invented by Kary Mullis and his colleagues from the Cetus Corporation when they exploited the ability of Taq polymerase from Thermus Aquaticus , which amplifies DNA, to withstand elevated temperatures. In reverse transcription PCR (RT - PCR), RNA is first reverse transcribed into cDNA and then amplified. The first generation of RT - PCR uses a band’s intensity in gel for a semi - quantification. 8 Real - time quantitative reverse transcription PCR (real - time Fig 1 . Overview of the gene expression detection assays for cancer tissue sample. Journal of Cancer 20 18 , Vol. 9 http://www. jcancer .org 2251 qRT - PCR) and digital PCR were then developed. Instead of detecting how much PCR product is generated (conventional PCR), qRT - PCR counts how many reaction cycles are used to reach an amplification slope status in real - time. The Ct (cycle threshold) levels, defined as the number of cycles required for the fluorescent signal to cross the threshold (i.e. exceeds background level) are inversely proportional to the amount of target nucleic acid in the sample (i.e. the lower the Ct level, the greater the amount of target nucleic acid in the sample). The first step requires reverse transcription of the mRNA template. Then, a primer pair anneals to the target cDNA template and a DNA polymerase (e.g. Taq) extends from the ligated primers. A thermal cycler varies the temperature settings to perform the three stages of the PCR: denaturation, annealing, and extension. Finally, a standard dissociation curve can be studied to determine the initial amount of RNA (cDNA) t ranscripts . 9 , 10 Primer design Primers are required in qRT - PCR analysis to anneal to a specific portion of the mRNA so that the DNA polymerase can extend from the primer and amplify the gene of interest. The factors to consider in primer design are the melti ng temperatures (T m ) and GC content of the forward and reverse primers. A range of T m s have been reported, with 58˚~60˚C considered as stringent. Tight annealing of the primer to the mRNA template will reduce the chances of primer - dimers or hairpins. 11 , 12 La stly, primers spanning exon - exon junctions allow for the strict amplification of mRNA samples and not any contaminating DNA as DNA contains alternating regions of exons and introns while mRNA lacks introns. 11 There are a few freeware to help the primer/pro be design, for example Primer3, the primer designing tool from NCBI. Enzyme/Kit Many commercial companies provide qRT - PCR Taq polymerase enzyme and mixture reaction solutions. Besides the digital PCR that detects the actual copy of mRNAs and other alternat ive PCR methods, there are two major qRT - PCR systems: TaqMan and SYBR green. In TaqMan qRT - PCR, a specific probe labeled with a fluorescent reporter is bound on the cDNA of the target RNA. Taq polymerase enzyme will degrade the probes during the chain exte nsion such that the fluorescent reporter is released. The amount of PCR product can be quantitatively measured by the fluorescence reporter detection. 10 As different reporter dyes can be utilized for a TaqMan assay, the sensitivity of a TaqMan assay is one of its major advantages. It also has a high specificity because of the specific probe but it cannot be used for multiplex gene targets. In SYBR Green qRT - PCR, the fluorescent dye SYBR Green binds with the amplified double stranded DNA and emits an intense green light. Therefore, the PCR products can be measured by detecting the bound SYBR Green fluorescence. Compared to TaqMan qRT - PCR, this method is inexpensive, easy to use, and can be used for multiplex gene targets. However, due to its ability to bind t o any double - stranded DNA, nonspecific binding can lead to over quantification of PCR product. 9, 13 Data Analysis The quantitation of results generally requires the study of the output dissociation curve, which allows a graph of known RNA concentration to be used as a reference for a curve constructed from the unknown RNA quantity. This approach is known as the standard curve method. The comparative Ct method involves comparing the Ct values of interest with a control, such as a non - treated or normal sample, which are both then normalized to a housekeeping gene. 9,11 A biostatistical analysis can also be done where the final gene expression values are log - transformed for a normalized or symmetrical data distribution. Cancer clinical ThyraMIR™ is a commercial R T - PCR assay developed by Interpace Diagnostics Inc. It is used for the diagnosis of thyroid nodules, one of the most common cancer types, based on the evaluation of expression of 10 miRNAs. 14 The well - known Oncotype DX, a gene expression profiling technique developed by Genomic Health, was the first genomic biomarker assay advising on breast cancer treatment options. Through the identification of 250 candidate genes with known functions and relevancy to hormone receptor - positive breast cancer,

a 21 - gene sign ature of 5 reference genes and 16 cancer - related genes involved in tumor proliferation, invasion, and estrogen signaling was established. It is able to predict the recurrence risk in early - stage (stages I and II), estrogen receptor (ER) positive, lymph nod e negative breast cancer patients to assess and predict the efficacy of adjuvant chemotherapy (ACT) in treating a patient. 15 , 16 Techniques similar to Oncotype DX have also been applied in colon cancers. For example, two separate studies established 18 - gene s ignatures, both of 13 cancer - related genes and 5 reference genes to study stage II colon cancers. 17 , 18 qRT - PCR has also been applied to monitor the development of severe Journal of Cancer 20 18 , Vol. 9 http://www. jcancer .org 2252 acute respiratory syndrome (SARS) - associated coronavirus and detect the prognostic marke rs in leukemia. 19 In a study establishing a gene signature for human prostate cancer, RNA was extracted from snap - frozen human prostate surgical tissue samples and reverse transcribed using random hexamers and Superscript II Reverse Transcriptase. qRT - PCR then aided in the identification of 8 genes of interest: ornithine decarboxylase, ornithine decarboxylase antizyme, adenosylmethionine decarboxylase, spermidine/spermine N(1) - acetyltransferase, histone H3, growth arrest specific gene, glyceraldehyde 3 - phosphate dehydrogenase, and Clusterin. 20 qRT - PCR has also been successfully applied in non - small cell lung cancer (NSCLC) studies to establish a 14 - gene signature with 11 cancer - related target genes and 3 reference genes and identify 5 genes essential in the treatment outcome prediction. 21 , 22 DNA Microarray Principle and Clinical Assay Principle The development of DNA microarrays can be traced to the late 1990s and early 2000s where methods for fluorescent detection were adapted for the progression of array technology. 23 DNA microarrays can be used for quantification of either genomic DNA or RNA. There are two types of DNA microarray: 2 - channel and 1 - channel arrays. In 2 - channel array, the array slides are made by spotting with cDNA fragments (custom cDNA arra y) or oligonucleotide probes (Agilent) . The treated sample’s cDNA and the normal control sample’s cDNA are labeled by two types of fluorescen ce (2 - channel). For example, cDNA from tumor samples may be labeled with Cy®5 while cDNA from normal tissue samples may be labeled with Cy®3.The mixture of treated and control samples are then hybridized on array. The ratio of the 2 - channel intensities of each spot represents the gene expression of treated sample relative to control. Now Agilent produces commercial 2 - ch annel arrays. 24 , 25 In 1 - channel array, the oligonucleotide probes are synthesized on the surface of slide. The fluorescent labeled sample cDNAs are then hybridized on the array and the absolute intensity of hybridization signal is measured. Affymetrix GeneCh ip is a typical 1 - channel array. 24, 26 Illumina BeadArray is a variation of 1 - channel array which synthesizes barcoded probes on a surface of microbeads and makes cells filled with beads. 27 A DNA microarray assay needs a commercial array or custom designed a rray and cDNA labelling preparation from each RNA sample. Following hybridization of the cDNA samples on array, a scanning device images and measures the fluorescent levels of the microarray. Arrays/kit There are three main manufactures for commercial micr oarrays : Affymetrix GeneChips, Illumina BeadArrays, and Agilent 2 - channel arrays. 25,26,27 These microarrays meet all kinds of needs for human gene expression detections, such as the whole genome - wide transcriptome detection. 25 If a special panel of gene ex pression detection is needed, a custom array can be designed by these commercial companies. Data Analysis Normalization is required to remove the variation in an experiment that affects gene expression levels and is necessary in the earlier stages of micro array examination as the following analyses will be affected by the normalization. Following imaging of the microarray, the raw data is first analyzed by subtracting the background fluorescence from the fluorescence of each spot. Selecting an appropriate h ousekeeping gene or genes is a delicate task as some genes previously thought to be ideal references have been shown to vary in expression level, depending on circumstances such as a donor’s biological state. 28 A common normalization method, such as the non - linear locally weighted scatterplot smoothing (LOWESS) method, is applied to the background - adjusted intensities. 29 Cancer clinical Afirma®, a microarray assay developed by Veracyte Corporation (South San Francisco, California), is a gene expression classi fier that measures the expression of 167 gene transcripts. It classifies aspirated material from thyroid nodules as either benign or suspicious. 30 MammaPrint is a 70 - gene signature derived from 5000 expressed genes using a DNA microarray assay to predict the distant disease - free survival and overall survival in lymph - node negative patients. It has also been shown to have significant prognostic results in lymph - node positive tumors. Being cost - effective and shown to improve quality - adjusted survival, it identifies patients in the “low - risk” group with a �90% chance of being disease - free for a minimum of 5 years, allowing them to refrain from unnecessary adjuvant chemotherapy. 31 , 32 DNA microarrays have been used to determine the differences between the subtypes of lung squamous cell carcinomas (SCC) and stratify the patients for accurate prognoses and targeted research. One study used 382 SCC patients from five p

ubl ished cohorts of DNA microarrays to detect the subtypes Journal of Cancer 20 18 , Vol. 9 http://www. jcancer .org 2253 and the collection and assay of 56 SCC patients for validation. Four independent subtypes were identified and statistics and bioinformatics were used to determine subtype survival outcome, clinical co variates, and biological processes. 33 DNA microarrays have also been employed to evaluate the expression of ZAP - 70 in purified leukemic cells from chronic lymphocytic leukemia (CLL) patients. It was determined that the ZAP - 70 expression level, which is high in T - cells, can be used to identify patients requiring certain treatments by assigning patients with CLL to the correct IgVH mutational subtype. High correlation concordance was shown for a spread of ZAP - 70 mRNA levels between the DNA microarray and qRT - P CR assay. 34 The DASL TM (cDNA - mediated annealing, selection, extension, and ligation) assay to target gene - specific sequences was established using 16 FFPE samples from prostate, lung, colon, and breast tissues types. 35 NanoString nCounter Principle and Clini cal Assay Principle The nCounter technology is a robust, sensitive, reproducible, and easy - to - use method. Developed by NanoString Technologies, nCounter is a variation on the DNA Microarray. It employs two ~50 base probes per mRNA that hybridize in solutio n. The reporter probe carries the signal, while the capture probe allows the complex to be immobilized so that the Digital Analyzer can detect the colour codes. The Digital Analyzer senses the hybridized colour - coded probes and captures the signal intensit ies as gene expression mRNA levels. As the probes anneal directly to an RNA sample, no reverse transcription to produce cDNA is required. This assay has a wide range of potential applications such as in the diagnostics and validation of gene expression exp eriments for diseases (e.g. cancer) and research of gene regulatory pathways, ultimately leading to the translation of the data for clinical use. 36 , 37 Probe design Probe pairs are constructed for each unique gene. The probe pair is comprised of the capture and reporter probes, each 35 - 50 bases long and complementary to the same individual RNA molecule. The capture probe is attached via its 3’ end to an affinity tag, such as biotin, while the reporter probe is detected through coupling via its 5’ end to a colour - coded tag (a backbone of single - stranded DNA ligated to RNA molecules labeled with fluorophores). There are four different coloured fluorophores and six availa ble positions on a colour code, conferring a wide range of tags that can be mixed in a single - well reaction and successfully be resolved and identified during data analysis. 36,37,38 Enzyme/kit As the probes attach directly to an RNA sample for its detectio n, no enzyme is required. The capture and reporter probes are mixed with RNA in solution prior to forming tripartite structures via hybridizing to their designated segments. Two kits of reagents are required: the CodeSet and the Master Kit. The CodeSet has customized or pre - designed probes, depending on one’s experimental protocol, and a set of system controls. The Master Kit contains ready - to - load consumables and reagents for an assay. The Digital Analyzer identifies, scans, and counts the molecular barcod es per sample. 36,37, 38 Data analysis The Digital Analyzer uses a CCD camera through a microscope objective lens to magnify and image the immobilized Reporters, capturing hundreds of images per sample and outputting hundreds of thousands of counts; it proces ses the images and exports the data as comma separated (.csv) output files which can then be used as input for the nSolver TM Analysis software. The nSolver TM software performs quality control (QC) and data normalization and analysis. 36,38 Normalization is needed to account for variations in hybridization, purification, binding efficiency, and other experimental factors. NanoString recommends applying the internal positive controls in each CodeSet to remove variability. In addition to the positive control an d reference (housekeeping) gene normalization, global and Plex 2 normalization may also be performed. 38 Cancer clinical PROSIGNA is a well - known 50 - gene NanoString nCounter assay for measuring the risk of relapse (ROR), a prognostic factor for relapse - free survival in breast cancer patients with node - negative tumors who have not received adjuvant systemic therapy. 31, 39 One study used a custom designed nCounter CodeSet for 414 gene elements for studying colon cancer and discovered a subset of genes serving as potential biomarkers for cancer prognosis in FFPE tissue samples. There was a moderate correlation between the nCounter and microarray platforms. The assay included multip le published gene signatures for colon cancer prognosis and several candidate genes elements from ongoing studies in intestinal stem cell biology and epithelial - to - mesenchymal transition (EMT). 40 In another study, the NanoString nCounter technology was chos en to assay RNA extracted from Journal of Cancer 20 18 , Vol. 9 http://www. jcancer .org 2254 FFPE samples from stage II gastric cancer patients based on its ability to evaluate the expression levels of up to 800 genes. After screening 186 patients for the identification of prognostic genes and evaluating the strength of the prognostic algorithms, 8 genes ( LAMP5, CDC25B, CDK1, CLIP4, LTB4R2, MATN3, NOX4, and TFDP1 ) were identified that, together, efficiently predicted a patient’s outcome for the recurrence of cancer post - surgery, regardless of prior adjuvant chemothera py. There is hope this prognostic signature will be

validated in a phase III trial. 41 Through the extraction and analysis of 100 ng of RNA from fresh - frozen tissue and FFPE samples, a 25 - gene signature for medulloblastoma patients was established using a sp ecific NanoString nCounter CodeSet through demonstrating a high concordance between the nCounter assay and an Affymetrix expression array data using 101 medulloblastoma samples and a second group of 130 non - overlapping medulloblastomas of known subgroup. T hree laboratories in Canada, Switzerland, and the United States demonstrated reproducibility of the assay. 42 MiSeq RNA - Seq Principle and Clinical Assay Principle RNA sequencing (RNA - Seq), which directly sequences and counts the mRNA molecules in the whole t ranscriptome, can be selected to measure gene expression to detect genomic changes in disease states. Four steps are involved in RNA - Seq: the mRNA transcript is fragmented and primers are allowed to randomly anneal to mRNA segments; first and second strand cDNA synthesis from reverse transcription of the mRNA fragments result in double - stranded cDNA; the ends of the fragments are tagged with a phosphate group and poly(A) tail; and finally, adaptors are ligated onto the cDNA fragments so that PCR amplificati on and sequencing can be performed. 43 Sequencing involves the continual addition of fluorescently labelled nucleotide bases of four colours to the adaptor sequence, followed by photo imaging by a machine each time a base is added. These images are then tran slated into a sequence of bases. 44 , 45 The MiSeq® bench - top appliance sequences the cDNA templates and generates sequence reads in densities of 10 million individual molecular clusters per square centimeter through cluster generation, sequencing by synthesis (SBS), and data analysis. 46 Kit/RNA library preparation MiSeq RNA preparation kits, such as Illumina’s Tru - Seq RNA - Seq kit, can be purchased from manufacturers. The kit includes reverse transcriptase for the reverse transcription of RNA into cDNA, primers, and adaptors. Sample preparation results in the ligation of adaptors to both ends of a nucleic acid fragment. 46,47 Data analysis MiSeq conducts the basic data analysis with the MiSeq Control Software (MCS) and the Sequencing Analysis Viewer (SAV) installed on another computer. The MiSeq Reporter generates FASTQ - format files containing the sequenced reads for each sample and their quality scores. The MiSeq Analysis folder contains a BaseCalls folder where the FASTQ files are sent to. The Targeted RNA workfl ow outputs a BAM file that contains the reference genome, with various annotations and set chromosome sizes, and a target hit file with aligned replicate counts per transcript. 47 , 48 The fastq files exported from MiSeq can be analysed alternatively. Read alignment poses as a complication for RNA - Seq as the reads are compared to a reference genome where exon - exon splice junctions exist in RNA transcripts but not DNA transcripts. RNA - Seq alignment tools that correct for this include GSNA P, MapSplice, RUM, STAR, and TopHat. 48, 49 MapSplice, for example, searches for exon - splice junctions in a sample mRNA transcript - ome and then determines a likely alignment for each mRNA tag to a reference genome. In the first phase, the “tag alignment” phas e, potential alignments of the mRNA tags to the reference genome are identified. The second phase, “splice interference phase”, splice junctions appearing in one or more tags are further studied for their quality and diversity of alignments to output a spl ice significance score. Following read alignment, transcripts are formed from the mapped reads using computer software. 50 Programs such as Cufflinks and FluxCapacitator count the total number of reads mapping to transcripts to quantify gene expression. 51 Dat a between each sample can be normalized by reads per kilobase per million library reads (RPKM). Normalization on expression levels per replicate is performed based on the number of aligned reads. Variance estimation requires dividing the raw variance of al l sample IDs by the square of the mean. Deriving the p - value for differential expression per transcript requires a negative binomial distribution model normalized for transcript abundance. A Benjamini - Hochberg procedure is used to calculate the q - values to correct for multiple hypothesis testing and the false discovery rate (FDR). The statistical results are summarized and output to the Alignment folder. 48 Journal of Cancer 20 18 , Vol. 9 http://www. jcancer .org 2255 Cancer clinical Several studies have used next - generation sequencing (NGS) technologies for cancer gen e analysis and/or signature development. For example, one study used NGS to analyze 21 - genes, including the BRCA1 and BRCA2 tumor suppressor genes, associated with breast and ovarian cancers. 52 NGS was also used to determine the instability and examine the pathogenic properties of and clinical impact resulting from the large number of somatic microdeletions at exon 19 affecting the Epidermal Growth Factor Receptor (EGFR) in NSCLCs. 53 By selecting 33 patients with leukemia and designing amplicons targeting RUN X1 , CEBPA , CBL , NRAS , KRAS , DNMT3A , EZH2 , and TP53 , one study analyzed the robustness of the PCR amplification strategies and GS FLX Titanium and Illumina MiSeq amplicon - deep sequencing platforms. The aim was to evaluate the technologies for their routine clinical use in characterizing and monitoring diseases using individual patient assays. MiSeq could detect TP53 variants and a 24 - base pair insertion - deletion, conferring a predictive characteristic of the assay to detect residual disease and identify muta tions for the as

signment of treatments. 54 The MiSeq RNA - Seq technique was also used to assess the purpose of tumor - educated blood platelets (TEPs) in systemic and local responses in tumor growth. Using a total of 283 platelet samples (228 patients with loca lized and metastasized tumors and 55 non - disease individuals), mutated KRAS and EGFR in plasma DNA and platelet RNA was detected. Blood - based onco - signatures can be derived from TEP mRNA profiles to examine tissue biomarkers for the stratification of patie nts into low - and high - risk groups and the selection of their therapies. Although the clinical relevance of blood platelets in the molecular diagnosis of patients presenting with several types of cancer was established, systemic factors such as chronic dis ease or transient disease states and/or non - cancerous diseases could have affected the TEP mRNA profile, prompting their further validation in blood - based therapy selection, longitudinal studies, and disease recurrence monitoring. 55 Fluorescence in situ hyb ridization (FISH) Principle FISH was developed in the early 1980s. 56 It applies fluorescent - labeled short DNA probes that hybridize to target DNA or RNA sequences in situ and fluorescence microscopy to localize and detect the targets in tissue slides. FISH can determine the presence or absence of mRNA expression from a gene of interest, as well as localize these gene expressions in specific cells. 57 , 58 Pre - treatment is required to preserve RNA and tissue morphology. Cells, FFPE, or frozen tissue sections are fixed, then permeabilized to allow target accessibility. A target - specific probe hybridizes to the target RNA(s). Separate but compatible signal amplification system s enable the multiplex assay. Signal amplification is achieved via series of sequential hybridization steps. Multicolor FISH can be used to identify as many labeled features as there are different fluorophores used in the hybridization. 57,58 P robe design M any different types of probes are used for in FISH, including cDNA, cRNA, and synthetic oligonucleotide probes. Probe size is important because longer probes hybridize more specifically than shorter probes, so that strands of DNA or RNA (often 20 – 50 nucleo tides), which are complementary to a given target sequence, are often used to locate a target. 57,58, 59 Data analysis Automated fluorescence signal analysis system can analyze fluorescence signal patterns / FISH spots in cells or cell nuclei automatically, p recisely, and reproducibly. Signal channels can be combined to an assay, and the images obtained in each channel can be processed individually. Morphology of target cells, nuclei, or other objects can be precisely defined with a number of cell selection pa rameters. Multiple features of objects (e.g. area, shape, intensity, and signal distribution) can be measured. 57 Cancer clinical The application of FISH is growing rapidly in genomics, cytogenetics, prenatal research, tumor biology, radiation labels, gene mapping, gene amplification, and basic biomedical research, as well as clinical applications, for diagnostic purposes. As a gene expression assay, FISH is used for localization and detection of specific RNA targets (mRNA, lncRNA and miRNA) in tumor cells a nd tissues. In one study, FISH was used to assess HER2 transcript distribution in a fresh frozen HER2 - positive human breast cancer tissue section and KRAS in wild - type and mutant cells. Padlock probes, oligonucleotides that are circularized following hybri dization to a target sequence that is complementary to the probe ends, were designed to detect the cDNA molecules. Rolling circle amplification can then be used to amplify the circularized padlock probes. HER2 expression varied, as expected, and a somatic point mutation was identified in KRAS . 60 Journal of Cancer 20 18 , Vol. 9 http://www. jcancer .org 2256 23 small molecule inhibitors and antibodies that target MET , a proto - oncogene, and its ligand, hepatocyte growth factor (HGF), have been developed and tested in over 240 clinical trials in 2014. 61 One study analyzed M ET expression and activity in a matched set of FFPE vs. fresh frozen tumor samples consisting of 20 cases of gastric cancer using both FISH and IHC. It was found that RNA FISH can be used to confirm findings obtained by IHC and potentially may replace IHC fo r certain targets if no suitable antibodies are available. RNA FISH is a valid platform for testing predictive biomarkers for patient selection. 62 MicroRNAs (miRNAs) are excellent tumor biomarkers because of their cell - type specificity and abundance. A reli able multicolor miRNA FISH technique was developed that enables miRNA visualization in FFPE tissues. They tested two skin tumors, basal cell carcinoma (BCC) and Merkel cell carcinoma (MCC), to visualize differentially expressed miRNAs in FFPE tumor samples . 63 qRT - PCR analysis and FISH was applied in a study to assess miRNA expression in the HER2 - positive breast cancer cells. It was found that miR - 489 was expressed at a significantly lower level in tumor tissues compared to the adjacent normal tissues and di rectly targets HER2. 64 FISH can also be used for LncRNA expression detection in cancer. For example, one study used RNA FISH to investigate the association between LncRNA AK023391 expression and the clinicopathological characteristics and prognosis of gastr ic cancer patients. 65 A separate study demonstrated two antisense lncRNAs at the 5' (5'aHIF - 1α) and 3' (3'aHIF - 1α) ends of the human HIF - 1α gene in kidney tumor tissues using RNA FISH. 66 Tissue Microarray Principle and Clinical Assay Principle D eveloped in 1 998 by Kononen and associates,

tissue microarrays (TMAs) require combining small tissue samples into “sausage blocks” to study the connection between the tissue samples on the slide with the clinical data. 67 By using in situ analyses, such as fluorescent in situ hybridization (FISH), RNA in situ hybridization (ISH), or immunohistochemistry techniques, TMAs can detect protein staining and cellular locations, offering its application in molecular diagnostic studies. However, the number of proteins to be detect ed is limited by the antibodies. 68 , 69 TMAs are expanded from gene expression serial analysis and cDNA microarrays so that they only require a single experiment to study the gene expression from many genes in a single tumor sample, allowing multiple patient samples representing various stages of a disease to be simultaneously investigated. 70 With the use of a TMA slide, probes for hybridization, and a signal detection instrument or scanner for data, followed by data analysis, TMAs offer the advantage of permitting a single set of tissues with as sociated clinical data to be used in various and unlimited studies. The steps generally required to prepare a TMA are as follows: preparation of a high - adhesive glass slide; acquisition of donor tissues; tissue core mapping and arrangement; sampling, secti oning, and transferring of the tissue donor cores; and tissue staining and molecular analysis. First, samples are taken from FFPE tissues. After mapping a tissue section stained with hematoxylin and eosin (H and E), a tissue arrayer removes cores from the donor block and places them in the recipient block. Primer/probe design FISH requires a DNA probe typically from cloned sources (e.g. plasmids) and target DNA in the form of chromosomes or interphase chromatin that will bind to the probe. The DNA probe can be labelled with haptens, fluorochrome, or dye - based nucleotides. The DNA probe and target DNA are permitted to hybridize to each other only following their denaturation into single strands. Fluorescent microscopy can allow for the visualization of the DN A probe - target DNA complexes. 71 Similar to FISH, RNA ISH requires a gene - specific nucleotide probe to bind to a certain sequence on a DNA or RNA strand. The probes may be labelled with radio - , antigen - , or fluorescent - labelled bases and analyzed by autoradi ography, immunohistochemistry, or fluorescent microscopy, respectively. 58 Data analysis Minute tissue samples (typically 0.6 mm in diameter) from up to 1000 different tissues can be analyzed on one microscope glass slide. Since all tissue samples are simul taneously analyzed with the same set of reagents, standardization, speed of processing, and cost are all efficient so that normalization to account for technical experimental variances between samples need not be extensively performed. 67,68,70 The tissue s ections can first be analyzed via H and E staining or immunofluorescent ISH. An automated scanning system can be purchased to scan and analyze the prepared TMA slides. As the tests carried out on a TMA may vary depending on one’s experimental design and pu rpose, a different combination of gene detection and analysis may be performed. Autoradiography or immunohisto - chemistry may be applied for detection followed by fluorescent microscopy or imaging by an array Journal of Cancer 20 18 , Vol. 9 http://www. jcancer .org 2257 scanner may be used for the assessment of fluore scent levels in a TMA. 69 For example, one can use digital imaging scanning and processing technologies and Microsoft Access and Excel as databases, then compare their results to clinical data. 68 As various techniques exist to visualize TMAs, numerous data analysis and normalization methods have been developed. The Tissue Array Management and Evaluation Environment (TAMEE) web - based database application that stores experimental parameters, TMA images, and evaluation results is available for TMA data analysis and management for the whole TMA workflow. 72 The Tissue Array Co - Occurrence Matrix Analysis (TACOMA) uses local inter - pixel relationships to quantify cellular phenotypes to recognize specific staining patterns and output a score of categorization. 73 Cancer clinical Through studying candidate genes and the RNA, DNA, and/or protein molecular alterations in each sample, TMAs can be used in the research of diseases, such as cancer, and for drug target discovery, to determine the therapeutic importance of these g enes in a patient, as well as their diagnostic and prognostic significance. In cancers, this allows for the examination of tumor progression and the identification and validation of prognostic factors or genes that can potentially be translated into the cl inical setting for therapeutic treatments. For example, TMAs were used in an original experiment to study the amplifications of six genes, as well as the expression of p53 and estrogen receptor (ER), in breast cancers, allowing for the further stratificati on of the cancers into subgroups. 67 To examine how the molecular changes in bladder cancer patients affect their clinical outcomes, a tissue microarray was constructed using 2317 samples from 1842 patients to study the outcome of the amplification of CCNE and its protein expression. 74 Four independent TMAs were used to analyze the prognostic markers (ER, PR, and p53) in impacting molecular changes and clinical endpoints in 553 breast carcinomas. 0.6 mm samples were taken from one central and three peripheral regions from FFPE samples. Multiple punches per tumor were taken that demonstrated the tumors could be distinguished into three subgroups (positive, negative, and heterogeneous). 12 TMAs constructed using three antibodies on four arrays

demonstrated signi ficant associations with tumor - specific survival than large section analyses. A single sample per tumor was sufficient to identify associations between molecular alterations and clinical outcome. Further validation of the established molecular markers is r equired using larger tissue samples from clinical trials. 75 As many previous studies assessing ER expression using immunohistochemistry have not been reproduced, one study used TMAs to examine the variability in ER expression reporting for breast cancers. 5 independent laboratories constructed TMAs by coring an invasive breast cancer donor block from 29 patients twice. A moderate to high interlaboratory agreement was determined, demonstrating that TMAs are efficient for the identification of ER variability r eporting and have the potential to be applied to similar projects. 76 TMAs of 544 clinical samples from varying stages of prostate cancer were used to study the expression of candidate genes discovered by cDNA microarrays of the CWR22 xenograft model. Using 60 prostatic intraepithelial neoplasia, 264 primary tumors, 41 dista l metastases, and 134 hormone refractory specimens, with 45 samples of benign prostatic hyperplasia acting as the control, they demonstrated the use of S100P , CRYM , and LMO4 in affecting androgen - independent growth and therapy failure in prostate cancers. Following mRNA in situ hybridization and immunohistochemical analyses of the TMAs, strong correlation was found between the cDNA microarrays and mRNA. Over - expression in hor mone - refractory CWR22R xenografts of S100P was seen while CRYM and LMO4 were down - regulated. 77 Another study used TMAs from 1023 samples of prostate tissues to examine the significance of the Polycomb group protein EZH2 in the progression of prostate cancer . Included in the cohort were 400 samples from 23 individuals who passed away from hormone refractory metastatic prostate cancer. Highly expressed EZH2 is mainly seen in the nucleus and its staining increases across the benign, prostatic atrophy, prostatic intraepithelial neoplasia, and clinically localized prostate cancer subgroups. Metastatic prostate cancer demonstrated the highest intensity staining. The group also analyzed the validity of EZH2 as a tissue biomarker for prostate cancers, considering the clinical and pathological factors, using TMAs from patients with provided clinical follow - ups. It was demonstrated that EZH2 is a potential biomarker for prostate cancer as its concentrations can affect the disease aggressiveness and abnormal EZH2 express ion may progress the cancer. 78 Comparison We compared the qRT - PCR, DNA Microarray, NanoString nCounter, Illumina MiSeq RNA - Seq, FISH, and Tissue Microarray assays in primer/probe design, sample preparation, instrument used, data analysis, reproducibility, s pecificity, sensitivity, Journal of Cancer 20 18 , Vol. 9 http://www. jcancer .org 2258 throughput, complexity, processing, data analysis, use in research, and commercialization ( Table 1 ), and the cost and time used ( Table 2 ). Sample Preparation Cell lysates, fresh frozen (FF) tissue, and FFPE samples are widely used in cancer genomics studies by the qRT - PCR, DNA microarray, NanoString nCounter, and Illumina MiSeq RNA - Seq assays to provide data for patient diagnosis and prognosis. FISH and TMAs also employ FFPE specimens. FF samples allow for better preserved RNA but a re limited in availability and use as tissue banks and research groups mainly collect and study them; they also have the disadvantage of sample size, transport, and clinical annotation. 79 , 80 The RNA isolation and purification steps are generally the same for the qRT - PCR, DNA microarray, NanoString nCounter, and Illumina MiSeq RNA - Seq methods as commercial kits may be purchased for RNA extraction from cell lysate, FFPE, and FF samples. The TMA has a longer process for sample preparation using FFPE samples. The purpose of the formalin fixation and paraffin embedding (FFPE) protocol is to preserve proteins for tests such as FISH or immunohistochemistry, rather than nucleic acid strands. As TMAs do not require RNA extraction and apply fluorescent detection tests s uch as FISH and ISH, they can make use of the long - term storage and abundance of samples acquired from FFPE samples. Although FF samples provide better quality samples for microarray analyses, microarray oligonucleotide probes have consistency in detection s from both FFPE and FF specimens. FFPE samples are also commonly used in microarray gene expression analyses. Due to differing tissue characteristics between FFPE and FF samples, the yield of cDNA after reverse transcription and amplification from FFPE an d FF samples may vary. Through matched FF and FFPE samples studies to evaluate the integrity and consistency of gene expression in FFPE samples, it has been shown that FFPE samples may be used in gene expression analysis. 80, 81 Similarly, FF samples are pref erred for RNA - Seq experiments as they provide better quality data. Table 1. Comparison of qRT - PCR, DNA Microarray, NanoString nCounter, Illumina MiSeq RNA - S eq, and Tissue Microarray assay properties . Assay qRT - PCR DNA Microarray NanoString nCounter Illumina MiSeq RNA - Seq Tissue microarray & FISH Primer/probe design Gene - specific primer with attached quencher and reporter fluorophores; SYBR green DNA oligo probes complementary to cDNA samples Capture probe with 3’ affinity tag and Reporter probe with colour - coded tag Primers on flow cell and adaptors to ligate to ends of sample Gene - specific RNA probes; gene - specific fluorochrome - labelled probes; monoclonal antibodies Sample preparation R

NA ex traction; reverse transcribe sample RNA extraction; reverse transcribe sample , fragmentation RNA extraction RNA extraction; reverse transcribe sample; fragmentation , library construction Map donor block; place into recipient block; make TMA Instrument Th ermal cycler Microarray scanner Prep Station and Digital Analyzer MiSeq benchtop sequencer Tissue arrayer; microscope or array scanner Reproducible Yes Yes Yes Yes Yes Specificity Forward and reverse primer design, oligonucleotide probe Density of probes annealed to the slide, probe design Design of Capture and Reporter probes Rely on data analysis Rely on probes to be used Sensitivity 10 - 200 copies/cell 1 - 10 copies/cell 1 copy/cell 1 copy/cell 1 - 10 copies/cell Clinic study Yes Yes Yes Yes Yes Commercialized for clinical use Oncotype DX MammaPrint Prosigna No No Number of genes or transcripts detected 1 - 100 50 000 800 Whole transcriptome 3 Up to sample# per assay 1 - 96 1 - 12/array 12 96 1000 Processing steps Prep reaction mixture, PCR cycles, Result analysis Label cDNAs, hybridization to array, Data analysis Label probes, hybridization to array, Data analysis cDNA lib prep, sequencing, data analysis Make TMA, Slide TMA Staining, Analysis Raw Data analysis by machine in 30 minutes by machine in 1 hour 40 minutes by machine in 2.7 hours by machine in 3 hours by machine or microscopy in 6 minutes Normalization 3 - 5 housekeeping genes Housekeeping genes; RMA; LOWESS method Housekeeping genes; positive controls RPKM Tissue array co - occurrence matric analysis Data analysis Absolute and relative quantification; standard dissociation curve; statistical tests Visualization; statistical tests Colour - coded images are taken and output as code counts Data output as sequenced reads with quality scores or read alignments PCR; H and E staining; FISH, ISH; fluorescent microscopy Journal of Cancer 20 18 , Vol. 9 http://www. jcancer .org 2259 Table 2. Cost and time of qRT - PCR, DNA Microarray, NanoString nCounter, Illumina MiSeq RNA - S eq, and Tissue Microarray assay. The prices could vary from different facilities. Assay qRT - PCR DNA Microarray NanoString nCounter Illumina MiSeq RNA - Seq Tissue microarray & FISH Cost on Sample preparation $0.56 (SYBR) $0.82 (probe)/Singleplex reaction ~$50 /array $20 ~$200 - 300 $75 - 2000/array, depending on cancer type Cost on Kit or plate $1416 (SYBR) $1834 (probe)/100 preps ~$350/plate $280 - 350/1 cartridge for 12 samples (Master Kit); $3600 - 4800/12 assays (Custom CodeSet) $1200 - 2320/~12 reactions $515 for FISH Cost on Processing $0.50/sample $0.025/data point; ~$100/array $4.17/data point; $35 - 41.67/sample $90/sample $12.50/sample Cost on Data analysis $55 ~ $ 100 $65 - 250 $160 - 175 $95/slide using 3 antibodies Cost on Instrument $25 000 - $ 95 000 Or ~$25/run $50 000 - $110 000 $235 000 - $285 000 $128 000 $55 000 - $98 000 Time on Sample preparation 1 hour 20 minutes 5 minutes 8 hours 30 minutes Time on Sample processing 2 - 4 hours 60 minutes to 17 - 18 hours or overnight 5 minutes + 2.5 hours 24 hours 24 hours Time on Data Analysis 30 minutes 1 hour 40 minutes 5 minutes + 2.7 hours 3 hours 6 minutes Studies have shown that the FFPE/FF pairs demonstrate a high correlation when analyzing gene expression if the storage time of specimens is less than two years, meaning that reliable RNA can be extracted from FFPE samples in younger tissue blocks. 81 Since it only requires the Capture and Reporter probes to anneal to the template, with the Reporter probe depicting the gene of interest, the sample is prevented from accumulating errors through the reverse transcription step, allowing FFPE samples to be utilized by NanoString nCounter. It has been shown that an nCounter experiment has a high concordance (90%) rate with immunohistochemistry, demonstrating that it is reproducible. Al though nCounter shows promise in using FFPE samples, it is limited to detecting 770 genes at once. This limitation is present no matter which sample type is chosen. 81 Due to source variation and intratumor heterogeneity, individual FFPE tissues can have va rying RNA qualities. Therefore, to produce the best results from FFPE tissues, a standardized method of RNA extraction must be established. In a study comparing the Trizol, Qiagen RNeasy FFPE, and Arcturus PicoPure RNA Isolation kits for quantity and quali ty of RNA for microarray gene expression studies, an efficient method for RNA extraction, from the deparaffinization to microarray hybridization steps, was developed. The protocol includes an RNeasy FFPE kit with a modified deparaffinization protocol for R NA isolation from FFPE tissues and a combination of X3P Array Ovation and FFPE WTA System kit for amplification and hybridization. This workflow improves on FFPE tissues as a reliable alternative for FF samples. 80 Reproducibility Although qRT - PCR tests have shown consistent results across replicate assays, they are not 100% reproducible as errors may be amplified along with the exponential amplification of the original nucleotide strand and the PCR can result in some loss of information during amplificat ion. 82 Expression microarrays have also been shown to be highly reproducible, depending on the ability of a probe to anneal to the same number of transcripts across replicate experiments. The protocols used for RNA extraction and sample purification, data a cquisition and normalization, type and construction of probes, and the methods of

labelling and hybridization used greatly affect the reproducibility of DNA microarrays. 83 , 84 Numerous studies have confirmed the reproducibility of the NanoString nCounter plat form due to its requirement of little input RNA and lack of a reverse transcription step. For example, its reproducibility has been demonstrated using diffuse B - cell lymphoma (DLBCL), gastric, pancreas, xenograft, lung, breast, blood, and melanoma samples, while a separate study demonstrated inter - laboratory (Canada, Switzerland, and the United Stated) reproducibility of nCounter with medulloblastoma samples. 42, 85 , 86 Similarly, studies have used techniques such as PCR, qRT - PCR, and microarrays to show the Mi Seq platform and RNA - Seq to be reproducible. 87 , 88 , 89 , 90 For example, the SEQC/MAQC - III Consortium have demonstrated RNA - Seq to have a �80% validation with quantitative PCR (qPCR) when sequencing unannotated exon - exon junctions, yet microarrays do not provide Journal of Cancer 20 18 , Vol. 9 http://www. jcancer .org 2260 r eliable reproducibility data. 89 One of the greatest drawbacks of TMAs is the tumor inter - heterogeneity – the fact that a single spot punched from a tumor block is not representative of the rest of the tumor. Regardless, TMAs have a high degree of reproduci bility due to the maximum 1000 spots on a single slide simultaneously being sampled and subjected to an experimental test using the same reagents. Multiple punches can be sampled from one tumor block, allowing for the same tumor block to be used in multipl e experiments; for example, TMAs from one recipient block can be distributed between labs. Immunohistochemical and FISH tests can then be standardized for reproducible results. 91 Sensitivity Sensitivity refers to the minimum amount of substance, such as RNA , detected per sample in an experimental assay. qRT - PCR and PCR have a reported sensitivity of 10 copies mRNA per cell, with as many as 200 copies per cell having been detected for PCR. 92 , 93 As little as 3 copies per cell have been detected in PCR, implying that this number could be similar for qRT - PCR. 94 Similarly, DNA microarrays can detect from 1 - 10 copies of mRNA per cell. 83 Both nCounter and MiSeq have the ability to sense 1 copy of mRNA per cell; nCounter utilizes region - specific colour - coded probes to bind to a single transcript, whereas MiSeq can generate a cluster of 1000 copies from a single transcript. 46, 95 Lastly, sensitivity for TMAs can be analyzed in a number of ways as it may depend on the size of the tissue spot in the array or the sensitivity of the tests (e.g. FISH, ISH) being used. For example, TMAs can array up to 1000 different sample spots on a single array, allowing 0.6 mm as the smallest sample size that can be taken with efficient detection results; in situ hybridization is shown to hav e a sensitivity of 10 - 20 mRNA copies per cell. 67,68, 96 Specificity The specificity for each of the qRT - PCR, DNA microarray, NanoString nCounter, MiSeq RNA - Seq, and TMA depends on the primers/probes and/or reagents being used. As previously discussed, a stri ct design is required to ensure the qRT - PCR primer tightly anneals to the mRNA transcript and amplifies only the section of interest. Therefore, the specificity of qRT - PCR depends on the forward and reverse primer design, as well as the oligonucleotide pro be used in detection. 11,12, 97 The specificity of DNA microarrays depends on a number of factors, such as the density of probes annealed to the slide, the single probe (hybridization of a probe to a single target), single spot (a spot of multiple probes may contain probes that are perfectly or partially hybridized to a target), and spot - set (multiple spots represent different sections of the same sequence). 98 Similar to PCR, the specificity may also depend on the probe design; for example, cDNA microarrays can employ probes up to a few thousand base pairs in length while oligonucleotide arrays perform best with shorter probes that can be 25 - 30mer or 60 - 70mer in length. 83 The specificity of NanoString nCounter is due to its target - specific Capture and Reporter p robes, as these are designed to anneal to a nucleic acid region of interest. These combine with the internal controls used to form the CodeSet, which confers the overall specificity. 99 TMA quality is dependent on the type of analysis being done. For example , FISH, RNA FISH, and immunohistochemistry each confer different specificities to the TMA assay. 100 , 101 RNA probes about 250 - 1500 nucleotides in length, with a common recommendation of 800 nucleotides, tend to demonstrate high specificity. 102 Chemically - synthesized oligonucleotides labelled with fluorophores and calibrated to a certain region tend to generate RNA FISH probes with high specificity. 100 High - throughput High throughput refers to the advantage of a technology to simultaneously analyze many (i. e. hundreds of thousands) samples under a certain set of conditions. It therefore may depend on the number of genes that can be detected by a technique and/or the number of samples that can be processed. Well - plates that can hold a maximum of 384 samples c an be purchased for PCR. Although control samples (tests priming the housekeeping genes) and all replicates (a recommended number of three) should be run on a single plate, a qRT - PCR assay has the potential to assess 384 samples at once. This substantial n umber of wells also allow for the analyses of a few hundred genes in Singleplex reactions. 12, 103 The number of samples analyzed on a DNA microarray can depend on the purpose of the microarray and the number of genes being assessed. Whole - genome arrays can be pe

rformed for an individual or a small number of individuals can be simultaneously analyzed for a certain set of genes on one array. For example, Prosigna is able to assess up to 8 breast cancer patient samples for 1900 features on a single array. 104 , 105 It h as been reported that up to 50 000 different probes are available for detections on a microarray, with each detection representing a different gene. 106 The nCounter has the capacity to input 12 samples and detect 800 genes. 107 Approximately 1000 genes can be t argeted and 96 samples can be processed using the MiSeq benchtop sequencer; clusters of about 1000 molecules or 1536 amplicons can be generated from a single transcript and anywhere from 700 to thousands Journal of Cancer 20 18 , Vol. 9 http://www. jcancer .org 2261 of targets have been reported. 108 , 109 Similar to DNA mi croarrays, the number of samples assessed and genes detected on the TMA depends on its purpose. Generally, 1000 spots representing different samples can be arrayed on a TMA. 67,68 Although many genes have the ability to be detected as different coloured pro bes can be designed to anneal to their target region, studies tend to depict 1 - 3 genes using fluorescent detection on a TMA. 74,75,76,77 This may be because resolution can be difficult using many different probes in an in situ detection assay. Cost per assa y A qRT - PCR reaction per sample can be considered cheap in cost. Various kits can be obtained according to one’s experimental design to reverse transcribe the mRNA to cDNA and carry out the remainder qRT - PCR steps for about $300 - $550. According to BioSearc h Technologies, after all reagent costs have been accounted for, a single qRT - PCR reaction totals under $1.00. When probes are being used as the detection method, the total cost is about $0.82 per reaction; when SYBR is being used, the total cost is about $0.56 per reaction. These increase to about $0.89 and $1.13 if probes and SYBR are being used, respectively, when additional targets are present. 110 A sample processing of $0.50 has been reported. A qRT - PCR reaction per sample has been reported to cost as li ttle as $0.50 per reaction. 111 A whole microarray slide can cost between $150 - $400, with a full genome array being $500, and a processing cost of about $325 per array. Some studies have reported a cost of $0.025 per data point (or gene being analyzed). 111, 112 The NanoString nCounter provides a Master Kit and CodeSet to be purchased separately, with all necessary consumables and reagents. The Master Kit costs about $280 - 350 per 1 cartridge for 12 samples. 113 Custom or pre - designed CodeSets are available for specif ic gene detection. Pre - designed CodeSets can be purchased for $3600 - $4800 per 12 assays for analyzing samples of human stem cells, human cancer reference, or leukemia, to name a few. A custom CodeSet for 48 assays assessing 25 genes can cost about $6000, r esulting in a cost of $125 per assay and $5 per data point. Doubling the target to 50 genes nearly doubles the cost to $10 000 for 48 assays, $208.33 per assay, and $4.17 per data point. 114 Several institutes provide services to carry out an nCounter experim ent for up to $530 (University of Kentucky and the Whitehead Institute) per cartridge of 12. 112,113 A sample processing for targeted gene sequencing costs $90 on the MiSeq Benchtop sequencer, with a 50 - 500 base pair sequencing kit valued at $1400 - $2000. 115 , 116 Some institutes provide data analysis for $160 - $175. 116, 117 Prepared tissue microarrays may cost as much as $6000 (stage I breast cancer tissue array). 118 Studies have reported the cost to build and analyze a TMA to be $255 (18 cases) and $12 240 (48 cases), resulting to $12.50 per case. 119 In addition, the instruments are valued at $25 000 - $95 000 (thermal cycler for PCR), $50 000 - $110 000 (microarray scanner), $235 000 - $285 000 (NanoString Prep Station and Digital Analyzer), $128 000 (MiSeq Benchtop sequencer) , and $55 000 - $98 000 (tissue arrayers), respectively. 9, 120 , 121 , 122 , 123 , 124 , 125 Complexity and Time qRT - PCR, DNA microarrays, NanoString nCounter, and Illumina MiSeq all require the isolation and purification of RNA. Following RNA extraction, qRT - PCR requires the mixing of various reagents before allowing the sample to reverse transcribe. A well - plate must be carefully prepared prior to subjecting the sample for the PCR and dissociation curve analysis steps in the thermal cycler machine and by the computer, respect ively; this can take about 5 hours when including an RNA extraction step. Similarly, DNA microarrays require a reverse transcription step after the RNA extraction. Time is then required to allow the sample to hybridize to the array; the arrays can be pre - o rdered and do not have to be constructed in the laboratory. The microarray scanner analyzes and slides and computer software can be purchased for data analysis, resulting in a total time of 20 hours. 126 NanoString nCounter only requires the user to prepare t he initial sample and then transfer the sample to and from the Prep Station and Digital Analyzer machines. The machines carry out any processing and data analysis that needs to be done, resulting in a total of about 5.5 hours. 107 Similar to the nCounter, I llumina MiSeq only requires the user to prepare the library and load it onto the reagent cartridge; the rest of the sample processing and data analysis is carried out by the MiSeq benchtop sequencer, with the MiSeq Reporter analysis software launching foll owing completion of the trial. A total of about 40 hours is required. 115 TMA construction is a tedious procedure and therefore requires the most work, demanding an average of u

p to two days, depending on the exact procedure followed. If donor tissue blocks are not available, one must collect samples prior to preparing the block. Then, slides of the tissue sample must be stained so that one can use the tissue arrayer to accurately remove cores from the donor block and place them on the slide. Following const ruction of the slide, reagents for FISH, ISH, or immunohistochemistry tests must be prepared and applied to the slide. The slides can then be analyzed by eye or with a (digital) slide scanner. 127 Journal of Cancer 20 18 , Vol. 9 http://www. jcancer .org 2262 Clinical use/ Commercialized As discussed earlier, each of the five assays have been use in clinical - related studies to analyze the gene expression from cancer patient samples. The qRT - PCR, DNA microarray, and NanoString nCounter assays have commercialized products (Oncotype DX, MammaPrint, and PROSIGNA, respectively ) for testing clinical samples. Illumina MiSeq does not have such an assay, yet one can send samples to an institute for processing. 116,117 Tissue microarrays also do not have a commercialized assay as they are used to detect up to a few genes in a maximum of 1000 samples, requiring a cohort of patient samples to be gathered to construct a TMA. They are therefore ideal for validating studies using qRT - PCR, DNA microarrays, et cetera, and not for the assessment of individual or a small number of samples. Ta ble 3. Main advantages and disadvantages of gene expression detection assays. Advantages Disadvantages qRT - PCR a popular techno lo gy, low cost only for small number of genes Microarray works for more than 1000 genes, commercial chip/array s ready to use requires expertise for data normalization and analysis NanoString standard workflow and analysis pipeline are setup by the company m achine is cost ly , constrained by one company R NA - seq w hole transcriptome, MiS eq pipeline for data analysis m achine is cost ly , requires expertise for lib prep and sequencing FISH localiz es and detect s gene expression complicated procedure TMA detect s hundreds of samples simultaneously mainly for research, not for clinical settings Table 4. General guideline for gene expr ession assay for cancer clinical use Assay qRT - PCR DNA microarray nCounter RNAseq TMA &FISH gene# 1 - 50 ++ + 50 - 500 ++ 500 - 2000 ++ �2000 ++ purposes proteins ++ mRNAs + + + + + novel discovery ++ facility clinic lab ++ hospital lab ++ Institution c ore + + ++ n ational l ab + ++ ++ u se frequency daily ++ weekly + + monthly ++ ++ + Conclusion We summarized the main advantages and disadvantages of each method as Table 3 and setup a matrix ( Table 4 ) to guide in choosing the most practical assay based on the gene number to be tested, purposes of the assay, location of experiment to be performed, and frequency of the assay. With a sample processing fee of as little as $0.50 for a single gene, an experimental time of about 5 hours that includes RNA isolation and purification, as well as PCR and data analysis, qRT - PCR offers the cheapest and quickest assay for processing an individual clinical sample for 1 - 50 genes. Small lab oratories such as a hospital lab or a clinic lab suited to a clinical processing environment can purchase a thermal cycler for as little as $25 000 to process and analyze their sample. Other techniques employ machines that can cost up to $285 000, which ar e better suited for larger research institutes and feasible if clinical samples are sent to these institutes or a national lab to be processed. With the cost constraint, the nCounter is suited for detection of 50 - 500 genes and microarray is good for more t han 500 genes or genome - wide gene expression profiling. RNA - Seq can detect a large number of genes with the additional benefit of gene discovery, which is suited for cancer research institutions. TMAs are appropriate for protein level detection in thousand s of samples at one time, which is ideal for tumor archive centers at provincial or national facilities. In addition to the above proposed guidelines, developing an assay into clinical use must pass stringent Clinical Laboratory Improvement Amendments (CLIA) standards and a College of American Pathology certification. Diagnostic tests can result in large costs due to demonstrating improved patient mortality outcomes through replicated and randomized clinical trials. 5 The cost of an assay, then, is an im portant parameter in experimental design and should be minimized for the desire to translate results into clinical use. Medical costs are increasing in the current healthcare system as cures are being sought for all illnesses and the general population age s and increases in life expectancy, resulting in more money being put towards the elderly population’s care and medical costs. Cost - effectiveness studies may be performed on an assay to determine its economic utility for a consumer’s and society’s well - bei ng. 6, 128 New biomarkers may undergo cost - utility studies measured in sum of money per quality adjusted life year (QALY) gained, where the ratio of the cost of a test to its benefits in the number of years gained is taken. $50 000 USD per QALY gained is consi dered the upper - limit for cost - effectiveness. 126 In addition to Journal of Cancer 20 18 , Vol. 9 http://www. jcancer .org 2263 the necessity of developing an assay with low cost, the FDA guidelines for approval m

ust be met. Once FDA - approved, it is then up to clinicians to accept and employ the assay. 6 Acknowledgments This study was funded by grants from the CancerCare Manitoba Foundation (CCMF 2017, W.X.) and the Canadian Breast Cancer Foundation (CBCF 2015 - 2017, W.X). Co mpeting Interest s The authors have declared that no competing interest exists. References 1 Cotter, MB, Loda M. Introduction to Pathology. In: Loda M, Mucci LA, Mittelstadt ML, Van Hemelrijck M., Cotter MB, editors. Pathology and Epidemiology of Cancer. Switzerland: Springer International Publishing AG Switzerland; 2017: 27 - 38. 2 Lodish H, Be rk A, Zipursky SL. Proto - Oncogenes and Tumor - Suppressor Genes. Molecular Cell Biology. 2000; 4:Section 24.2. 3 Golub TR, Slonim DK, Tamayo P, Huard C, Gaasenbeek M, Mesirov JP, Coller H, Loh ML, Downing JR, Caligiuri MA, Bloomfield CD, Lander ES. Molecula r Classification of Cancer: Class Discovery and Class Prediction by Gene Expression Monitoring. Science. 1999; 286:531 - 37. 4 Goossens N, Nakagawa S, Sun X, Hoshida Y. Cancer Biomarker Discovery and Validation. Translational Cancer Research. 2015; 4:256 – 69 . 5 Damodaran S, Berger MF, Roychowdhury S. Clinical Tumor Sequencing: Opportunities and Challenges for Precision Cancer Medicine. American Society of Clinical Oncology Educational Book. 2015; e175 - 82. 6 Füzéry AK, Levin J, Chan MM, Chan DW. Translation of Proteomic Biomarkers into FDA Approved Cancer Diagnostics: Issues and Challenges. Clinical Proteomics. 2013; 10:13. 7 Brooks JD. Translational Genomics: The Challenge of Developing Cancer Biomarkers. Genome Research. 2012; 22:183 - 7. 8 Ferre F. Quantit ative or Semi - Quantitative PCR: Reality versus Myth. PCR Methods and Applications. 1992; 2:1 - 9. 9 Dharmaraj S. The Basics: RT - PCR. http://www.thermofisher.com/ca/ en/home/references/ambion - tech - support/rtpcr - analysis/general - articles/r t -- pcr - the - basics.ht ml . 10 National Center for Biotechnology Information. Real - Time qRT - PCR. Revised 2017. https://www.ncbi.nlm.nih.gov/probe/docs/techqpcr/ . 11 Wong ML, Medrano JF. Real - Time PCR for mRNA Quantitation. Biotechniques. 2005; 39: 75 - 85. 12 Udvardi MK, Czechowski T, Scheible W. Eleven Golden Rules of Quantitative RT - PCR. The Plant Cell. 2008; 20:1735 - 37. 13 Marx A, Seitz O. Molecular Beacons Signalling Nucleic Acid Probes, Methods, and Protocols. Totowa (NJ): Human Press; 2008. 14 Labourier E, Shifrin A, Busseniers AE, Lupo MA, Manganelli ML, Andruss B, Wylie D, Beaudenon - Huibregtse S. Molecular Testing for miRNA, mRNA, and DNA on Fine - Needle Aspiration Improves the Preoperative Diagnosis of Thyroid Nodules with Indeterminate Cytology. The Journal of Clinical Endocr inology and Metabolism. 2015; 100:2743 - 50. 15 Cronin M, Sangli C, Liu M, Pho M, Dutta D, Nguyen A, Jeong J, Wu J, Langone K, Watson D. Analytical Validation of the Oncotype DX Genomic Diagnostic Test for Recurrence Prognosis and Therapeutic Response Predic tion in Node - Negative, Estrogen Receptor - Positive Breast Cancer. Clinical Chemistry . 2007; 53:1084 - 91. 16 Knezevic D, Goddard AD, Natraj N, Cherbavaz DB, Clark - Langone KM, Snable J, Watson D, Falzarano SM, Magi - Galluzzi C, Klein EA, Quale C. Analytical Validation of the Oncotype DX Prostate Cancer Assay – A Clinical RT - PCR Assay Optimized for Prostate Needle Biopsies. BMC Genomics. 2013; 14:690. 17 Gray RG, Quirke P, Handley K, Lopatin M, Magill L, Baehner FL, Beaumont C, Clark - Langone KM, Yoshizawa CN, Lee M, Watson D, Shak S, Kerr DJ. Validation study of a quantitative multigene reverse transcriptase - polymerase chain reaction assay for assessment of recurrence risk in patients with stage II colon cancer. Journal Of Clinical Oncology. 2011; 29:4611 - 19. 18 Webber EM, Lin JS, Evelyn P Whitlock. Oncotype DX Tumor Gene Expression Profiling in Stage II Colon Cancer. PLoS Currents. 2010; 2:pii RRN1177. 19 Bustin SA, Mueller R. Real - time reverse transcription PCR (qRT - PCR) and its potential use in clinical diagn osis. Clinical Science (London, England). 2005; 109:365 - 79. 20 Rizzi F, Belloni L, Crafa P, Lazzaretti M, Remondini D, Ferretti S, Cortellini P, Corti A, Bettuzzi S. A Novel Gene Signature for Molecular Diagnosis of Human Prostate Cancer by RT - PCR. PLoS ON E. 2008; 3:e3617. 21 Kratz JR, He J, Van Den Eeden SK, Zhu ZH, Gao W, Pham PT, Mulvihill MS, Ziaei F, Zhang H, Su B, Zhi X, Quesenberry CP, Habel LA, Deng Q, Wang Z, Zhou J, Li H, Huang MC, Yeh CC, Segal MR, Ray MR, Jones KD, Raz DJ, Xu Z, Jahan TM, Berrym an D, He B, Mann MJ, Jablons DM. A Practical Molecular Assay to Predict Survival in Resected Non - Squamous, Non - Small - Cell Lung Cancer: Development and International Validation Studies. Lancet. 2012; 379:823 - 32. 22 Chen HY, Yu SL, Chen CH, Chang GC, Chen CY , Yuan A, Cheng CL, Wang CH, Terng HJ, Kao SF, Chan WK, Li HN, Liu CC, Singh S, Chen WJ, Chen JJ, Yang PC. A five - gene signature and clinical outcome in non - small - cell lung cancer. The New England Journal of Medicine. 2007; 356:11 - 20. 23 Bumgarner R. DNA M icroarrays: Types, Applications and their Future. Current Protocols in Molecular Biology. 2013; 22:Unit - 22.1. 24 Smyth GK, Altman NS. Separate - Channel Analysis of Two - Channel Microarrays: Recovering Inter - Spot Information. BMC Bioinformatics. 2013; 14:165. 25 de Mello - Coel

ho V, Hess KL. A Conceptual and Practical Overview of cDNA Microarray Technology: Implications for Basic and Clinical Science. Brazilian Journal of Medical and Biological Research. 2005; 38:1543 - 52. 26 Lenoir T, Giannella E. The Emergence and Diffusion of DNA Microarray Technology. Journal of Biomedical Discovery and Collaboration. 2006; 1:11. 27 National Center for Biotechnology Information. Bead Arrays. Revised 2017. https://www.ncbi.nlm.nih.gov/probe/docs/techbeadarray/. 28 Promega. Prot ocols and Applications Guide Expression Analysis. Revised 2017. https://www.promega.ca/resources/product - guides - and - selectors/ protocols - and - applications - guide/expression - analysis/ . 29 Yoon D, Yi S - G, Kim J - H, Park T. Two - Stage Normalization using Background Intensities in cDNA Microarray Data. BMC Bioinformatics. 2004; 5:97. 30 Alexander EK, Kennedy GC, Baloch ZW, Cibas ES, Chudova D, Diggans J, Friedman L, Kloos RT, LiVolsi VA, Mandel SJ, Raab SS, Rosai J, Steward DL, Walsh PS, Wilde JI, Zeiger MA , Lanman RB, Haugen BR. Preoperative Diagnosis of Benign Thyroid Nodules with Indeterminate Cytology. New England Journal of Medicine. 2012; 1:89 - 91. 31 Wallden B, Storhoff J, Nielsen T, Dowidar N, Schaper C, Ferree S, Liu S, Leung S, Geiss G, Snider J, Vi ckery T, Davies SR, Mardis ER, Gnant M, Sestak I, Ellis MJ, Perou CM, Bernard PS, Parker JS. Development and Verification of the PAM50 - based Prosigna Breast Cancer Gene Signature Assay. BMC Medical Genomics. 2015; 8:54. 32 Gökmen - Polar Y, Badve S. Molecula r Profiling Assays in Breast Cancer: Are We Ready for Prime Time? Oncology (Williston Park, N.Y.). 2012; 26:350 - 7, 361. 33 Wilkerson MD, Yin X, Hoadley KA, et al. Lung Squamous Cell Carcinoma mRNA Expression Subtypes are Reproducible, Clinically - Important and Correspond to Different Normal Cell Types. Clinical Cancer Research. 2010; 16:4864 - 4875. 34 Wiestner A, Rosenwald A, Barry TS, Wright G, Davis RE, Henrickson SE, Zhao H, Ibbotson RE, Orchard JA, Davis Z, Stetler - Stevenson M, Raffeld M, Arthur DC, Marti GE, Wilson WH, Hamblin TJ, Oscier DG, Staudt LM. ZAP - 70 Expression Identifies a Chronic Lymphocytic Leukemia Subtype with Unmutated Immunoglobulin Genes, Inferior Clinical Outcome, and Distinct Gene Expression Profile. Blood. 2003; 101:4944 - 51. 35 Bibikov a M, Yeakley JM, Chudin E, Chen J, Wickham E, Wang - Rodriguez J, Fan JB. Gene Expression Profiles in Formalin - Fixed, Paraffin - Embedded Tissues Obtained with a Novel Assay for Microarray Analysis. Clinical Chemistry. 2004; 50:2384 - 6. 36 Geiss GK, Bumgarner R E, Birditt B, Dahl T, Dowidar N, Dunaway DL, Fell HP, Ferree S, George RD, Grogan T, James JJ, Maysuria M, Mitton JD, Oliveri P, Osborn JL, Peng T, Ratcliffe AL, Webster PJ, Davidson EH, Hood L, Dimitrov K. Direct Multiplexed Measurement of Gene Expression with Colour - Coded Probe Pairs. Nature Biotechnology. 2008; 26:317 - 25. 37 NanoString Technologies, Inc. Total RNA and Cell Lysate Protocols. nCounterTM Gene Expression Assay Manual. 2009. 38 NanoString Technologies, Inc. Gene Expression Data Analysis Guide lines. 2017. 39 Nielsen T, Wallden B, Schaper C, Ferree S, Liu S, Gao D, Barry G, Dowidar N, Maysuria M, Storhoff J. Analytical Validation of the PAM50 - Based Prosigna Breast Cancer Prognostic Gene Signature Assay and nCounter Analysis System Using Formalin - Fixed Paraffin - Embedded Breast Tumor Specimens. BMC Cancer. 2014; 14:177. 40 Chen X, Deane NG, Lewis KB, Li J, Zhu J, Washington MK, Beauchamp RD. Comparison of NanoString nCounter Data on FFPE Colon Cancer Samples and Affymetrix Microarray Data on Matche d Frozen Tissues. PLoS One. 2016; 11:e0153784. 41 Lee J, Sohn I, Do IG, Kim KM, Park SH, Park JO, Park YS, Lim HY, Sohn TS, Bae JM, Choi MG, Lim DH, Min BH, Lee JH, Rhee PL, Kim JJ, Choi DI, Tan IB, Das K, Tan P, Jung SH, Kang WK, Kim S. Nanostring - Based M ultigene Assay to Predict Recurrence for Gastric Cancer Patients after Surgery. PLoS One. 2014; 9:e90133. 42 Northcott PA, Shih DJ, Remke M, Cho YJ, Kool M, Hawkins C, Eberhart CG, Dubuc A, Guettouche T, Cardentey Y, Bouffet E, Pomeroy SL, Marra Journal of Cancer 20 18 , Vol. 9 http://www. jcancer .org 2264 M, Malkin D, Rutka JT, Korshunov A, Pfister S, Taylor MD. Rapid, Reliable, and Reproducible Molecular Sub - Grouping of Clinical Medulloblastoma Samples. Acta Neuropathologica. 2012; 123:615 - 26. 43 Kukurba KR, Montgomery ST. RNA Sequencing and Analysis. Cold Spring Ha rbor Protocols. 2015; 2015:951 - 69. 44 Wang Z, Gerstein M, Snyder M. RNA - Seq: A Revolutionary Tool for Transcriptomics. Nature Reviews. Genetics. 2009; 10:57 - 63. 45 Rotem A, Ram O, Sperling RA, Schnall - Levin M, Zhang H, Basu A, Bernstein BE, Weitz DA. High - Throughput Single - Cell Labelling (Hi - SCL) for RNA - Seq Using Drop - Based Microfluidics. PLoS One. 2015; 10:e0116328. 46 Illumina, Inc. Illumina Sequencing Technology – Highest Data Accuracy, Simple Workflow, and a Broad Range of Applications. Technology Spotlight: Illumina® Sequencing. 2010. 47 Illimuna, Inc. MiSeq System Guide. 2015 Sep:15027617 v01. 48 Illumina, Inc. MiSeq Reporter Targeted RNA Workflow – Reference Guide. Illumina, Inc. 2014; 15042321 Rev. C. 49 Engström PG, Steijger T, Sipos B, Grant GR, Kahles A, Rätsch G, Goldman N, Hubbard TJ, Harrow J, Guigó R, Bertone P. Systematic Evaluat

ion of Spliced Alignment Programs for RNA - Seq Data. Nature Methods. 2013; 10:1185 - 91. 50 Wang K, Singh D, Zeng Z, Coleman SJ, Huang Y, Savich GL, He X, Mieczkows ki P, Grimm SA, Perou CM, MacLeod JN, Chiang DY, Prins JF, Liu J. MapSplice: Accurate Mapping of RNA - Seq Reads for Splice Junction Discovery. Nucleic Acids Research. 2010; 38:e178. 51 Rossell D, Attolini C, Kroiss M, Stöcker A. Quantifying Alternative Spli cing from Paired - End RNA - Sequencing Data. Annals of Applied Statistics. 2014; 8:309 - 30. 52 Walsh T, Lee MK, Casadei S, Thornton AM, Stray SM, Pennil C, Nord AS, Mandell JB, Swisher EM, King M. Detection of Inherited Mutations for Breast and Ovarian Cancer Using Genomic Capture and Massively Parallel Sequencing. Proceedings of the National Academy of Sciences. 2010; 107:12629 - 12633. 53 Marchetti A, Del Grammastro M, Filice G, Felicioni L, Rossi G, Graziano P, Sartori G, Leone A, Malatesta S, Iacono M, Guetti L, Viola P, Mucilli F, Cuccurullo F, Buttitta F. Complex Mutations & Subpopulations of Deletions at Exon 19 of EGFR in NSCLC Revealed by Next Generation Sequencing: Potential Clinical Implications. PLoS One. 2012; 7:e42164. 54 Grossmann V, Roller A, Klein HU, Weissmann S, Kern W, Haferlach C, Dugus M, Haferlach T, Schnittger S, Kohlmann A. Robustness of Amplicon Deep Sequencing Underlines its Utility in Clinical Applications. The Journal of Molecular Diagnostics: JMD. 2013; 15:473 - 84. 55 Best MG, Sol N, Ko oi I, Tannous J, Westerman BA, Rustenburg F, Schellen P, Verschueren H, Post E, Koster J, Ylstra B, Ameziane N, Dorsman J, Smit EF, Verheul HM, Noske DP, Reijneveld JC, Nilsson RJA, Tannous BA, Wesseling P, Wurdinger T. RNA - Seq of Tumor - Educated Platelets Enables Blood - Based Pan - Cancer, Multiclass, and Molecular Pathway Cancer Diagnostics. Cancer Cell. 2015; 28:666 - 76. 56 Langer - Safer PR. Levine M. Ward DC. Immunological method for mapping genes on Drosophila polytene chromosomes. Proceedings of the Nationa l Academy of Sciences. 1982;79: 4381 – 5. 57 Levsky JM, Singer RH. Fluorescence in situ hybridization: past, present and future. Journal of Cell Science. 2003; 116:2833 - 38. 58 Jensen E. Technical Review: In Situ Hybridization. Anatomical Record (Hoboken, NJ. :2007). 2014; 297:1349 - 53. 59 Trask BJ. Fluorescence in situ hybridization: Applications in cytogenetics and gene mapping. Trends in Genetics: TIG. 1991; 7:149 - 54. 60 Larsson C, Grundberg I, Söderberg O, Nilsson M. In situ detection and genotyping of indiv idual mRNA molecules. Nature Methods. 2010; 7:395 - 397. 61 Furlan A, Kherrouche Z, Montagne R, Copin MC, Tulasne D. Thirty years of research on met receptor to move a biomarker from bench to bedside. Cancer Research. 2014; 74:6737 – 6744. 62 Schmid E, Klotz M , Steiner - Hahn K, Konen T, Frisk AL, Schatz C. Detection of MET mRNA in gastric cancer in situ. Comparison with immunohistochemistry and sandwich immunoassays. Journal Biotechnic & Histochemistry. 2017; 92: 425 - 435. 63 Renwick N, Cekan P, Masry PA, McGeary SE, Miller JB, Hafner M, Li Z, Mihailovic A, Morozov P, Brown M, Gogakos T, Mobin MB, Snorrason EL, Feilotter HE, Zhang X, Perlis CS, Wu H, Suárez - Fariñas M, Feng H, Shuda M, Moore PS, Tron VA, Chang Y, Tuschl T. Multicolor microRNA FISH effectively diffe rentiates tumor types. Journal of Clinical Investigation. 2013; 123:2694 - 702. 64 Patel Y, Shah N, Lee JS, Markoutsa E, Jie C, Liu S, Botbyl R, Reisman D, Xu P, Chen H. A novel double - negative feedback loop between miR - 489 and the HER2 - SHP2 - MAPK signaling a xis regulates breast cancer cell proliferation and tumor growth. Oncotarget. 2016; 7:18295 - 308. 65 Huang Y, Zhang J, Hou L, Wang G, Liu H, Zhang R, Chen X, Zhu J. LncRNA AK023391 promotes tumorigenesis and invasion of gastric cancer through activation of t he PI3K/Akt signaling pathway. Journal of Experimental & Clinical Cancer Research. 2017; 36:194. 66 Bertozzi D, Iurlaro R, Sordet O, Marinello J, Zaffaroni N, Capranico G. Characterization of novel antisense HIF - 1a transcripts in human cancers. Cell Cycle. 2011; 10:3189 - 97. 67 Kononen J, Bubendorf L, Kallioniemi A, Bärlund M, Schraml P, Leighton S, Torhorst J, Mihatsch MJ, Sauter G, Kallioniemi OP. Tissue Microarrays for High - Throughput Molecular Profiling of Tumor Specimens. Nature Medicine. 1998; 4:844 - 47 . 68 Dan H, Zhang Y, Wang Y, Lai Z, Yang Y, Cui H, Jian Y, Geng J, Ding Y, Guo C, Zhou D. A Novel Method for Preparation of Tissue Microarray. World Journal of Gastroenterology. 2004; 10: 579 - 82. 69 Shi Y, He D, Hou Y, Hu Q, Xu C, Liu Y, Jiang D, Su J, Zeng H, Tan Y. An Alternative High Throughput Tissue Microarray Technique. Diagnostic Pathology. 2013; 8:9. 70 Simon R. Tissue Microarrays Methods and Protocols. New York (NY): Humana Press; 2010. 71 Bayani J, Squire JA. Fluorescence in situ Hybridization (FISH). Current Protocols in Cell Biology. 2004; Chapter 22:Unit 22.4. 72 Thallinger GG, Baumgartner K, Pirklbauer M, Urau M, Pauritsch E, Mehes G, Buck CR, Zatloukal K, Trajanoski A. TAMEE: Data Management and Analysis for Tissue Microarrays. BMC Bioinfor matics. 2007; 8:81. 73 Yan D, Wang P, Knudsen BS, Linden M, Randolph TW. Statistical Methods for Tissue Array Images – Algorithmic Scoring and Co - Training. Annals of Applied Statistics. 2013; 6:1280 - 1305. 74 Richter J, Wagner U, Kononen J, Fijan A, Bruderer J, Schmid U, Achermann D, Maurer R, Alund G, Knönagel H, Rist M, Wilber K, Anabitarte M, Hering F, Hardmeier T, Schononberger A, Flury R, Jäger P, Fehr JL, Schraml P, Moch H, Mihatsch MJ, Gasser T, Kallioniemi OP, Sauter

G. High - Throughout Tissue Microarray Analysis of Cyclin E Gene Amplification and Overexpression in Urinary Bladder Cancer. The American Journal of Pathology. 2000; 157:787 - 94. 75 Torhorst J, Bucher C, Kononen J, Haas P, Zuber M, Köchli OR, Mross F, Dieteriach H, Moch H, Mihatsch M, Kallioniemi OP, Sauter G. Tissue Microarrays for Rapid Linking of Molecular Changes to Clinical Endpoints. The American Journal of Pathology. 2001; 159:2249 - 56. 76 Parker RL, Huntsman DG, Lesack DW, Cupples JB, Grant DR, Akbari M, Gilks CB. Assessment of Interlaboratory Variation in the Immunohistochemical Determination of Estrogen Receptor Status Using a Breast Cancer Tissue Microarray. The American Journal of Pathology. 2002; 117:123 - 28. 77 Mousses S, Bubendorf L, Wagner U, Hostetter G, Kononen J, Cornel ison R, Goldberger N, Elkahloun AG, Willi N, Koivisto P, Ferhle W, Raffeld M, Sauter G, Kallioniemi OP. Clinical Validation of Candidate Genes Associated with Prostate Cancer Progression in the CWR22 Model System Using Tissue Microarrays. Cancer Research. 2002; 62:1256 - 60. 78 Varambally S, Dhanasekaran SM, Zhou M, Barrette TR, Kumar - Sinha C, Sanda MG, Ghosh D, Pienta KJ, Sewalt RG, Otte AP, Rubin MA, Chinnaiyan AM. The Polycomb Group Protein EZH2 is Involved in Progression of Prostate Cancer. Nature. 2002; 419:624 - 29. 79 Ripoli F, Mohr A, Hammer S, Willenbrock S, Hewicker - Trautwein M, Hennecke S, Escobar H, Nolte I. A Comparison of Fresh Frozen vs. Formalin - Fixed Paraffin - Embedded Specimens of Canine Mammary Tumors via Branched DNA - Assay. International Journ al of Molecular Sciences. 2016; 17:pii E724. 80 Belder N, Coskun Ö, Erdogan B, Ilk O, Savas B, Ensari A, Özdağ H. From RNA Isolation to Microarray Analysis: Comparison of Methods in FFPE Tissues. Pathology, Research and Practice. 2016; 212:678 - 85. 81 Zhang P, Lehmann BD, Shyr Y, Guo Y. The Utilization of Formalin Fixed - Paraffin - Embedded Specimens in High Throughput Genomic Studies. International Journal of Genomics. 2017; 2017:1926304. 82 Tichopad A, Dzidic A, Pfaffl MW. Improving Quantitative Real - Time RT - PCR Reproducibility by Boosting Primer - Linked Amplification Efficiency. Biotechnology Letters. 2002; 24:2053 - 2056. 83 Draghici S, Khatri P, Eklund AC, Szallasi Z. Reliability and Reproducibility Issues in DNA Microarray Measurements. Trends in Genetics. 20 06; 22:101 - 109. 84 Naderi A, Ahmed AA, Barbosa - Morais NL, Aparicio S, Brenton JD, Caldas C. Expression Microarray Reproducibility is Improved by Optimising and Purification Steps in RNA Amplification and Labelling. BMC Genomics. 2004; 5:9. 85 Veldman - Jones M.H, Lai Z, Wappett M, Harbron CG, Barrett JC, Harrington EA, Thress KS. Reproducible, Quantitative, and Flexible Molecular Subtyping of Clinical DLBCL Samples Using the NanoString nCounter System. Clinical Cancer Research. 2015; 21:2367 - 78. 86 Veldman - Jo nes MH, Brant R, Rooney C, Geh C, Emrey H, Harbron CG, Wappett M, Sharpe A, Dymond M, Barrett JC, Harrington EA, Marshall G. Evaluating Robustness and Sensitivity of the NanoString Technologies nCounter Platform to Enable Multiplexed Gene Expression Analys is of Clinical Samples. Cancer Research. 2015; 75:2587 - 93. 87 Mellman A, Anderson PS, Bletz S, Friedrish AW, Kohl TA, Lilje B, Niemann S, Prior K, Rossen JW, Harmsen D. High Interlaboratory Reproducibility and Accuracy of Next - Generation - Sequencing - Based B acterial Genotyping in a Ring Trial. Journal of Clinical Microbiology. 2017; 55:908 - 913. 88 Peixoto L, Risso D, Poplawski SG, Wimmer ME, Speed TP, Wood MA, Abel T. How Data Analysis Affects Power, Reproducibility and Biological Insight of RNA - Seq Studies i n Complex Datasets. Nucleic Acids Research. 2015; 43:7664 - 7674. 89 SEQC/MAQC - III Consortium. A Comprehensive Assessment of RNQ - Seq Accuracy, Reproducibility and Information Content by the Sequencing Quality Control Consortium. Nature Biotechnology. 2014; 3 2:903 - 914. Journal of Cancer 20 18 , Vol. 9 http://www. jcancer .org 2265 90 Wen C, Wu L, Qin Y, Van Nostrand JD, Ning D, Sun B, Xue K, Liu F, Deng Y, Liang Y, Zhou J. Evaluation of the Reproducibility of Amplicon Sequencing with Illumina MiSeq Platform. PLoS One. 2017; 12:e0176716. 91 Jawhar N. Tissue Microarray: A R apidly Evolving Diagnostic and Research Tool. Annals of Saudi Medicine. 2009; 29:123 - 27. 92 Labrenz M, Brettar I, Christen R, Flavier S, Bötel J, Höfle MG. Development and Application of a Real - Time PCR Approach for Quantification of Uncultured Bacteria in the Central Baltic Sea. Applied and Environmental Microbiology. 2004; 70:4971 - 79. 93 Wagatsuma A, Sadamoto H, Kitahashi T, Lukowiak K, Urano A, Ito E. Determination of the Exact Copy Numbers of Particular mRNAs in a Single Cell by Quantitative Real - Time R T - PCR. The Journal of Experimental Biology. 2005; 208:2389 - 98. 94 Bustin SA, Benes V, Garson JA, Hellemans J, Huggett J, Kubista M, Mueller R, Nolan T, Pfaffl MW, Shipley GL, Vandesompele J, Wittwer CT. The MIQE Guidelines: Minimum Information for Publicat ion of Quantitative Real - Time PCR Experiments. Clinical Chemistry. 2009; 55:611 - 22. 95 nanoString. nCounter® Technology. Revised 2017. https://www.nanostring .com/scientific - content/technology - overview/ncounter - technology. 96 GeneDetect. In situ Hybridizat ion – The Issues. Revised 2017. http://www.genedetect.com/insitu.htm. 97 Vaerman JL, Saussoy P, Ingargiola I. Evaluation of Real - Time PCR Data. Journal of Biological Regulators and Homeostatic Agents. 2004; 18:212 - 14. 98 Koltai H, Weingarten - Baror C. Speci ficity of DNA Mic

roarray Hybridization: Characterization, Effectors, and Approaches for Data Correction. Nucleic Acids Research. 2008; 36:2395 - 405. 99 NanoString Technologies. nCounter® Gene Expression Strategies for Successful Gene Expression Assays. TECH NOTE Strategies for Successful Gene Expression Assays; 2015. 100 Arvey A, Hermann A, Hsia CC, Ie E, Freund Y, McGinnis W. Minimizing Off - Target Signals in RNA Fluorescent In situ Hybridization. Nucleic Acids Research. 2010; 38:e115. 101 Donati V, Faviana P, Dell’omodarme M, Prati MC, Camacci T, De Ieso K, Giannini R, Lucchi M, Mussi A, Pingitore R, Basolo F, Fontanini G. Applications of Tissue Microarray Technology in Immunohistochemistry: A Study on c - kit Expression in Small Cell Lung Cancer. Human Patholog y. 2004; 35:1347 - 52. 102 ThermoFisher Scientific Incorporated. Ten Tips for In Situ Hybridization of Tissue Microarrays. https://www.thermofisher.com/ca/en/home/ references/ambion - tech - support/microrna - studies/general - articles/ten - tips - for - in - situ - hybridiza tion - .html. 103 Sinicropi D, Cronin M, Liu M. BioMEMS and Biomedical Nanotechnology. Boston, MA: Springer; 2006. 104 Wittner BS, Sgroi DC, Ryan PD, Bruinsma TJ, Glas AM, Male Am Dahiya S, Habin K, Bernards R, Haber DA, van’t Veer LJ, Ramaswamy S. Analysis of the MammaPRint Breast Cancer Assay in a Predominantly Postmenopausal Cohort. Clinical Cancer Research. 2008; 14:2988 - 93. 105 Glas AM, Floore A, Delahaye L, Witteveen AT, Pover R, Bakx N, Lahti - Domenici J, Bruinsma TJ, Warmoes MO, Bernards R, Wessels L, van ’t Veer LJ. Converting a Breast Cancer Microarray Signature into a High - Throughput Diagnostic Test. BMC Genomics. 2006; 7:278. 106 King HC, Sinha AA. Gene Expression Profile Analysis by DNA Microarrays: Promise and Pitfalls. JAMA. 2001; 286:2280 - 88. 107 nano String Technologies. nCounter® Analysis System. Product Data Sheet nCounter Analysis System. 2015. 108 Illumina®. MiSeq® System Applications. 2014; 770 - 2011 - 023. 109 Illumina®. Benefits of NGS Targeted Resequencing – Taking Science Further: Beyond qPCR and S anger Sequencing for Somatic Germline Variant Detection. 2017; 770 - 2016 - 012. 110 BIOSEARCH Technologies. How Much is Your qPCR Assay Really Costing You? Revised 02. http://blog.biosearchtech.com/how - much - is - your - qpcr - assay - really - costing - you . 111 Croy BA, Yamada AT, DeMayo FJ, Adamson SL. The Guide to Investigation of Mouse Pregnancy. Academic Press; 2013. 112 Whitehead Institute. Pricing. Revised 20 September 2017. http://jura .wi.mit.edu/genomecorewiki/index.php/Pricing . 113 Wall D. nCounter System from Nan ostring Technologies. Revised 14 June 2013. http://www.research.uky.edu/microarray/nCountersystem.htm . 114 Princess Margaret Genomics Centre. NanoString nCounterTM System. Revised 2015. https://www.pmgenomics.ca/pmgenomics/services/ nanostring.html. 115 Illu mina, Inc. A Wide Breadth of Sequencing Applications (Targeted Gene Sequencing). Revised 2018. https://www.illumina.com/systems/sequencing - platforms/miseq/applications.html . 116 Cornell University Institute of Biotechnology. Price List. Revised 2018. http: //www.biotech.cornell.edu/brc/genomics/services/price - list . 117 DNASU Next Generation Sequencing at Arizona State University. Illumina Sequencing Pricing. Revised 2016. http://dnasusequencing.org/nextgen/ pricingnextgen.html . 118 Cooperative Human Tissue Net work at the University of Virginia. Currently Available Tissue Microarrays. https://chtn.sites.virginia.edu/tissue - microarrays . 119 Thomson TA, Zhou C, Ceballos K, Knight B. Tissue Microarray for Routine Clinical Breast Biomarker Analysis. The British Colu mbia Cancer Agency 2008 Experience. American Journal of Clinical Pathology. 2010; 133:909 - 14. 120 Terra Universal. InnoScan® 710 Series Microarray Scanners. LaboratoryEquipment.com. Revised 2018. Available at: https://www .laboratory - equipment.com/microarra y/innoscan - 710 - series - microarray - scan ners - arrayit.php . 121 VWR International. GenePix 4300 and 4400 Microarray Scanner, Molecular Devices. https://us.vwr.com/store/product/14491801/genepix - 4300 - and - 4400 - micro array - scanner - molecular - devices . 122 MarketWatch . 10 - K: NanoString Technologies Inc. Revised 27 March 2014. https://www.marketwatch.com/story/10 - k - nanostring - technologies - inc - 201 4 - 03 - 27. 123 Quail MA, Smith M, Coupland P, Otto TD, Harris SR, Connor TR, Bertoni A, Swerdlow HP, Gu Y. A tale of three next generation sequencing platforms: comparison of Ion Torrent, Pacific Biosciences and Illumina MiSeq sequencers. BMC Genomics. 2012; 13:341. 124 Veridiam. Pricing Veridiam Tissue Arrayer. Revised 2011. http://www.veridiamtissuearrayer.com/pricing.html. 125 IHC World. Tissue Microarray Instruments and Kits. Revised 2011. http://www.ihcworld.com/products/Tissue - Microarray - Instrument.htm. 126 Raymond F, Carbonneau J, Boucher N, Robitaille L, Boisvert S, Wu WK, De Serres G, Boivin G, Corbeil J. Comparison of Automated Microarray Detection with Real - Time PCR Assays for Destection of Respiratory Viruses in Specimens Obtained from Children. Journal of Clinical Microbiology. 2009; 47:743 - 50. 127 Kampf C, Olsson I, Ryberg U, Sjöstedt E, Pontén F. Production of Tissu e Microarrays, Immunohistochemistry Staining and Digitalization Within the Human Protein Atlas. Journal of Visualized Experiments: JoVE. 2012; pii 3620. 128 Scott MG. When do New Biomarker Make Economic Sense? Scandinavian Journal of Clinical and Laboratory Investigation. Supplementum. 2010; 242