/
Production of butyric acid at constant pH Production of butyric acid at constant pH

Production of butyric acid at constant pH - PDF document

tracy
tracy . @tracy
Follow
342 views
Uploaded On 2022-08-20

Production of butyric acid at constant pH - PPT Presentation

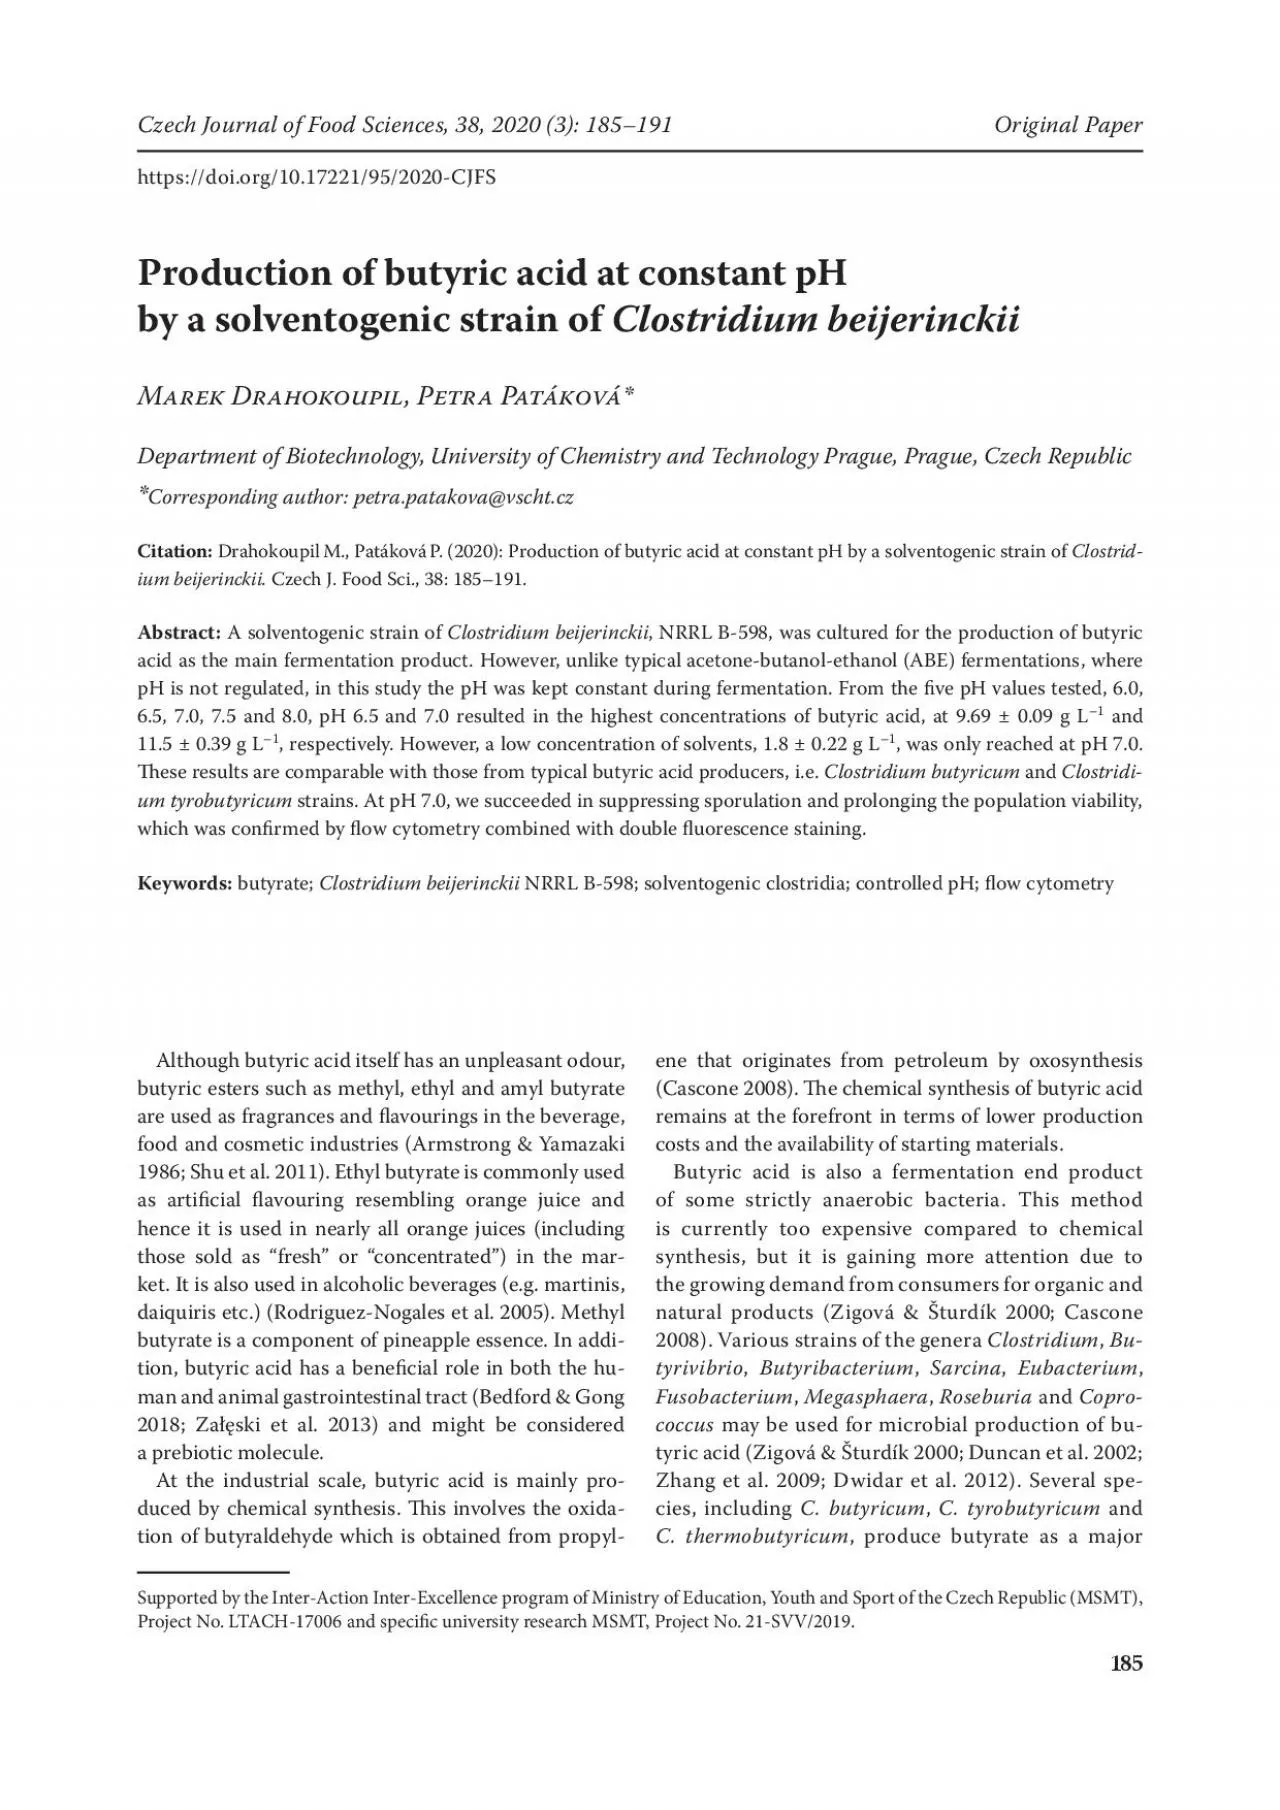
185 by a31solventogenic strain of Clostridium beijerinckii M31302928 D30312726282625242322 P29213031 P31212028261920 D ID: 938569

acid 150 fermentation butyric 150 acid butyric fermentation production cells butanol clostridium nrrl concentration 598 figure beijerinckii strain time

Share:

Link:

Embed:

Download Presentation from below link

Download Pdf The PPT/PDF document "Production of butyric acid at constant p..." is the property of its rightful owner. Permission is granted to download and print the materials on this web site for personal, non-commercial use only, and to display it on your personal computer provided you do not modify the materials and that you retain all copyright notices contained in the materials. By downloading content from our website, you accept the terms of this agreement.


Presentation Transcript

185 Production of butyric acid at constant pH by asolventogenic strain of Clostridium beijerinckii M D, P P * Department of Biotechnology, University of Chemistry and Technology Prague, Prague, Czech Republic * Corresponding author: petra.patakova@vscht.cz Citation: Drahokoupil M., Patáková P. (2020): Production of butyric acid at constant pH by asolventogenic strain of - ium beijerinckii. Czech J. Food Sci., 38: 185–191. Abstract: Asolventogenic strain of Clostridium beijerinckii , NRRLB-598, was cultured for theproduction of butyric acid as themain fermentation product. However, unlike typical acetone-butanol-ethanol (ABE) fermentations, where pH is not regulated, in this study thepH was kept constant during fermentation. From theve pH values tested, 6.0, 6.5, 7.0, 7.5and 8.0, pH6.5and 7.0 resulted in thehighest concentrations of butyric acid, at9.69±0.09 g L –1 and 11.5±0.39g L , respectively. However, alow concentration of solvents, 1.8±0.22 g L –1 , was only reached at pH 7.0. ese results are comparable with those from typical butyric acid producers, i.e. Clostridium butyricum and Clostridi - um tyrobutyricum strains. AtpH 7.0, we succeeded in suppressing sporulation and prolonging thepopulation viability, which was conrmed by ow cytometry combined with double uorescence staining. Keywords: butyrate; NRRL B-598; solventogenic clostridia; controlled pH; ow cytometry Although butyric acid itself has an unpleasant odour, butyric esters such as methyl, ethyl and amyl butyrate are used as fragrances and avourings in thebeverage, food and cosmetic industries (Armstrong & Yamazaki 1986; Shu et al. 2011). Ethyl butyrate is commonly used asarticial avouringresemblingorange juiceand hence it is used in nearly all orange juices (including those sold as “fresh” or “concentrated”) in themar - ket.It is also used in alcoholic beverages (e.g. martinis, daiquiris etc.) (Rodriguez-Nogales et al. 2005). Methyl butyrate is acomponent of pineapple essence. In addi - tion, butyric acid has abenecial role in both thehu - man and animal gastrointestinal tract (Bedford & Gong 2018; Zaski et al. 2013) and might be considered aprebiotic molecule. At theindustrial scale, butyric acid is mainly pro - duced by chemical synthesis. is involves theoxida - tion of butyraldehyde which is obtained from propyl - ene that originates from petroleum by oxosynthesis remains at theforefront in terms of lower production costs and theavailability of starting materials. Butyric acid is also afermentation end product of some strictly anaerobic bacteria. This method is currently too expensive compared to chemical synthesis, but it is gaining more attention due to thegrowing demand from consumers for organic and natural products (Zigová &Šturdík 2000; Cascone 2008). Various strains of thegenera Clostridium , Bu - , Butyribacterium , Sarcina , Eubacterium , Fusobacterium , Megasphaera , Roseburia and Copro - coccus may be used for microbial production ofbu - tyric acid (Zigová &Šturdík 2000; Duncanetal. 2002; Zhangetal. 2009; Dwidaretal. 2012). Several spe Czech Journal of Food Sciences, 38, 2020 (3): 185–191 Original Paper https://doi.org/10.17221/ 95 / 2020 -CJFS - cies, including C.  butyricum , C.  tyrobutyricum and C.  thermobutyricum , produce butyrate as amajor Supported by theInter-Action Inter-Excellence program of Ministry of Education,Youth and Sport of theCzech Republic (MSMT), Project No.LTACH-17006 and specic university research MSMT, Proje

ct No. 21-SVV/2019. 186 product with relatively high levels of production and yield, and are therefore themost commonly studied species because of their high commercial potential for butyric acid production. In this study, we used thesolventogenic strain Clostridium beijerinckii NRRLB-598 as aproduction microorganism for butyric acid. C.beijerinckii belongs to thegroup of solventogenic clostridia that is charac - terized by its ability to produce solvents, i.e. acetone, butanol and ethanol, by ABE fermentation, which can be divided into two basic phases: acidogenic and sol - ventogenic. Acidogenesis, together with vegetative cell growth generates mainly acetic and butyric acid, together with hydrogen and CO 2 as themain prod - ucts. Solventogenesis begins with adecrease inpH and accumulation of acids in themedium and is usu - ally accompanied by theonset of sporulation. During solvent production, some of theacids formed, together with carbohydrates, are transformed into 1-butanol and acetone, while ethanol, hydrogen and CO 2 are formed from saccharides (Jones & Woods 1986; Dürre 2015; Lipovský et al. 2016; Patákováetal. 2019). emain goal of theresearch was to deter - mine thepH below which thesolventogenic switch and sporulation start would be blocked, resulting in theproduction of butyric acid as themain fermenta - tion product. MATERIALS AND METHODS Bacterial strains. C.beijerinckii NRRLB-598 [ob - tained as C.  pasteurianum NRRLB-598 from theARS/ NRRL collection but re-classied as C.  beijerinckii NRRLB-598 in 2017, see Sedláet al. (2017)] was maintained as aspore suspension. Fermentation medium. TYA (tryptone yeast extract acetate) nutrient medium was used for all experiments. is medium was selected because of its common use in fermentation by solventogenic clostridial cells. is medium consisted of: glucose (Penta, Czech Republic) 50gL –1 , yeast extract (Merck KGaA, Germany) 2gL –1 , tryptone (Merck KGaA, Germany) 6gL –1 , ammonium sulphate (Penta, Czech Republic) 3gL –1 , potassium di - hydrogen phosphate (Penta, Czech Republic) 0.5gL –1 , magnesium sulphate heptahydrate (Penta, Czech Re - public) 0.3gL –1 and ferrous sulphate heptahydrate (Penta, Czech Republic) 0.01gL –1 . epH of theme - dium was adjusted to thedesired value with 10% NaOH solution. emedium was then transferred to labora - tory bioreactors and sterilized with all components at21°C for 20minutes. Batch cultivation in bioreactor. Prior to inocula - tion, aspore suspension of C.beijerinckii NRRLB-598 was heat-shocked for 2min at80°C and cultured in TYA medium in theanaerobic chamber (Concept 400; Ruskinn Technology, UK) at37°C, for24h.Fer - mentations were performed at 37°C in 1L paral - lel Multiforce bioreactors (Infors HT, Switzerland) lled with 630mL TYA medium at200rpm agita - tion with pH online control. Prior to fermentation, N 2 bubbling for 30min was used for oxygen removal, thepH was adjusted to 6.0, 6.5, 7.0, 7.5or8.0with 10% NaOH and all bioreactors were inoculated with70mL of inoculum. einoculum was prepared by culturing thestrain in an anaerobic chamber (Concept 400; Ruskinn Technology, UK) for 18hours. Samples from bioreactor fermentation were taken every 3h for further analyses. Determination of metabolites, biomass andglu - cose. Glucose and metabolite (butyric acid, ace - tic acid, lactic acid, ethanol, acetone and butanol) concentrations were determined by HPLC (Agilent Series 1200 HPLC; Agilent, Spain) using refractive index detection (Agilent Series 1200 Refractive In -

dex Detector; Agilent, Spain) in samples of culture media. AnIEXH + polymer column (Watrex, Czech Republic) was used under thefollowing conditions: isocratic elution, mobile phase (5mMH 2 SO 4 ) with stable ow rate of 1mLmin 1 , column temperature 60°C, injection sample volume 20L. Results are presented as mean values from parallel fermentations with standard deviations. Flow-cytom etric (FC) analysis. Flow cytometry was used for rapid analysis of cell population viability and spore formation of the Clostridium strain. Apro - cedure described in detail by Koleketal. (2016) and Branskáetal. (2018) was chosen. emain principle of themethod is double staining of thecells with 6-car - boxy-uorescein diacetate (CFDA) and propidium iodide (PI). Further, ow cytometry analysis of thela - belled population is performed together with evalua - tion of standard FC parameters, i.e. side and forward scatters. While double staining is used for estimation of culture viability, spores, which are not stained, are recognised in thepopulation based on their size, shape and autouorescence. Microscopy. Phase contrast and uorescence micros - copy (OlympusBX51) were used in thestudy at ×400 and ×1000 magnications. Calculation of theparameters of butyric acid/ butanol formation. e  yield and rate of product formation (productivity) for therst 24  h of fermen - 187 tation in theform of butyric acid or butanol were calculated from theresults of HPLC analysis. Al - though thefermentations were run for 48h, theyield and productivity were calculated for therst 24h to compare thevalues at thetime when most cells in thepopulation remained active (see population vi - ability in Figure 1). eformulas for thecalculations are given below. 1. Product yield was calculated according to Equation1: where t 0 is thetime of bioreactor inoculation and t 24 is 24h after inoculation. S t0 and S t 24 are glucose concentrations at times t 0 and t 24 , respectively; P t 24 and P t 0 are product (butyric acid or butanol) concentrations at times t 24 and t 0 , respectively. 2. Productivity was calculated according to Equation2: where t 0 is time of bioreactor inoculation and t 24 is 24 h after inoculation; P t 24 and P t 0 are product (butyric acid or butanol) concentrations at times t 24 and t 0 , respectively. 240 Table 1. A  summary of theresults of batch cultivation at dierent pHs (mean value ± SD) pH Remaining glucose (g L –1 ) Total butyric acid (g L –1 ) Total acids (g L –1 ) Total solvents (g L –1 ) Productivity of butyric acid formation 24 h (g L –1 h –1 ) Productivity of butanol formation 24 h (g L –1 h –1 ) Yield of butyric acid 48 h (%) 6 12.03 ± 0.22 2.97 ± 0.01 8.43 ± 0.09 9.01 ± 0.15 0.23 ± 0.01 0.09 ± 0.01 8.26 ± 0.20 6.5 2.25 ± 0.12 9.69 ± 0.09 17.29 ± 0.18 7.21 ± 0.09 0.39 ± 0.01 0.05 ± 0.01 21.62 ± 0.20 7 5.05 ± 2.01 11.49 ± 0.39 20.60 ± 0.62 1.76 ± 0.22 0.40 ± 0.01 0.05 ± 0.02 25.73 ± 0.30 Figure 2. Concentration proles for theconsumption of glucose, production of butyric acid and yields of other cul - tivation products during batch fermentation in a bioreactor (A) concentration prole for pH 6; (B) concentration prole for pH 6.5; (C) concentration prole for pH 7; values are in mean ± standard deviation (SD) Figure 1. Proportions of PI and CFDA stained C.beijerinckii NRRLB-598 cells in thepopulation during

fermentation at constant pH7.0 PI – dead cells; CFDA – viable cells; PI + CFDA – doubly stained cells with an unclear status; values are in mean ± standard deviation (SD) A B C Butyric acid Butanol Lactic acid Glucose Butyric acid Butanol Lactic acid Glucose Butyric acid Butanol Lactic acid Glucose 15 21 24 48 Time (h) 120 100 80 60 40 20 0 Cell distribution (%) PI + CFDA CFDA PI CFDA/PI Time (h) 0 10 20 30 40 0 10 20 30 40 0 10 20 30 40 12 10 8 6 4 2 0 12 10 8 6 4 2 0 12 10 8 6 4 2 0 50 40 30 20 10 0 Glukose (g ) c metabolites (g L –1 ) c gluccose (g L –1 ) 50 40 30 20 10 0 c gluccose (g L –1 ) 50 40 30 20 10 0 c gluccose (g L –1 ) (%) Time (h) Time (h) c metabolites (g L –1 ) c metabolites (g L –1 ) 024100  188 RESULTS AND DISCUSSION Results. e  results are shown graphically in Fig - ure 2. evalues of theprocess parameters for all fermentations are summarized with themean stand - ard deviations in Table 1. eresults for pH7.5and 8.0are not shown because these pH values were strongly inhibitory for clostridial cells, with almost no cell growth. Individual experiments show that thelowest concentration of butyric acid was achieved at pH6. AtthispH, thehighest concentration ofsol - vents was also achieved and cell sporulation was seen, as shown in Figure 3A. At pH 6.5, acompara - ble peak concentration of butyric acid was reached like at pH7.0 (fermentation time 36h), but in thelate phase of fermentation, part of thebutyric acid was transformed into butanol (see Figure 2B) and spore formation was observed. AtpH 7, ahigh concentra - tion of butyric acid was achieved, while at thesame time there were minimal solvent production and no sporulation, asshown in Figure 3C. It can be seen from Figure 3 that spore formation occurred at pH6 and this phenomenon declined with increasing pH. At pH 7, spores were not formed. Asshown in Figure 3C, higher pH caused cellular stress, leading to lament formation. Further, ow cy - tometry with double uorescence staining was chosen for monitoring thecell viability atpH7.0, i.e. under conditions where cells did not sporulate (see Figure 4). Propidium iodide, which stains damaged cells, gen - erally serves as an indicator of membrane integrity. CFDA is anon-uorescent compound that is cleaved by active enzymes inside thecells into green uores - cent carboxy-uorescein (CF). AsCFis charged unlike CFDA, itis retained inthecells. Viable and dead cells were easily distinguishable as green (CFDA-stained) and red (PI-stained) cells, respectively. Orange cells, which are theresult of double staining (CFDA+PI), represent compromised cells but they were considered also viable in this study (see Figure 1). For detailed ex - planation of theFC analysis see Koleketal. (2016) and Branskáetal. (2018). Figure 3. Microphotographs showing thetypical morphology of cells after 24 h of culture for given pH values (A) cells after 24 h of fermentation at constant pH 6; (B) cells after 24 h of fermentation at constant pH 6.5; (C) cells after 24 h of fermentation at constant pH 7 Figure 4. Microphotographs showing themorphology of cells during fermentation at pH 7 (A) cells after 12 h of fermentation; (B) cells after 24 h of fermentation; (C) cells after 48 h o

f fermentation (A) (B) (C) (A) (B) (C) 189 e results from ow cytometry showed that at the15 th hour of fermentation, approximately 80% ofcells were viable, corresponding to agrowth curve in exponential phase (see Figure 5). After 24h of fer - mentation, viability dropped to approximately 20%, which again corresponds to thegrowth curve shown in Figure 5. Consumption of glucose also decreased, and theformation of butyric acid slowed down after 24 h of fermentation. Discussion. As reported in anumber of studies (Jones & Woods 1986; Hausetal. 2011; Li etal.2014; Wangetal. 2019), theinitial pH of thefermentation broth in solvent/butanol production is an important factor that signicantly aects thefermentation pro - cess, mainly thebutanol yield. All studies agree that aneutral pH leads to ahigher level of production of acids, while aweakly acidic pH promotes solvent for - mation. istrend was conrmed during our experi - ments. Usual nal butyric acid concentration achieved with thesame strain under thesame culture conditions (Lipovskýetal. 2016; Branskáetal. 2018; Patákováetal. 2019) is about 1.8gL –1 while theconcentration of 11.5gL – 1 was reached at pH regulated to7.0. Ifthesame strain, C.  beijerinckii NRRLB-598, was cultured under thesame conditions but thepH was not regulated (Lipo - vskýetal. 2016), butanol productivity of 0.15gL –1 h –1 and butanol concentration of 7.3gL –1 were reached. UnderpHregulation, see Table 1, maximum butanol productivity and concentration were obtained at pH6.0, i.e. 0.09gL –1 h –1 and 6.8gL –1 , respectively, while at constant pH7.0, maximum butanol productivity and concentration were 0.05gL –1 h –1 and 1.7gL –1 , respec - tively. For C.  acetobutylicum , Al-Shorganietal. (2018) reported themaximum productivity of butanol at un - controlled pH to be 0.19gL –1 h –1 compared to thepro - ductivity of0.06gL –1 h –1 at controlled pH6.0. e eect of pH on theproduction of organic ac - ids by solventogenic clostridia including C.  beijer - inckii was rarely tested, however an increased for - mation of lactic acid by C.  acetobutylicum under “alkaline” pH (value 7.0and higher) was reported byKatagirietal. (1960). is corresponds with our results when theunusually high concentration oflac - tic acid (upto4gL –1 ) was determined at pH7.0. AtpH7.5and 8.0, no growth of thestrain was de - tected, which might be explained by thenecessity to ensure alower redox potential or to add ahigher amount of inoculum because thesame phenomenon was described for C.  thermoaceticum and acetic acid formation at pH7.0 (Schwartz &Keller 1982). Koleketal. (2016) stated that thenumber of viable cells during typical ABE fermentation without pH regulation was about 20% after 24h of fermentation; similar results were conrmed byBranskaetal. (2018). Ataconstant pH of7, about 35% of viable cells were still present after 24h of fermentation. isresult sug - gests that by maintaining aconstant pH and prevent - ing cell sporulation, thepopulation viability can be increased and prolongation of thetime of metabolic activity of cells was found. AtpH7, 11.5gL –1 of butyric acid was produced at an initial glucose concentration of 50gL –1 and ato - tal of 1.

8gL –1 of solvents. isbutyric acid concen - tration (11.5gL –1 ) was more than ve times higher than thebutyric acid concentration obtained in stand - ard fermentation of solventogenic clostridia, which Figure 5. etime course of cell population growth during fermentation while maintaining a constant pH 7.0 (mean ± SD) Time (h) 0 5 10 15 20 25 30 35 40 45 9 8 7 6 5 4 3 2 1 0 OD 600 nm OD – optical density 190 isaround 2gL –1 (Jones &Woods, 1986; Dwidaretal. 2012; Patákováetal. 2019). Heetal. (2005) reported that in batch culture fer - mentation of Clostridium butyricum ZJUCB at dier - ent pHs and under dierent conditions, they achieved maximum butyric acid production of 12.25gL –1 . Joetal. (2009) reached thenal butyric acid con - centration of 13.76gL –1 by batch fermentation with C.  tyrobutyricum strain JM1. Zigetal. (1999) in batch fermentation with C.butyricum S21 achieved thepro - duction of 7.3gL –1 butyric acid with total productivity of 0.24gL –1 h –1 and total yield of24%. We obtained abutyric acid level of 11.5gL –1 with pro - ductivity of 0.40gL –1 h –1 and total yield of25.7%. ese data suggest that our method of using thesolvent strain C.beijerinckii NRRL  B-598 may be very promising, and our results are comparable with C.butyricum and C.ty - robutyricum strains routinely used for this purpose. CONCLUSION is study was focused on identifying asuitable pH at which butyric acid should be produced us - ing thesolventogenic species Clostridium beijer - inckii NRRLB-598, which is commonly used for ABE fermentation; apH of 7 proved to be thebest for acidogenic fermentation. At this pH, production of11.5gL –1 butyric acid as themain fermentation product was achieved, with almost zero lactic acid and minimal solvent production. Moreover, at this pH, cell sporulation did not occur, enabling abetter yield ofbutyric acid. REFERENCES Al-ShorganiN.K.N., KalilM.S., YusoW.M.W., HamidA.A. (2018): Impact of pH and butyric acid on butanol produc - tion during batch fermentation using anew local isolate of Clostridium acetobutylicum YM1. Saudi Journal of Biological Sciences, 25: 339–348. ArmstrongD.W., YamazakiH. (1986): Natural flavours production: Abiotechnological approach. Trends in Bio - technology, 4: 264–268. BedfordA., GongJ. (2018): Implications of butyrate and its derivatives for gut health and animal production. Animal Nutrition, 4: 151–159. BranskáB., PecháováZ., KolekJ., VasylkivskáM., PatákováP. (2018): Flow cytometry analysis of Clostridium beijerinckii NRRL B-598 populations exhibiting dierent phenotypes induced by changes in cultivation conditions. Biotechnol - ogy for Biofuels, 11: 99. CasconeR. (2008): Areplacement for bioethanol? Chemical Engineering Progress, 104: 4–9. DuncanS.H., BarcenillaA., StewartC.S., PrydeS.E., FlintH.J. (2002): Acetate utilization and butyryl coenzyme A (CoA): Acetate-CoA transferase in butyrate-producing bacteria from thehuman large intestine. Applied and Environmen - tal Microbiology, 68: 5186–5190. DürreP. (2015): Clostridium . In: GoldmanE., GreenL.H. (eds): Practical Handbook of Microbiology (3 rd Ed.). CRC Press, Boca Raton: 855–876. DwidarM., ParkJ.Y., MitchellR.J., SangB.I. (2012): efuture of butyric acid in industry. eScientic

World Journal, 2012: 1–10. HausS., JabbariS., MillatT., JanssenH., FischerR.J., BahlH., KingJ.R., WolkenhauerO. (2011): Asystems biology ap - proach to investigate theeffect of pH-induced gene regula - tion on solvent production by Clostridium acetobutylicum in continuous culture. BMC Systems Biology, 5: 10. HeG., KongQ., ChenQ., RuanH. (2005): Batch and fed-batch production of butyric acid by Clostridium butyricum ZJUCB. Journal of Zhejiang University Science B, 6: 1076–1080. JoJ.H., LeeD.S., KimJ., ParkJ.M. (2009): Eect of initial glucose concentrations on carbon and energy balances in hydrogen-producing Clostridium tyrobutyricum JM1. Journal of Microbiology and Biotechnology, 19: 291–298. JonesD.T., WoodsD.R. (1986): Acetone-butanol fermentation revisited. Microbiological reviews, 50: 484–524. KatagiriH., ImaiK., SugimoriT. (1960): On themetabolism of organic acids by Clostridium acetobutylicum . Bulletin of theAgricultural Chemical Society of Japan, 24: 163–181. KolekJ., BranskáB., DrahokoupilM., PatákováP., MelzochK. (2016): Evaluation of viability, metabolic activity and spore quantity in clostridial cultures during ABE fermentation. FEMS Microbiology Letters, 363: 1076–1080. LiT., YanY., HeJ. (2014): Reducing cofactors contribute to theincrease of butanol production by awild-type Clostridium sp. strain BOH3. Bioresource Technology, 155: 220–228. LipovskýJ., PatákováP., PaulováL., PokornýT., RychteraM., MelzochK. (2016): Butanol production by Clostridium pas - teurianum NRRL B-598 in continuous culture compared to batch and fed-batch systems. Fuel Processing Technology, 144: 139–144. PatákováP., BranskáB., SedláK., VasylkivskáM., JurekováK., KolekJ., KoscováP., ProvazníkI. (2019): Acidogenesis, solventogenesis, metabolic stress response and life cycle changes in Clostridium beijerinckii NRRL B-598 at thetran - scriptomic level. Scientic Reports, 9: 1371 . Rodriguez-NogalesJ.M., RouraE., ContrerasE. (2005): Biosynthesis of ethyl butyrate using immobilized lipase: Astatistical approach. Process Biochemistry, 40: 63–68. 191 SchwartzR.D., KellerF.A. (1982): Acetic acid production by Clostridium thermoaceticum in pH-controlled batch fermentations at acidic pH. Applied and Environmental Microbiology, 43: 1385–1392. SedláK., KolekJ., ProvazníkI., PatákováP. (2017): Reclassi - cation of non-type strain Clostridium pasteurianum NRRL B-598 as Clostridium beijerinckii NRRL B-598. Journal of Biotechnology, 244: 1–3. ShuC., CaiJ., HuangL., ZhuX., XuZ. (2011): Biocatalytic production of ethyl butyrate from butyric acid with im - mobilized Candida rugosa lipase on cotton cloth. Journal of Molecular Catalysis B: Enzymatic, 72: 139–144. WangJ., YangH., Qi.G., LiuX., GaoX., ShenY. (2019): Eect of lignocellulose-derived weak acids on butanol production by Clostridium acetobutylicum under dierent pH adjust - ment conditions. RSC Advances, 9: 1967–1975. ZaskiA., BanaszkiewiczA., WalkowiakJ. (2013): Butyric acid in irritable bowel syndrome. Gastroenterology Review, 6: 350–353. ZhangC., YangH., YangF., MaY. (2009): Current progress on butyric acid production by fermentation. Current Mi - crobiology, 59: 656–663. ZigováJ., ŠturdíkE. (2000): Advances in biotechnological production of butyric acid. Journal of Industrial Microbiol - ogy & Biotechnology, 24: 153–160. Received: April 16, 2019 Accepted: June 10, 2020 Original Paper Czech Journal of Food Sciences, 38, 2020 (3): 185–191 https://doi.org/10.17221/ 95 / 2020 -