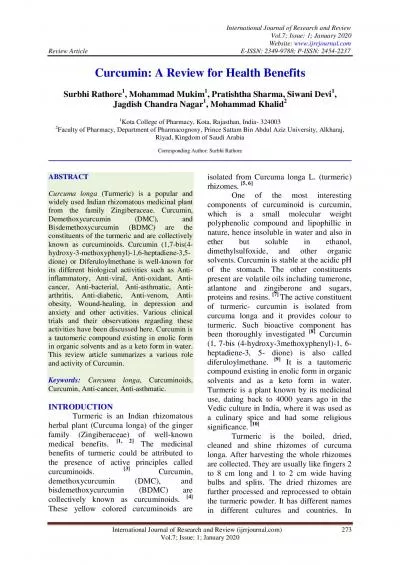
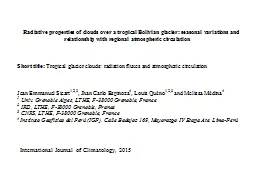
Rabatel et al 2013 Exemple le Glacier Zongo Bolivie 16S zone tropicale externe Monitoring network on Zongo glacier 16S Bolivia GLACIOCLIM Ablation stakes Snow pits ID: 560449
Download Presentation The PPT/PDF document "International Journal of Climatology, 20..." is the property of its rightful owner. Permission is granted to download and print the materials on this web site for personal, non-commercial use only, and to display it on your personal computer provided you do not modify the materials and that you retain all copyright notices contained in the materials. By downloading content from our website, you accept the terms of this agreement.
Slide1
International Journal of Climatology, 2015Slide2
Rabatel
et al
. (
2013)Slide3
Exemple
: le Glacier Zongo (
Bolivie
, 16°S), zone
tropicale
externe
Monitoring network on Zongo glacier, 16°S (Bolivia)
GLACIOCLIM
Ablation stakes
Snow pits
Proglacial
discharge
Rain gauges
Automatic
Weather
StationSlide4
Veblen et al. (2007)
Wet summer season
Dry winter seasonSlide5
Tropical glaciers: mass balance largely depends on
cloud and
precipitation properties
Transition season SON
Runoff peak
Clear-sky, summer solstice
Low glacier albedo
W
et season DJF
Clouds, Snowfalls
High glacier albedo
sum of precipitation
5 stations on the Altiplano, daily averages over 1991-2008
Ramallo
(2014)
Objectives: to
relate locally observed
radiative properties
of clouds to the synoptic atmospheric circulation.Dry season JJA
Little melt energy, Longwave radiation surface deficitSlide6
C
loud
transmissivity for shortwave radiation (
T
n ≤
1):
S
=
T
n Sclear = Tn Tclear S
extraSclear is the shortwave clear-sky irradiance (W m−2)Sextra is the theoretical shortwave irradiance at the top of the atmosphere (W m−2)Tclear is the bulk clear-sky transmissivity (0.87)Daily values from 2005 to 2013Slide7
The
sky longwave irradiance (
L
):L
= clear
F σ T
4
(2)
εclear is the apparent clear sky emissivity = 5.67 10−8 W m−2
K−4 is the Stefan-Boltzman constantF 1 is the cloud emission factor describing the increase in sky emissivity due to cloud emission. εclear = C (e / T)1/m (3)e is the vapor pressure (
hPa) and T is the temperature (K) of the air near the ground.
Daily values from 2005 to 2013Slide8
The cloud cover index CI =
F
–
T
n will be large for warm low clouds with high longwave emissivity and/or for thick clouds, which strongly attenuate shortwave radiation.
The
cloud radiative forcing (
CF
)
is
the difference between all sky and clear sky down-welling fluxes:CF = CFSW + CFLW = S -
Sclear + L - Lclear = Sclear (Tn-1) + Lclear (F-1) (4)where (Tn-1) is negative whereas (F-1) is positive
.Daily values from 2005 to 2013
Analysis of regional atmospheric circulation
Daily 850, 500, and 200 hPa wind and geopotential height anomalies from ERA-interim
reanalysis
at 0.75× 0.75° horizontal resolution
Daily OLR data from NCAR/NOAA
at 2.5×2.5° horizontal: proxy for deep convection.Composite analysis of atmospheric circulation was conducted considering the beginning of intense cloudy-sky events, defined as the first day (D0) when the cloud cover index CI over Zongo was higher than the 90th percentile of all the years during the period 2005–2013.Slide9
850 hPa meridional wind anomalies in
the
15–25°S
and
65–57°W region.
Days characterized by
low-level incursions of southern winds
to the
east of the Andes were identified by positive
anomalies of
meridional wind in this regionConceptual model of a cold air incursion over South
America, generally applicable for wintertime and summertime episodes. Dark (light) thick arrows represent low-level wind advecting cold (warm) air. Thin contours represent surface isobars. Cold front atsurface is shown conventionally.Garreaud et al. (2000)Slide10
Cloud long-wave emission:
F= L
/ σ T4Slide11
Cloud long-wave emission
:
F= L
/ σ T4
Cloud radiative forcing:
CF
=
S
- Sclear + L - Lclear
= Sclear (Tn-1) + Lclear (F-1)where (Tn-1) is negative whereas (F-1) is positive.Cloud reduction in solar radiation:Tn = S / T
clear SextraSlide12
Cloud long-wave
emission:
F
= L
/ σ
T
4
Cloud
reduction in solar
radiation:Tn = S
/ Tclear SextraSlide13
Cloud radiative forcing:
CF
=
S
- Sclear + L
- Lclear
=
S
clear
(Tn-1) + Lclear (F-1)where (Tn-1) is negative whereas (F-1) is positive.
Reduction in solar radiation by clouds exceeds their increase in longwave radiation largely because at low latitudes, solar irradiance is high all year long.Reduction of the down-welling fluxes due to clouds is maximal in the wet season due to high extraterrestrial solar irradiance and low shortwave transmissivity, and despite high longwave emissivity of convective clouds.Slide14
CI = F –
T
n
largeDays with ‘thick’ cloud covers were identified by using the 90
th percentile of CI
over the eight years of study.
Dry season
Transition
Wet seasonSlide15
Low Level Circulation (850
hPa
), June to August JJA
Cloud cover on Zongo glacier related
to low-level incursions of southern windSlide16
Cut off low events in
June
2011 producing
thick cloud
covers over the region of Zongo glacier (500
hPa)Slide17
Composites anomalies of wind (vectors, m s-1) and geopotential height (contours at 40 m intervals, positive [negative] anomalies are in red [blue]) at 200
hPa
from D–3 to D+3 from
September to November (SON)
in the period 2005-2012 when large cloud covers (CI > 0.75) over Zongo glacier were not related to low-level incursions of southern wind. Only wind anomalies higher than 0.5 standard deviation are plotted.
High level Circulation (200
hPa
), September
to
November SON, cloud cover on Zongo glacier NOT
related to low-level incursions of southern windSlide18
Low Level Circulation (850 hPa
), December to February DJF, cloud cover over Zongo Glacier NOT
related to low-level incursions of southern windSlide19
Some conclusions on regional atmospheric circulation…In JJA and SON, clouds mostly occurred during southern wind incursions
at low levels
(80–87% of cases),
characterizing the
beginning of a cold surge episode, which generally lasts 2–3 days in the Oriental Altiplano.
Other episodes of
cloud cover
in the dry season (JJA) were linked
to low-pressure
conditions at 200
hPa on the Chilean coast (including cut-off low episodes), whereas in SON, they were linked to early summer conditions characterized by an active Bolivian High and easterly winds at 200 hPa
over the Cordillera Real.During the wet season, thick cloud covers were still often associated with southern wind incursions (46% of cases), other cloud events being associated with the South American Monsoon, intensification of the Bolivian High, and enhancement of the easterly winds at 200 hPa over the Altiplano.Slide20
Some perspectives…To quantify the effects of clouds on the glacier melt rate, cloud forcing on the surface radiation balance
, including down- and up-welling fluxes, need to be investigated in relation with
glacier
albedo.
Cloud properties need to be related to the intensity, frequency, and phase of precipitation
to investigate the effects of the timing and duration of the wet season on tropical glaciers, and of the occurrence of cold surges, which generally cause large snowfalls that drastically reduce glacier melt.
Similar work has been undertaken in
Ecuador
(climate more complicated
…)
THANK YOU!