/
Modification of GFS Land Surface Model Parameters to Mitigate the Near-Surface Cold and Modification of GFS Land Surface Model Parameters to Mitigate the Near-Surface Cold and

Modification of GFS Land Surface Model Parameters to Mitigate the Near-Surface Cold and - PowerPoint Presentation

trish-goza
trish-goza . @trish-goza
Follow
369 views
Uploaded On 2018-10-01

Modification of GFS Land Surface Model Parameters to Mitigate the Near-Surface Cold and - PPT Presentation

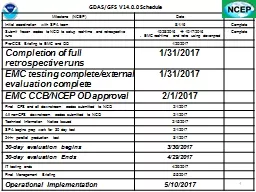
Analysis of Parallel Test Results 1 04 September 2012 Fanglin Yang Shrinivas Moorthi Helin Wei Glenn White Geoff Manikin Mike Ek John Derber and Bill Lapenta ID: 683798

bias gfs 2012 conus gfs bias conus 2012 hpa june cycles hemisphere pressure august temperature 00z lsm 24h northern

Share:

Link:

Embed:

Download Presentation from below link

Download Presentation The PPT/PDF document "Modification of GFS Land Surface Model P..." is the property of its rightful owner. Permission is granted to download and print the materials on this web site for personal, non-commercial use only, and to display it on your personal computer provided you do not modify the materials and that you retain all copyright notices contained in the materials. By downloading content from our website, you accept the terms of this agreement.


Presentation Transcript

Slide1

Modification of GFS Land Surface Model Parameters to Mitigate the Near-Surface Cold and Wet Bias in the Midwest CONUS: Analysis of Parallel Test Results

1

04 September 2012

Fanglin

Yang,

Shrinivas

Moorthi

,

Helin

Wei, Glenn White, Geoff Manikin,, Mike

Ek

, John

Derber

and Bill

Lapenta

NOAA/NWS/NCEP Environmental Modeling CenterSlide2

Problem: Customers Noted the GFS PBL was too Cold and Wet

The

GFS 2m temperature and dew point forecasts valid in the late afternoon were too low and high,

respectively

Lincoln, Illinois (ILX)

Observed: Solid; GFS 24h

Fcst

: Dashed

Observed and simulated soundings valid 00 UTC 23 July 2012

Omaha, Nebraska (OAX)

∆T

d=+9°C

∆T=-7°C

∆Td=+10°C

∆T=-8°C

2Slide3

OBS

GFS 24h

Fcst

2 Meter Temperature

2 Meter Dew Point

OBS

GFS 24h

Fcst

Spatial Distribution of Biases in 2-Meter

Temperature and Dew Point

3

GFS approximately 10-15 °F too cool in the late afternoon for the mid-west

GFS

dewpoint

approximately 15-20 °F too high in the late afternoon for the mid-westSlide4

Sequence of Events, Actions and Results24 May: EMC Model Evaluation Group (MEG) identified potential cold/wet bias in GFS over the Central US

14 June:

MDL and EMC received complaints from field that the GFS 2m temperature and dew point forecasts valid in the late afternoon were too low and high, respectively

19 June:

EMC verified field observations and disassociated problem from the hybrid GDAS upgrade implemented 22 May

21 June:

EMC isolated the problem to land surface model:

Look up table for vegetation canopy resistance and root zone depth used in GFS was the culprit

Implemented erroneously in the May 2011 upgrade

Change allowed too much evaporation through vegetation types in central CONUS

24 June:

EMC conducted limited tests using original LSM look up table and found positive impact in poor performing areas29 June:

EMC notified users of suspect cause and plans to correct through MDL

June-August: EMC Conducted a retrospective parallels:

June-August 2012 (CONUS warm season)Jan-Feb 2012 (CONUS cold season)

CCS Availability limited due to SREF testing and service interruptions in AugustChange of LSM table has expected impacts on improving warm season PBL structure and precipitation

No impact on CONUS PBL structure and precipitation during cold season

August 25:

NCEP Director approves fix to be implemented 5 Sept.

4Slide5

RSMTBL =(/300.0, 175.0, 175.0, 300.0, 300.0, 70.0, & 45.0, 225.0, 225.0, 225.0, 400.0, 45.0, & 150.0, 0.0, 0.0, 0.0, 0.0, 0.0, & 0.0, 0.0, 0.0, 0.0, 0.0, 0.0, & 0.0, 0.0, 0.0, 0.0, 0.0, 0.0/)

NROOT_DATA =(/4,4,4,4,4,4,3,3,3,2,3,3,2,0,0, & 0,0,0,0,0,0,0,0,0,0,0,0,0,0,0/)

RSMTBL =(/300.0, 175.0, 175.0, 300.0, 70.0, 70.0,

&

20.0, 70.0, 70.0, 70.0, 70.0, 20.0,

& 70.0

,

0.0, 0.0, 0.0, 0.0, 0.0, & 0.0, 0.0, 0.0, 0.0, 0.0, 0.0, & 0.0, 0.0, 0.0, 0.0, 0.0, 0.0/) NROOT_DATA =(/4,4,4,4,4,4,

4,4,4,4,4,4,4,0,0, & 0,0,0,0,0,0,0,0,0,0,0,0,0,0,0/)Operational GFS

Prior to May 2011 implementation

Minimum Canopy Resistance (RSMIN) and Root Depth Number (NROOT) were changed in May-2011 Implementation leading to increased evapotranspiration over some regions depending on vegetation type

Land Surface Model Look-up Table

Parameter differences in table highlighted in RED

Lower canopy resistance (i.e. lower values in table) and deeper root zone depth (i.e., larger values in table) will allow more evapotranspiration to occur for those vegetation typesModified table is used in CFS

5Slide6

Mixed forest: Reduced from 300 to 70 units

Bare soil: Reduced from 400 to 70 units

Cropland: Resistance Reduced from 45 to 20 units

Changes in Canopy Resistance

Canopy Resistance (Operational – Corrected)

6Slide7

Changes in Root Zone Depth Root Zone Depth Layer (Operational – Corrected)

Positive values indicate shallower rooting depth

7Slide8

Use the LSM table employed in the operational GFS before May 2011 implementation

Warm season experiment prt2mexp:Started from the operational GFS 20120531 18Z initial conditions

Results presented for the period of Jun 14 – Aug 22, 2012

Cool season experiment prt2mwin:

Started from the prd12q3s hybrid-

enkf

parallel 20120101 06Z initial conditions

Results presented for the period of Jan 15 – March 01, 2012

Numerical Experiments

8Slide9

Warm Season Experiment (prt2mexp)Reduced late-afternoon surface cold bias and moisture bias over the Northern and Southern Great Plains found in the operational GFSSignificantly improved CONUS precipitation skill scores especially for light amountsNo significant

change to:Hurricane track and intensity

Standard forecast

skill scores such as 500-hPa height AC and tropical wind RMSE

Slightly worsened the mid-day warm bias over the SE US

Cool Season Experiment (prt2mexp)

No significant change in:

CONUS meteorological fields

Standard global forecast skill metrics

Summary of Results

9

Detailed verification at Fanglin’s websiteshttp://www.emc.ncep.noaa.gov/gmb/wx24fy/para/t2mbias/exp2012/

http://www.emc.ncep.noaa.gov/gmb/wx24fy/para/t2mbias/exp2012w/Slide10

10Time Averaged 2 Meter Temperature (°C)14 June to 22 August 2012 (00Z Cycles Only)CONUS Northern and Southern Great Plains regions

CONUS East

CONUS West

Southern Great Plains

Northern Great Plains

10Slide11

Example of Correction Obtained in GFS Parallel

21h GFS 2-m Temperature Forecasts (°F) Valid 21UTC 22 July 2012

Operational GFS

LSM GFS Parallel

Difference

Ops – Para

Corrected LSM in GFS found to mitigate 4 to 16 °F cold bias in operations and compares favorably with observations

11

GFS approximately 10-15 °F too cool in the late afternoon for the mid-west (see slide #3 for OBS)

Correction to LSM alleviates cold bias (see slide #3 for OBS)Slide12

Example of Correction Obtained in GFS Parallel

24h GFS 2-m

Dewpoint

(°F)

Forecasts Valid 00 UTC 23 July 2012

Operational GFS

LSM GFS Parallel

Difference

Ops – Para

Corrected LSM in the GFS found to reduce

dewpoint

by 8 to 16 °F and compares more favorably with observations

12

GFS dewpoint approximately 15 °F too high in the late afternoon for the mid-west (see slide #3 for OBS)

Correction to LSM alleviates moist bias (see slide #3 for OBS)Slide13

13

Time Averaged 2 Meter Temperature (°C)

14 June to 22 August 2012 (00Z Cycles Only)

CONUS East and West regions

CONUS East

CONUS West

13Slide14

14Day 1: 24h Period ending at 36h forecast

Quantitative Precipitation Forecasts (CONUS)14 June to 22 August 2012 (00Z Cycles Only)

14Slide15

15Day-2: 24h Period ending at 60h forecast

Quantitative Precipitation Forecasts (CONUS)14 June to 22 August 2012 (00Z Cycles Only)

15Slide16

16Day-3: 24h Period ending at 84h forecast

Quantitative Precipitation Forecasts (CONUS)14 June to 22 August 2012 (00Z Cycles Only)

16Slide17

17

500 hPa Anomaly Correlation

Northern Hemisphere

Southern Hemisphere

14 June to 22 August 2012 (00Z Cycles Only

)

Operational

LSM Para

17Slide18

Northern

Hemisphere Temperature (°C)

24h

Fcst

= Black

48h

Fcst

=

Red

Pressure (

hPa

)

Pressure (

hPa

)

Bias

RMSE

Bias

RMSE

Operational GFS= Solid

LSM Parallel = Dotted

Pressure (

hPa

)

Bias

RMSE

Bias

RMSE

Pressure (

hPa

)

North America Temperature (°C) Northern Hemisphere Mixing Ratio (g/kg)

North America

Mixing Ratio(g/kg)

Large ScaleTemperature and Moisture Verification14 June to 22 August 2012 (00Z Cycles Only)24 and 48h Forecasts for the Northern Hemisphere and North America18Slide19

Large

ScaleTemperature

and Moisture Verification

14 June to 22 August 2012 (00Z Cycles Only)

24 and 48h Forecasts for the Southern Hemisphere and Tropics

Southern Hemisphere Temperature (°C)

24h

Fcst

= Black

48h

Fcst

=

Red

Pressure (

hPa

)

Pressure (

hPa

)

Bias

RMSE

Bias

RMSE

Operational GFS= Solid

LSM Parallel = Dotted

Pressure (

hPa

)

Bias

RMSE

Bias

RMSEPressure (hPa)TropicsTemperature (°C)

Southern Hemisphere Mixing Ratio (g/kg)

Tropics Mixing

Ratio(g/kg)

19Slide20

Atlantic Hurricane Track Errors01 June to 23 August 2012All 4 GFS cycles

20Slide21

Atlantic Hurricane Intensity Errors01 June to 23 August 2012All 4 GFS cycles

21Slide22

East-Pacific Hurricane Track Errors01 June to 19 August 2012All 4 GFS cycles

22Slide23

East-Pacific Hurricane Intensity Errors01 June to 23 August 2012All 4 GFS cycles

23Slide24

24

CONUS West

CONUS East

Time Averaged 2 Meter Temperature (°C)

15 January to 01 March 2012 (00Z Cycles Only)

CONUS West and East regions

24Slide25

25Quantitative Precipitation Forecasts (CONUS)

15 January to 01 March 2012 (00Z Cycles Only)

Day 1: 24h Period ending at 36h forecast

25Slide26

26Quantitative Precipitation Forecasts (CONUS)

Day 3: 24h Period ending at 84h forecast15 January to 01 March 2012 (00Z Cycles Only)

26Slide27

27

Northern Hemisphere

Southern Hemisphere

500 hPa Anomaly Correlation

15 January to 01 March

2012 (00Z Cycles Only

)

27Slide28

Northern

Hemisphere Temperature (°C)

24h

Fcst

= Black

48h

Fcst

=

Red

Pressure (

hPa

)

Pressure (

hPa

)

Bias

RMSE

Bias

RMSE

Hybrid Parallel= Solid

LSM Parallel = Dotted

North

America

Temperature

(°C)

Large

ScaleTemperature

and Moisture Verification

15 January to 01 March 2012 (00Z Cycles Only)

24 and 48h Forecasts for the Northern Hemisphere and North America

28

Northern Hemisphere Mixing Ratio (g/kg)Pressure (

hPa)

Pressure (hPa)

Northern

America Mixing Ratio (g/kg)BiasRMSERMSEBiasSlide29

Large

ScaleTemperature

and Moisture Verification

15 January

to

01 March

2012 (00Z Cycles Only)

24 and 48h Forecasts for the Southern Hemisphere and Tropics

Southern Hemisphere Temperature (°C)

24h

Fcst

= Black

48h

Fcst

=

Red

Pressure (

hPa

)

Pressure (

hPa

)

Bias

RMSE

Bias

RMSE

Hybrid Parallel= Solid

LSM Parallel = Dotted

TropicsTemperature

(°C)

29Southern Hemisphere Mixing Ratio (g/kg)Pressure (hPa)

Pressure (

hPa

)

Tropics Mixing Ratio (g/kg)BiasBiasRMSERMSESlide30

Warm Season Experiment (prt2mexp)Reduced late-afternoon surface cold bias and moisture bias over the Northern and Southern Great Plains found in the operational GFSSignificantly improved CONUS precipitation skill scores especially for light amountsNo significant

change to:Hurricane track and intensity

Standard forecast

skill scores such as 500-hPa height AC and tropical wind RMSE

Slightly worsened the mid-day warm bias over the SE US

Cool Season Experiment (prt2mexp)

No significant change in:

CONUS meteorological fields

Standard global forecast skill metrics

Summary of Results

30

Detailed verification at Fanglin’s websiteshttp://www.emc.ncep.noaa.gov/gmb/wx24fy/para/t2mbias/exp2012/

http://www.emc.ncep.noaa.gov/gmb/wx24fy/para/t2mbias/exp2012w/