/
RECENT SEISMIC MONITORING RESULTS FROM THE CENTRAL RECENT SEISMIC MONITORING RESULTS FROM THE CENTRAL

RECENT SEISMIC MONITORING RESULTS FROM THE CENTRAL - PowerPoint Presentation

trish-goza
trish-goza . @trish-goza
Follow
385 views
Uploaded On 2018-11-02

RECENT SEISMIC MONITORING RESULTS FROM THE CENTRAL - PPT Presentation

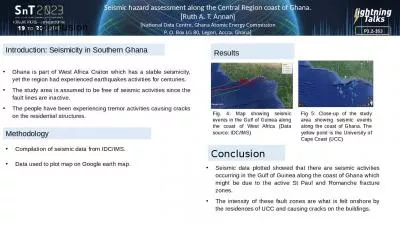
VIRGINIA SEISMIC ZONE IMPLICATIONS FOR FAULT RUPTURE AREA MOMENT RELATIONS Martin Chapman Jacob Beale Department of Geosciences Virginia Tech Blacksburg Virginia email mccvtedu GSA Southeastern Section Meeting ID: 710647

2011 aftershock earthquake virginia aftershock 2011 virginia earthquake 2017 mineral seismic early stress mainshock stations rupture earthquakes aftershocks epicenters

Share:

Link:

Embed:

Download Presentation from below link

Download Presentation The PPT/PDF document "RECENT SEISMIC MONITORING RESULTS FROM T..." is the property of its rightful owner. Permission is granted to download and print the materials on this web site for personal, non-commercial use only, and to display it on your personal computer provided you do not modify the materials and that you retain all copyright notices contained in the materials. By downloading content from our website, you accept the terms of this agreement.


Presentation Transcript

Slide1

RECENT SEISMIC MONITORING RESULTS FROM THE CENTRAL

VIRGINIA SEISMIC ZONE: IMPLICATIONS FOR FAULT RUPTURE

AREA - MOMENT RELATIONS

Martin Chapman, Jacob Beale

Department of Geosciences

Virginia Tech

Blacksburg, Virginia

email: mcc@vt.edu

GSA Southeastern Section Meeting

Knoxville, TN

April 13, 2018Slide2

Circles show earthquake epicenters instrumentally located by the Virginia Tech

Seismological Observatory in central Virginia, 1977 - Aug. 23, 2011. Numbers are earthquake

magnitude. Colored regions indicate major geologic units.Slide3

Historical

(pre-instrumental)

epicenters

Instrumentally located

epicenters

The great majority of

shocks in the Central

Virginia Seismic Zone have

been south of 38°N.

Red circles show epicenters of shocks

located by a 3-month Virginia Tech -

USGS deployment of

temporary seismic stations in early 2014.

Blue triangles show station locationsSlide4

northeastern cluster

main cluster

Although the Mineral 2011 mainshock was poorly recorded, the early aftershock

sequence was the best recorded in eastern U.S. history.

From:

Wu,

Qimin

, M.C. Chapman and J.N. Beale, 2015, The Aftershock Sequence of the 2011 Mineral, Virginia, Earthquake: Temporal and Spatial Distribution, Focal Mechanisms, Regional Stress and the Role of Coulomb Stress Transfer, Bulletin of the Seismological Society of America, v. 105, no. 5, p. 2521-2537,

doi. 10.1785/0120150032. Slide5

Temporary seismic

stations operating

from August 23, 2011

until early January, 2012.

Contributors: Virginia Tech, University of Memphis, Lehigh University, IRIS, USGS.

From:

Wu, Qimin, M.C. Chapman and J.N. Beale, 2015, The Aftershock Sequence of the 2011 Mineral, Virginia, Earthquake: Temporal and Spatial Distribution, Focal Mechanisms, Regional Stress and the Role of Coulomb Stress Transfer, Bulletin of the Seismological Society of America, v. 105, no. 5, p. 2521-2537,

doi. 10.1785/0120150032. Slide6

Double-Difference Aftershock Relocation (1,712 events)

Wu et al. (2015)

A

A’

B

B’

Black stars: 3

subevents

of the mainshock (Chapman, 2013

)

6

From:

Wu,

Qimin

, M.C. Chapman and J.N. Beale, 2015, The Aftershock Sequence of the 2011 Mineral, Virginia,

Earthquake: Temporal and Spatial Distribution, Focal Mechanisms, Regional Stress and the Role of Coulomb Stress Transfer, Bulletin of the Seismological Society of America, v. 105, no. 5, p. 2521-2537,

doi

. 10.1785/0120150032

. Slide7

Currently, there are 24 broadband and short-periods seismic stations operating in central

Virginia, with support from the USGS National Earthquake Hazards Program. The stations were

installed in early 2017 and are planned to operate until early 2019 (2 years).

Recently (2017) Deployed Temporary Seismic Stations in Central VirginiaSlide8

Lousia

County Area

Buckingham County Area

Two areas of Interest

Red symbols show temporary station locationsSlide9

Objectives

1) In Louisa County, monitor the on-going aftershock sequence of the August 23, 2011

Mw 5.7 (

m

blg 6.3) Mineral earthquake.Questions to be addressed: What is the current rate of aftershocks (7+ years post mainshock)?

Is it consistent with Omori's Law and the early aftershock rate of 2011? How does the spatial distribution of current aftershocks compare with that of 2011? Does the rupture zone still appear as a gap in the

aftershock pattern? What are the focal mechanisms of the current aftershocks? How do they compare with those of 2011?2) In the Buckingham County area, we want to get accurate locations and focal

mechanisms for the first time. Is it possible that the seismicity is aftershock activity from a large pre-historic shock?Slide10

The epicenters of earthquakes occurring from March 31 - Sept. 18, 2017

are shown as yellow circles, with sizes scaled to magnitude. Temporary seismic

stations are shown as red triangles. The blue triangle is ANSS N4 station R58B.

Recent Mineral earthquake aftershocks and seismic stations currently deployed in the

Louisa County, VA area.

2011 epicenter

2017 aftershock

focal mechanismSlide11
Slide12

Red triangles show temporary seismic stations. Yellow circles show epicenters for the

March 31 -Sept 18, 2017 period. Small black circles show epicenters of immediate aftershocks that

occurred during the period August 25, 2011 - January 1, 2012.

Louisa County AreaSlide13

Red: Mineral aftershock hypocenters from 2011.

Green: aftershock hypocenters March 31- September 18, 2017.

mainshock sub-events

N

Northwest

SoutheastSlide14

Red: Mineral aftershock hypocenters from 2011.

Green: aftershock hypocenters March 31- September 18, 2017.

mainshock sub-events

Mw 5.7, stress

drop 70

MPa

,

circular rupture

diameter 2.7 km

(Brune model)Slide15

Early Aftershock statistics (August 25, 2011 - January 1, 2012)

Fit to Omori

Law

The fit to Omori's Law using the 2011 aftershock data predicts that we should be

seeing approximately 0.19 earthquakes per day with magnitudes greater than -0.4,

6 years later (i.e. August 23, 2017). Slide16

The fit to Omori's Law using the 2011 aftershock data predicts that we should

be seeing approximately 0.19 earthquakes per day with

Md

* greater than -0.4,

6 years later (i.e, August 23, 2017).

We recorded 153 earthquakes with Md* > -0.4 near the mainshock epicenter in the period from March 13, 2017 through January 24, 2018. This corresponds to a rate of 0.48

earthquakes per day, or two and one-half times the rate predicted by Omori's Law based on the early (2011) aftershock data.Clearly, the aftershock sequence is still active, and is more intense than would bepredicted by Omori's Law and the early (2011) aftershock activity. Slide17

Conclusions

The Mineral aftershock sequence is still very much alive, and is more intense now

(6 years after the

mainshock

) than would be predicted by Omori's law, fitted to the early

2011 aftershock data.

The late aftershocks (2017) have a pattern very similar to the 2011 aftershocks. An obviousgap in the aftershock activity near the zone that experienced mainshock rupture persists.This aftershock gap is interpreted to represent the zone of actual moment release (rupture) during the 2011 mainshock. The size of this gap is surprisingly small (a few kilometers) for a

moment magnitude Mw 5.7 earthquake in California, but Virginia is NOT California.The results here are consistent with the findings of Wu and Chapman (2015). The

stress drop of the Mineral earthquake was 70 MPa (700 bars). This is huge, and is one of thelargest well-constrained stress drops ever documented for an earthquake. Assuming a circular rupture and the Brune model, the predicted rupture diameter is 2.7 km. This is tiny compared to a typical California shock of Mw 5.7.

If the Mineral earthquake is representative of intraplate earthquakes, then theyhave tiny rupture dimensions compared to typical plate boundary shocks of the samemoment. They occur on small fault patches and are intensely energetic, withrelatively large displacements. In intraplate settings, pre-existing faults grow during larger

earthquakes by the breakage of fresh rock. Slide18

Thank you for your attention