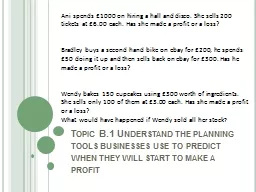
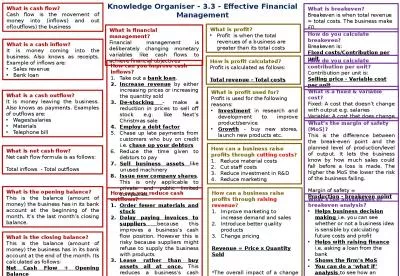
/
Breakeven Point When you make a product, you need to know how many you need to make and Breakeven Point When you make a product, you need to know how many you need to make and

Breakeven Point When you make a product, you need to know how many you need to make and - PowerPoint Presentation

unisoftsm
unisoftsm . @unisoftsm
Follow
342 views
Uploaded On 2020-08-26

Breakeven Point When you make a product, you need to know how many you need to make and - PPT Presentation

This critical point is known as the Breakeven Point It is where you have sold enough items to break even The bigger the profit margin per item the less items you need to sell to breakeven Types of Costs ID: 803047

000 costs profit total costs 000 total profit number income breakeven items unit variable graphing break graph sell point

Share:

Link:

Embed:

Download Presentation from below link

Download The PPT/PDF document "Breakeven Point When you make a product,..." is the property of its rightful owner. Permission is granted to download and print the materials on this web site for personal, non-commercial use only, and to display it on your personal computer provided you do not modify the materials and that you retain all copyright notices contained in the materials. By downloading content from our website, you accept the terms of this agreement.


Presentation Transcript

Slide1

Breakeven Point

Slide2

When you make a product, you need to know how many you need to make and sell to make money.

This critical point is known as the Breakeven Point.

It is where you have sold enough items to break even.

The bigger the profit margin per item – the less items you need to sell to breakeven.

Slide3

Types of Costs

Fixed Costs

These remain the same even though production levels may change.

Rent, insurance, rates, taxes etc.

Variable Costs

These are costs that are linked to production and will change when production levels change.

Cost of materials, wages, power etc.

Slide4

Profit / Loss

In business you want your income to be larger than your costs – this way you make a profit.

Slide5

Variable Costs 75+55+25 =

$155

Fixed Costs 24000 + 5000 + 75000 =

$104,000

Total Income = selling price x number sold

Total Income = 200 x 5000

=

$1,000,000

Slide6

Total Costs = (variable cost per unit x number of units sold) + TFC

Total Costs = (155 x 5000) + 104,000

= 775,000 + 104,000

=

$879,000

Profit or Loss ?

Because your income is higher than your total costs – you must have made a profit.

Profit / Loss = total income – total costs

= 1,000,000 – 879,000

= $121,000

Slide7

Finding How Many Items You Need To Sell To Breakeven

Using this method you can work out the minimum number of items that you need to sell to breakeven.

You can do it by using formulas and by drawing graphs.

The graphing method uses GC.

Slide8

The amount of money you make per unit - i.e. your profit per item

Slide9

Marginal Income Per Unit = Selling Price per unit– Variable Cost per Unit

MIPU = 200 – 155

=

45

Number required to Break Even = Total Fixed Costs/ MIPU

B/E = 104000/45

=2311.11 – so

2312

Surfboards

Slide10

Graphing

You can also graph these things – giving a better picture of what is going on.

The book shows how to do it by hand – we will use GC for all the graphing.

You will need to get used to how to enter the data and then apply this to all questions.

Slide11

Where the lines cross is the breakeven point

Slide12

Using the Graphic Calculator

You need to identify what is being made and call that

x.

(that’s right algebra!)

You use the graphing function

Go to GRAPH and hit exe.

You will see Y1, Y2 etc.. These are the lines that will be drawn.

So you need to convert the question into a form that can be entered into the GC.

Slide13

The number of items being made is

x

.

These are entered into your calculator as Y1 and Y2

Slide14

Slide15

If you get the calculator to draw this by pushing F6 – you probably wont see anything as the scales need to be set.

You need to hit SHIFT F3 to set the viewing window. In this case set:

x min to 0

X-Max 20000

Scale 1000

Y-min 0

Max 300000

Scale 1000

Slide16

Slide17

To find the intersection – which tells us the break even number you hit:

F6 to draw it

SHIFT G-Solve (F5)

ISCT – F5

It will trace the graph and tell you where it intersects – this case it shows x=12000 – which is 12000 items to break even.

Slide18

If you are asked to sketch the graph you need to find:

The intersection as completed on the previous slide.

Y intercept – G-Solv (F5) and then F4