
1 Data, Now What? Skills for Analyzing and
Description: 1 Data, Now What? Skills for Analyzing and Interpreting Data Abby Winer Christina Kasprzak Kathleen Hebbeler Division for Early Childhood Annual Conference October 2014 2 Desired Outcomes Opportunity to practice forming good data analysis
Related Topics
Download Presentation
"1 Data, Now What? Skills for Analyzing and" is the property of its rightful owner. Permission is granted to download and print the materials on this website for personal, non-commercial use only, and to display it on your personal computer provided you do not modify the materials and that you retain all copyright notices contained in the materials. By downloading content from our website, you accept the terms of this agreement.
Presentation Transcript
slide1. 1 Data, Now What?
Skills for Analyzing and Interpreting Data Abby Winer
Christina Kasprzak
Kathleen Hebbeler
Division for Early Childhood Annual Conference
October 2014<br>
slide2. 2 Desired Outcomes Opportunity to practice forming good data analysis questions
Opportunity to examine and discuss different ways of analyzing aggregate data for program improvement
Opportunity to discuss and interpret data to drive program improvement
Program characteristics
Child characteristics<br>
slide3. 3 Child Outcomes States are required to report on the percent of infants and toddlers with Individualized Family Service Plans (IFSPs) or preschool children with Individualized Education Plans (IEPs) who demonstrate improved:
Positive social-emotional skills (including social relationships);
Acquisition and use of knowledge and skills (including early language/communication [and early literacy]); and
Use of appropriate behaviors to meet their needs.<br>
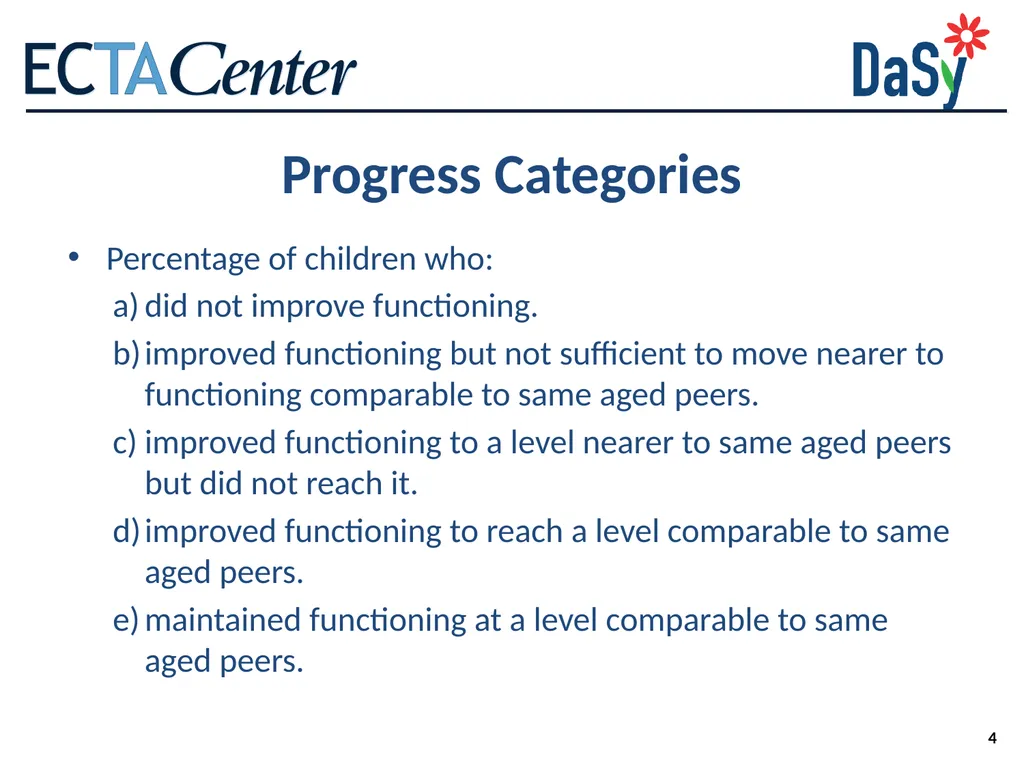
slide4. 4 Progress Categories Percentage of children who:
did not improve functioning.
improved functioning but not sufficient to move nearer to functioning comparable to same aged peers.
improved functioning to a level nearer to same aged peers but did not reach it.
improved functioning to reach a level comparable to same aged peers.
maintained functioning at a level comparable to same aged peers.<br>
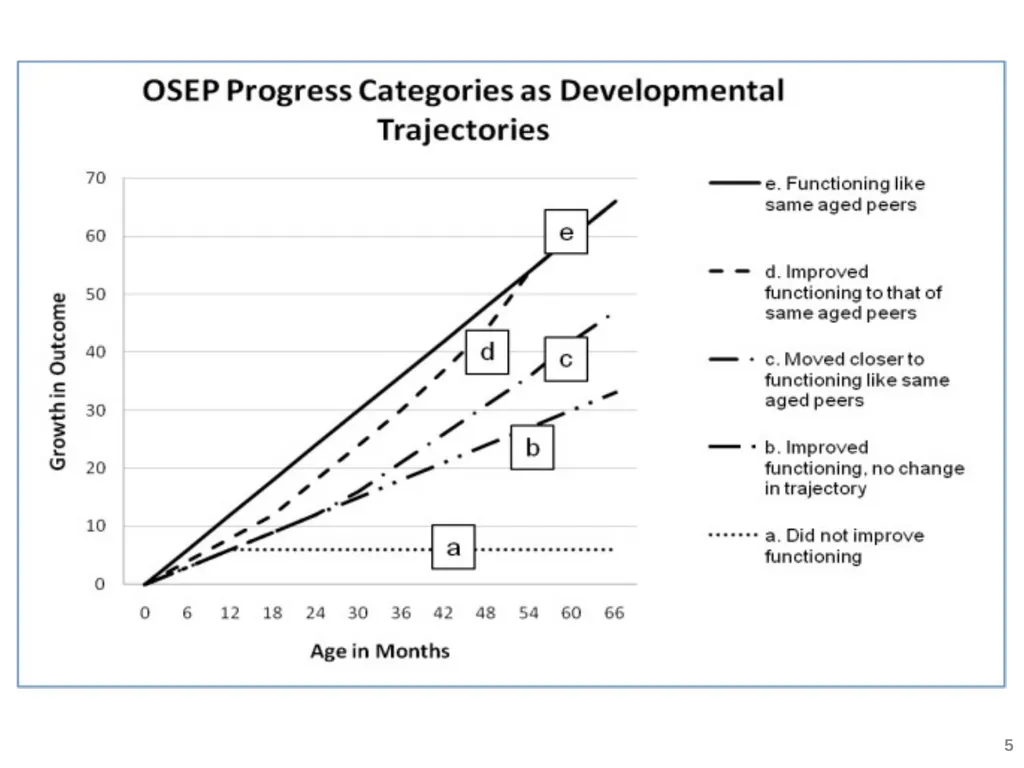
slide5. 5<br>
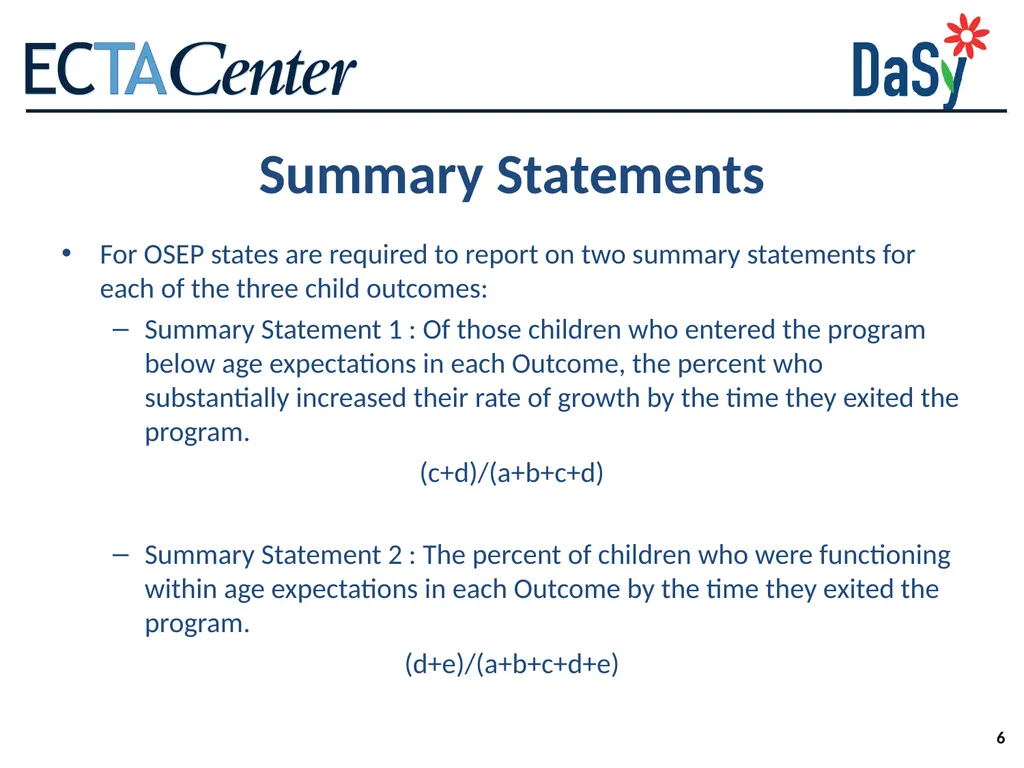
slide6. 6 Summary Statements For OSEP states are required to report on two summary statements for each of the three child outcomes:
Summary Statement 1 : Of those children who entered the program below age expectations in each Outcome, the percent who substantially increased their rate of growth by the time they exited the program.
(c+d)/(a+b+c+d)
Summary Statement 2 : The percent of children who were functioning within age expectations in each Outcome by the time they exited the program.
(d+e)/(a+b+c+d+e)<br>
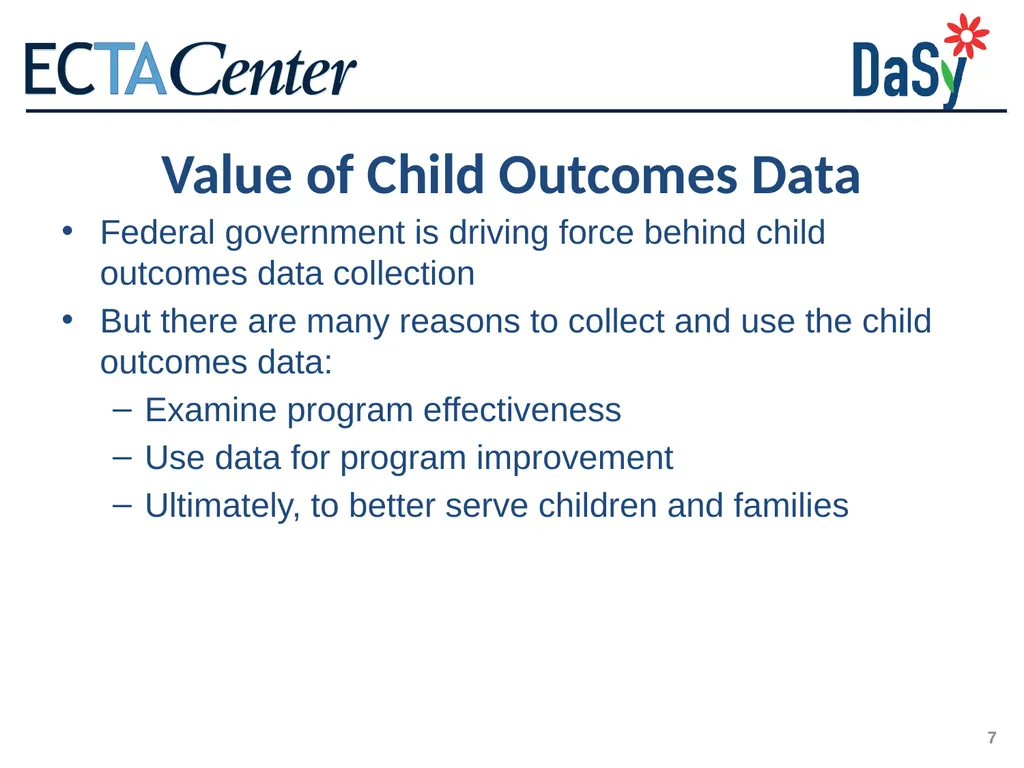
slide7. 7 Value of Child Outcomes Data Federal government is driving force behind child outcomes data collection
But there are many reasons to collect and use the child outcomes data:
Examine program effectiveness
Use data for program improvement
Ultimately, to better serve children and families<br>
slide8. 8 Evidence
Inference
Action 8<br>
slide9. 9 Evidence Evidence refers to the numbers, such as
“45% of children in category b”
The numbers are not debatable 9<br>
slide10. 10 Inference How do you interpret the #s?
What can you conclude from the #s?
Does evidence mean good news? Bad news? News we can’t interpret?
To reach an inference, sometimes we analyze data in other ways (ask for more evidence) 10<br>
slide11. 11 Inference Inference is debatable -- even reasonable people can reach different conclusions
Stakeholders can help with putting meaning on the numbers
Early on, the inference may be more a question of the quality of the data 11<br>
slide12. 12 Action Given the inference from the numbers, what should be done?
Recommendations or action steps
Action can be debatable – and often is
Another role for stakeholders
Again, early on the action might have to do with improving the quality of the data 12<br>
slide13. 13 Topic 1: Forming Good Questions<br>
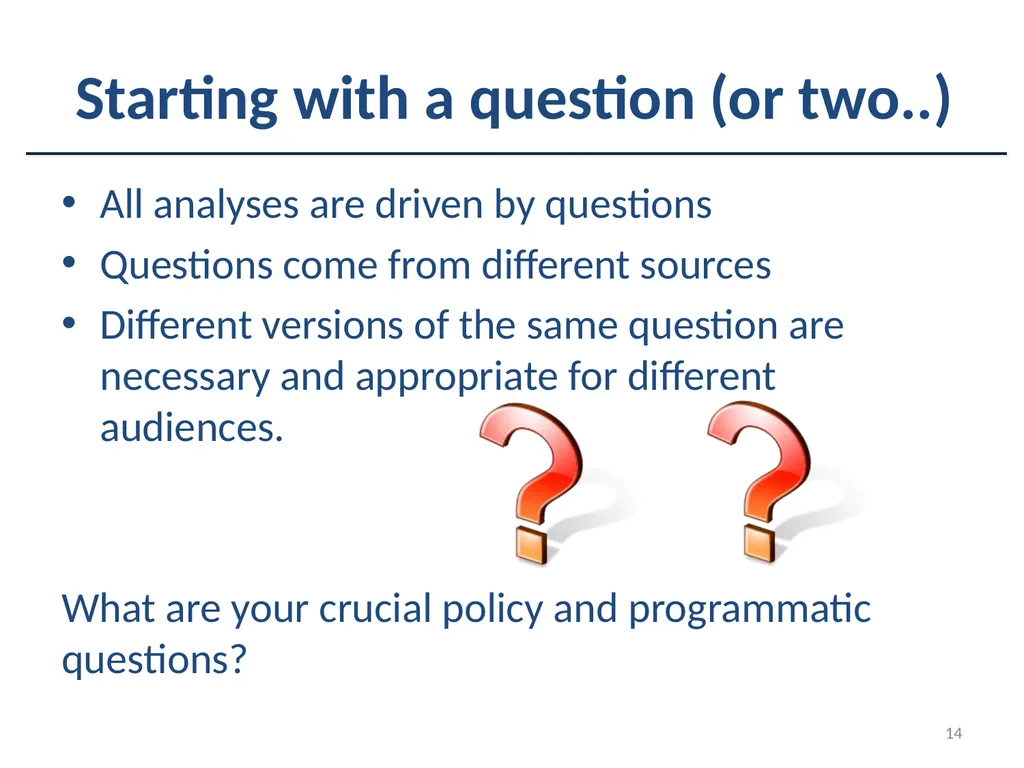
slide14. 14 Starting with a question (or two..) All analyses are driven by questions
Questions come from different sources
Different versions of the same question are necessary and appropriate for different audiences.
What are your crucial policy and programmatic questions?<br>
slide15. 15 Defining Data Analysis Questions What are your crucial policy and programmatic questions?
Example:
1. Does our program/district serve some children more effectively than others?
Do children with different racial/ethnic backgrounds have similar outcomes?<br>
slide16. 16 Question sources Internal – State administrators, staff
External –
The governor, the legislature
Advocates
Families of children with disabilities
General public
OSEP
External sources may not have a clear sense of what they want to know<br>
slide17. 17 Sample basic questions Who is being served?
What services are provided?
How much services is provided?
Which professionals provide services?
What is the quality of the services provided?
What outcomes do children achieve?<br>
slide18. 18 Sample questions that cut across components How do outcomes relate to services?
Who receives which services?
Who receives the most services?
Which services are high quality?
Which children receive high cost services?<br>
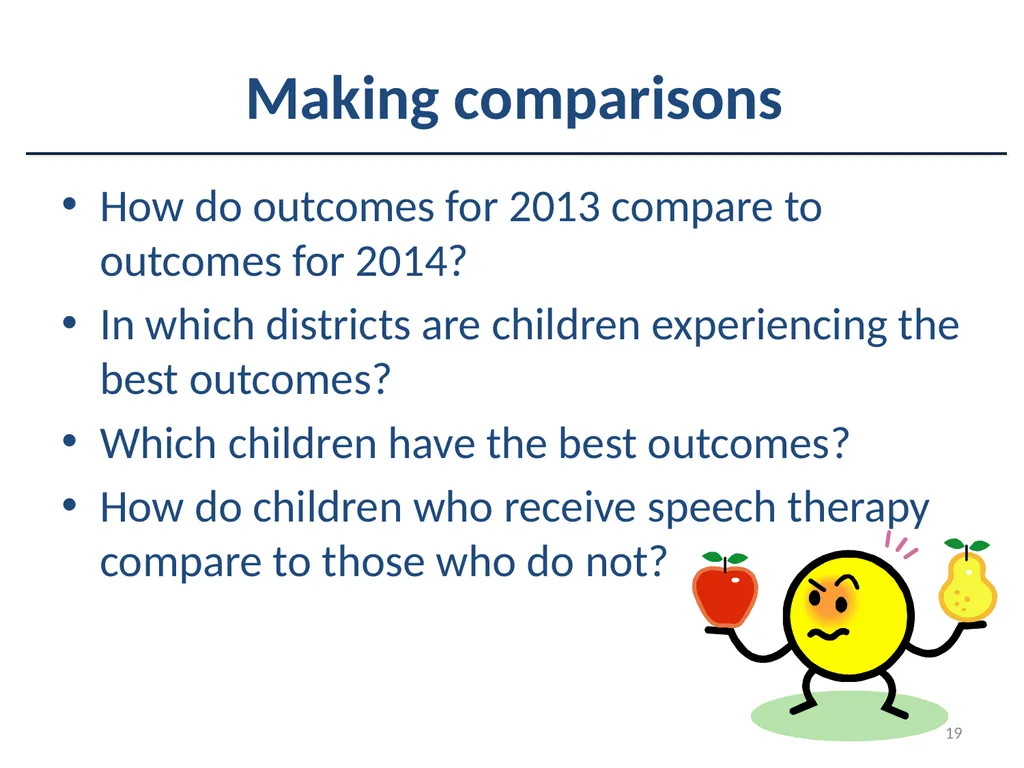
slide19. 19 Making comparisons How do outcomes for 2013 compare to outcomes for 2014?
In which districts are children experiencing the best outcomes?
Which children have the best outcomes?
How do children who receive speech therapy compare to those who do not?<br>
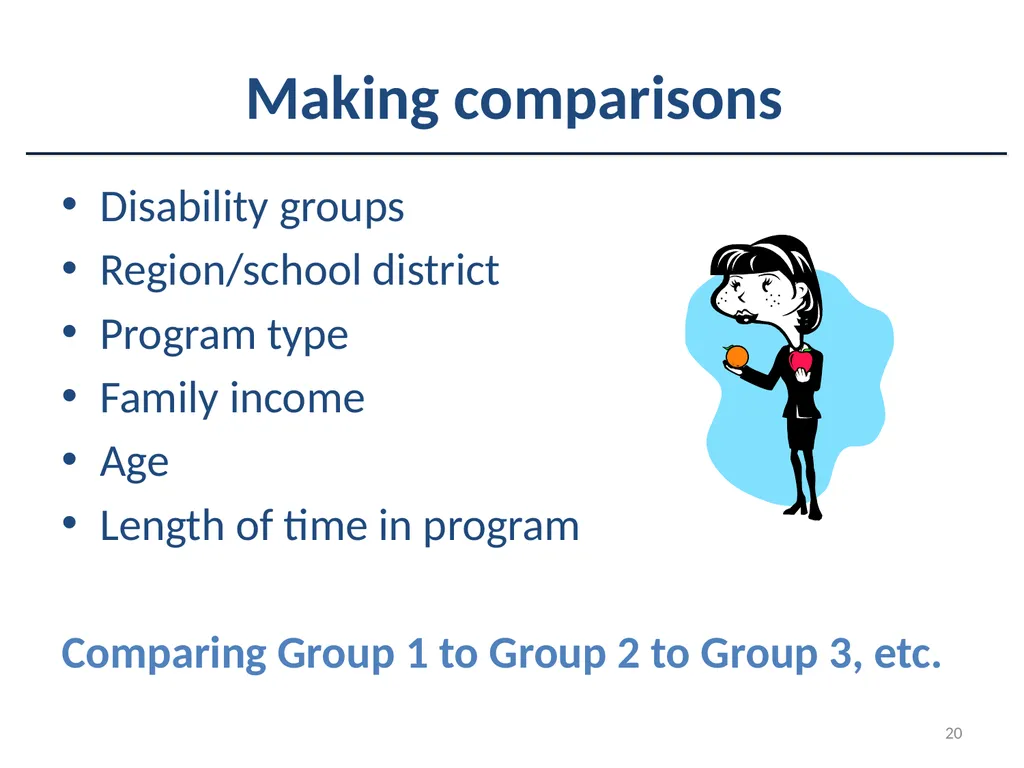
slide20. 20 Making comparisons Disability groups
Region/school district
Program type
Family income
Age
Length of time in program
Comparing Group 1 to Group 2 to Group 3, etc.<br>
slide21. 21 Question precision A research question is completely precise when the data elements and the analyses have been specified.
Are programs serving young children with disabilities effective?
(question 1)<br>
slide22. 22 Question precision Of the children who exited the program between July 1, 2012 and June 30, 2013 and had been in program at least 6 months and were not typically developing in outcome 1, what percentage gained at least one score point between entry and exit score on outcome 1?
(question 2)<br>
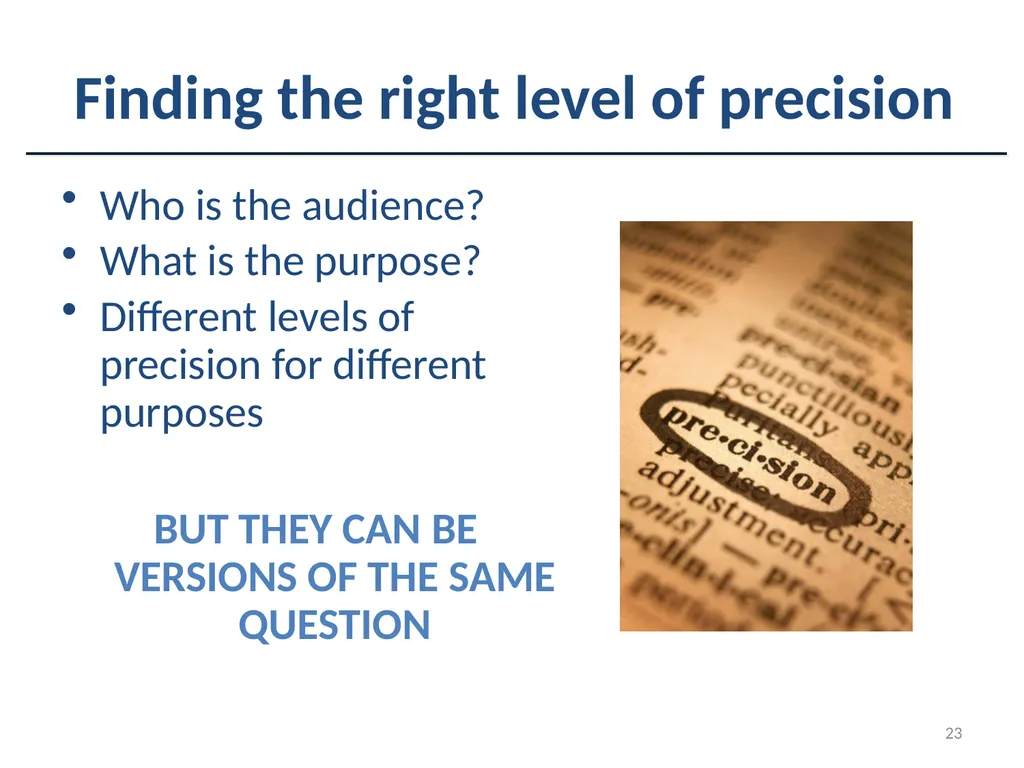
slide23. 23 Finding the right level of precision Who is the audience?
What is the purpose?
Different levels of precision for different purposes
BUT THEY CAN BE VERSIONS OF THE SAME QUESTION<br>
slide24. 24 Activity 1, Part I & II Starting with a Question
I: Forming Good Data Analysis Questions
II: Generating Questions<br>
slide25. 25 Topic 2: Looking at Data<br>
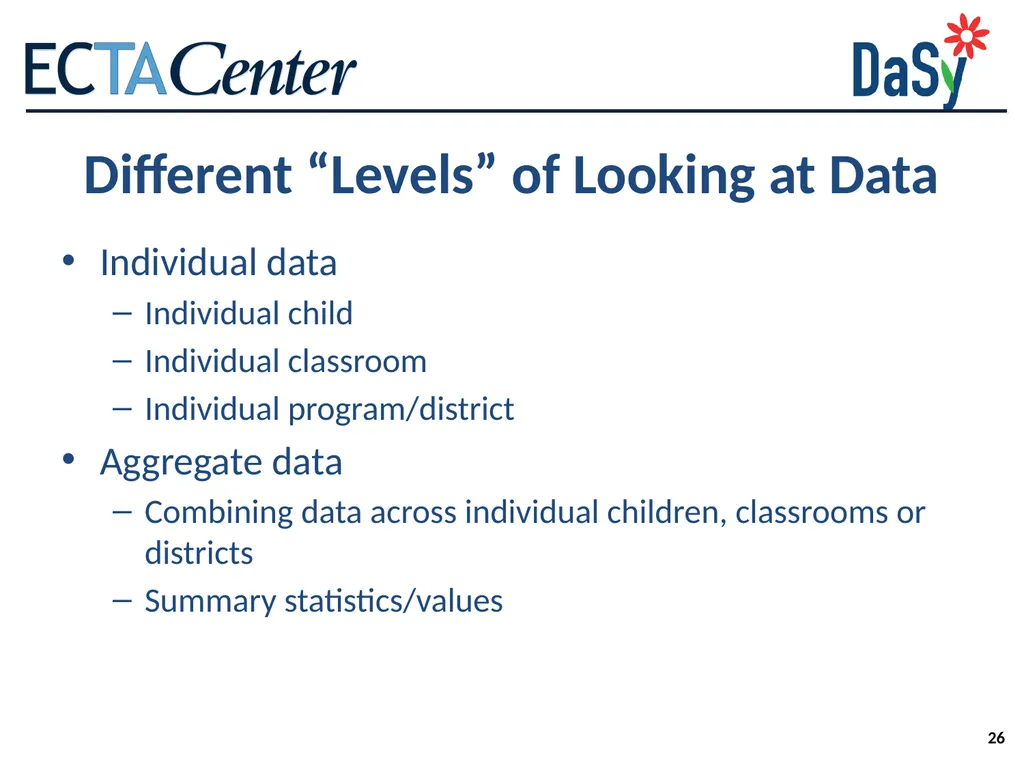
slide26. 26 Different “Levels” of Looking at Data Individual data
Individual child
Individual classroom
Individual program/district
Aggregate data
Combining data across individual children, classrooms or districts
Summary statistics/values<br>
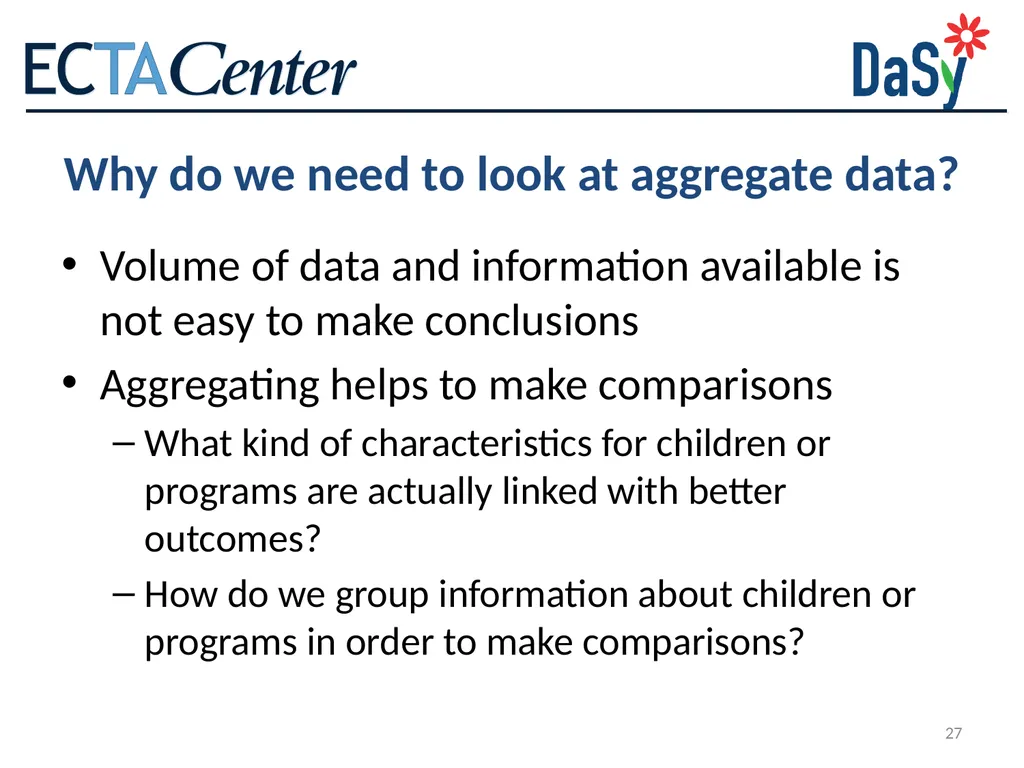
slide27. 27 Why do we need to look at aggregate data? Volume of data and information available is not easy to make conclusions
Aggregating helps to make comparisons
What kind of characteristics for children or programs are actually linked with better outcomes?
How do we group information about children or programs in order to make comparisons?<br>
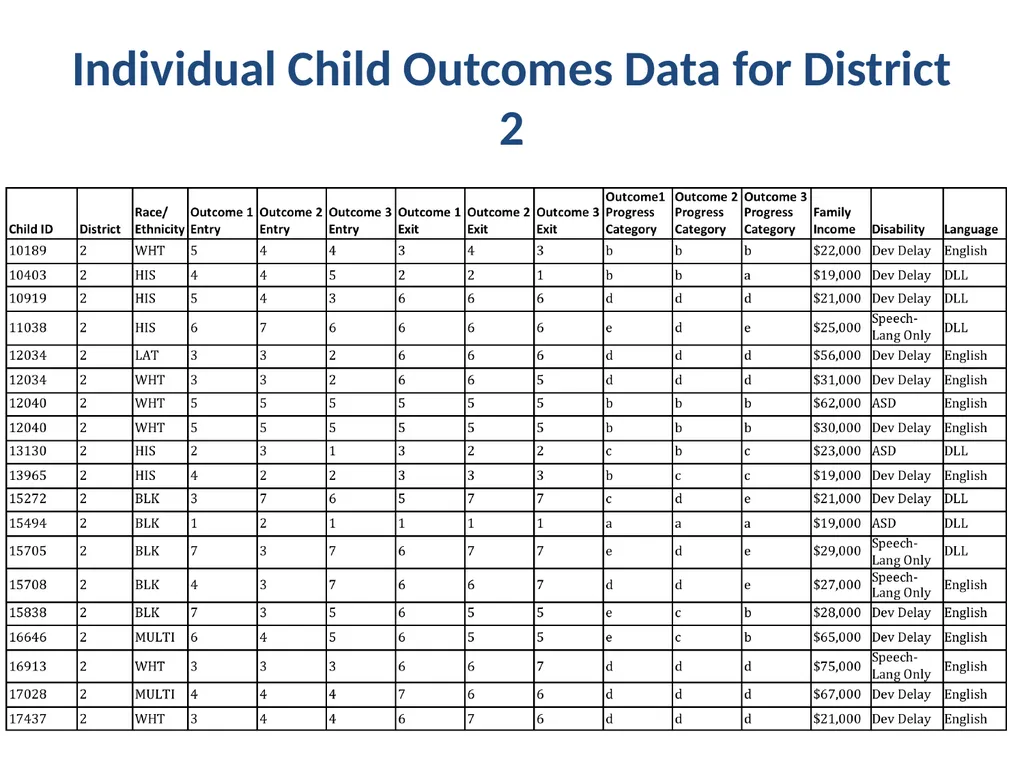
slide28. 28 Individual Child Outcomes Data for District 2<br>
slide29. 29 Activity – 2 Looking at Data<br>
slide30. 30 Comparing District Characteristics<br>
slide31. 31 Which Districts Have Better Outcomes? What do we mean by “which”?
Subgroups!
What subgroups to consider?
What factors differ across some districts
How are districts different from one another?<br>
slide32. 32 Linking Different Pieces of Information What information do you have available about district characteristics?
Is it already captured in a data system or report?
Is it collected systematically?
What about qualitative information?<br>
slide33. 33 Activity – 3 Comparing District Characteristics<br>
slide34. 34 Comparing Child/Family Characteristics<br>
slide35. 35 Planning for Follow-up Analyses Analysis planning
Asking a question – what else do you want to know?
Generating hypotheses
Identifying data sources, including comparisons (what groups to compare, how to put together groups)<br>
slide36. 36 Which Children Have Better Outcomes than Others? What do we mean by “which”?
Subgroups!
What subgroups to consider?
What factors differ for children within or across classrooms/districts/regions?
How are children/families different from one another?<br>
slide37. 37 Linking Different Pieces of Information What information do you have available about child/family characteristics?
Is it already captured in a data system or report?
Is it collected systematically?
What about qualitative information?<br>
slide38. 38 Activity – 4 Comparing Child/Family Characteristics<br>
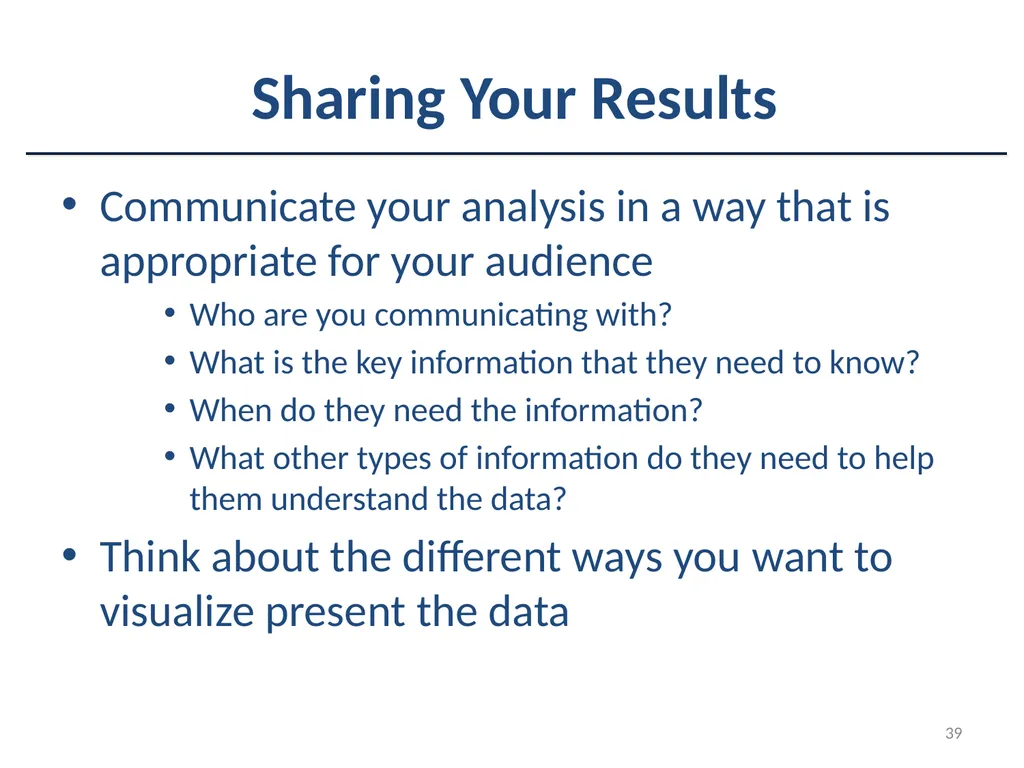
slide39. 39 Sharing Your Results Communicate your analysis in a way that is appropriate for your audience
Who are you communicating with?
What is the key information that they need to know?
When do they need the information?
What other types of information do they need to help them understand the data?
Think about the different ways you want to visualize present the data<br>
slide40. 40 Thank You! 45<br>
Christina Kasprzak
Kathleen Hebbeler
Division for Early Childhood Annual Conference
October 2014<br>
slide2. 2 Desired Outcomes Opportunity to practice forming good data analysis questions
Opportunity to examine and discuss different ways of analyzing aggregate data for program improvement
Opportunity to discuss and interpret data to drive program improvement
Program characteristics
Child characteristics<br>
slide3. 3 Child Outcomes States are required to report on the percent of infants and toddlers with Individualized Family Service Plans (IFSPs) or preschool children with Individualized Education Plans (IEPs) who demonstrate improved:
Positive social-emotional skills (including social relationships);
Acquisition and use of knowledge and skills (including early language/communication [and early literacy]); and
Use of appropriate behaviors to meet their needs.<br>
slide4. 4 Progress Categories Percentage of children who:
did not improve functioning.
improved functioning but not sufficient to move nearer to functioning comparable to same aged peers.
improved functioning to a level nearer to same aged peers but did not reach it.
improved functioning to reach a level comparable to same aged peers.
maintained functioning at a level comparable to same aged peers.<br>
slide5. 5<br>
slide6. 6 Summary Statements For OSEP states are required to report on two summary statements for each of the three child outcomes:
Summary Statement 1 : Of those children who entered the program below age expectations in each Outcome, the percent who substantially increased their rate of growth by the time they exited the program.
(c+d)/(a+b+c+d)
Summary Statement 2 : The percent of children who were functioning within age expectations in each Outcome by the time they exited the program.
(d+e)/(a+b+c+d+e)<br>
slide7. 7 Value of Child Outcomes Data Federal government is driving force behind child outcomes data collection
But there are many reasons to collect and use the child outcomes data:
Examine program effectiveness
Use data for program improvement
Ultimately, to better serve children and families<br>
slide8. 8 Evidence
Inference
Action 8<br>
slide9. 9 Evidence Evidence refers to the numbers, such as
“45% of children in category b”
The numbers are not debatable 9<br>
slide10. 10 Inference How do you interpret the #s?
What can you conclude from the #s?
Does evidence mean good news? Bad news? News we can’t interpret?
To reach an inference, sometimes we analyze data in other ways (ask for more evidence) 10<br>
slide11. 11 Inference Inference is debatable -- even reasonable people can reach different conclusions
Stakeholders can help with putting meaning on the numbers
Early on, the inference may be more a question of the quality of the data 11<br>
slide12. 12 Action Given the inference from the numbers, what should be done?
Recommendations or action steps
Action can be debatable – and often is
Another role for stakeholders
Again, early on the action might have to do with improving the quality of the data 12<br>
slide13. 13 Topic 1: Forming Good Questions<br>
slide14. 14 Starting with a question (or two..) All analyses are driven by questions
Questions come from different sources
Different versions of the same question are necessary and appropriate for different audiences.
What are your crucial policy and programmatic questions?<br>
slide15. 15 Defining Data Analysis Questions What are your crucial policy and programmatic questions?
Example:
1. Does our program/district serve some children more effectively than others?
Do children with different racial/ethnic backgrounds have similar outcomes?<br>
slide16. 16 Question sources Internal – State administrators, staff
External –
The governor, the legislature
Advocates
Families of children with disabilities
General public
OSEP
External sources may not have a clear sense of what they want to know<br>
slide17. 17 Sample basic questions Who is being served?
What services are provided?
How much services is provided?
Which professionals provide services?
What is the quality of the services provided?
What outcomes do children achieve?<br>
slide18. 18 Sample questions that cut across components How do outcomes relate to services?
Who receives which services?
Who receives the most services?
Which services are high quality?
Which children receive high cost services?<br>
slide19. 19 Making comparisons How do outcomes for 2013 compare to outcomes for 2014?
In which districts are children experiencing the best outcomes?
Which children have the best outcomes?
How do children who receive speech therapy compare to those who do not?<br>
slide20. 20 Making comparisons Disability groups
Region/school district
Program type
Family income
Age
Length of time in program
Comparing Group 1 to Group 2 to Group 3, etc.<br>
slide21. 21 Question precision A research question is completely precise when the data elements and the analyses have been specified.
Are programs serving young children with disabilities effective?
(question 1)<br>
slide22. 22 Question precision Of the children who exited the program between July 1, 2012 and June 30, 2013 and had been in program at least 6 months and were not typically developing in outcome 1, what percentage gained at least one score point between entry and exit score on outcome 1?
(question 2)<br>
slide23. 23 Finding the right level of precision Who is the audience?
What is the purpose?
Different levels of precision for different purposes
BUT THEY CAN BE VERSIONS OF THE SAME QUESTION<br>
slide24. 24 Activity 1, Part I & II Starting with a Question
I: Forming Good Data Analysis Questions
II: Generating Questions<br>
slide25. 25 Topic 2: Looking at Data<br>
slide26. 26 Different “Levels” of Looking at Data Individual data
Individual child
Individual classroom
Individual program/district
Aggregate data
Combining data across individual children, classrooms or districts
Summary statistics/values<br>
slide27. 27 Why do we need to look at aggregate data? Volume of data and information available is not easy to make conclusions
Aggregating helps to make comparisons
What kind of characteristics for children or programs are actually linked with better outcomes?
How do we group information about children or programs in order to make comparisons?<br>
slide28. 28 Individual Child Outcomes Data for District 2<br>
slide29. 29 Activity – 2 Looking at Data<br>
slide30. 30 Comparing District Characteristics<br>
slide31. 31 Which Districts Have Better Outcomes? What do we mean by “which”?
Subgroups!
What subgroups to consider?
What factors differ across some districts
How are districts different from one another?<br>
slide32. 32 Linking Different Pieces of Information What information do you have available about district characteristics?
Is it already captured in a data system or report?
Is it collected systematically?
What about qualitative information?<br>
slide33. 33 Activity – 3 Comparing District Characteristics<br>
slide34. 34 Comparing Child/Family Characteristics<br>
slide35. 35 Planning for Follow-up Analyses Analysis planning
Asking a question – what else do you want to know?
Generating hypotheses
Identifying data sources, including comparisons (what groups to compare, how to put together groups)<br>
slide36. 36 Which Children Have Better Outcomes than Others? What do we mean by “which”?
Subgroups!
What subgroups to consider?
What factors differ for children within or across classrooms/districts/regions?
How are children/families different from one another?<br>
slide37. 37 Linking Different Pieces of Information What information do you have available about child/family characteristics?
Is it already captured in a data system or report?
Is it collected systematically?
What about qualitative information?<br>
slide38. 38 Activity – 4 Comparing Child/Family Characteristics<br>
slide39. 39 Sharing Your Results Communicate your analysis in a way that is appropriate for your audience
Who are you communicating with?
What is the key information that they need to know?
When do they need the information?
What other types of information do they need to help them understand the data?
Think about the different ways you want to visualize present the data<br>
slide40. 40 Thank You! 45<br>