
2015 EDUCAUSE Core Data Service (CDS) Benchmarking
TA
Published · 53 slides · 0 views
1 / 1



Description
2015 EDUCAUSE Core Data Service (CDS) Benchmarking Report Table of Contents 2 About CDS Since 2002, the EDUCAUSE Core Data Service (CDS) has been providing higher education CIOs and senior IT leaders with the benchmarks they need to make
Related Topics
Share
Embed code
Download this presentation From Below
"2015 EDUCAUSE Core Data Service (CDS) Benchmarking" is the property of its rightful owner. Permission is granted to download and print the materials on this website for personal, non-commercial use only, and to display it on your personal computer provided you do not modify the materials and that you retain all copyright notices contained in the materials. By downloading content from our website, you accept the terms of this agreement.
Presentation Transcript
01
2015 EDUCAUSE Core Data Service (CDS) Benchmarking Report<br>
02
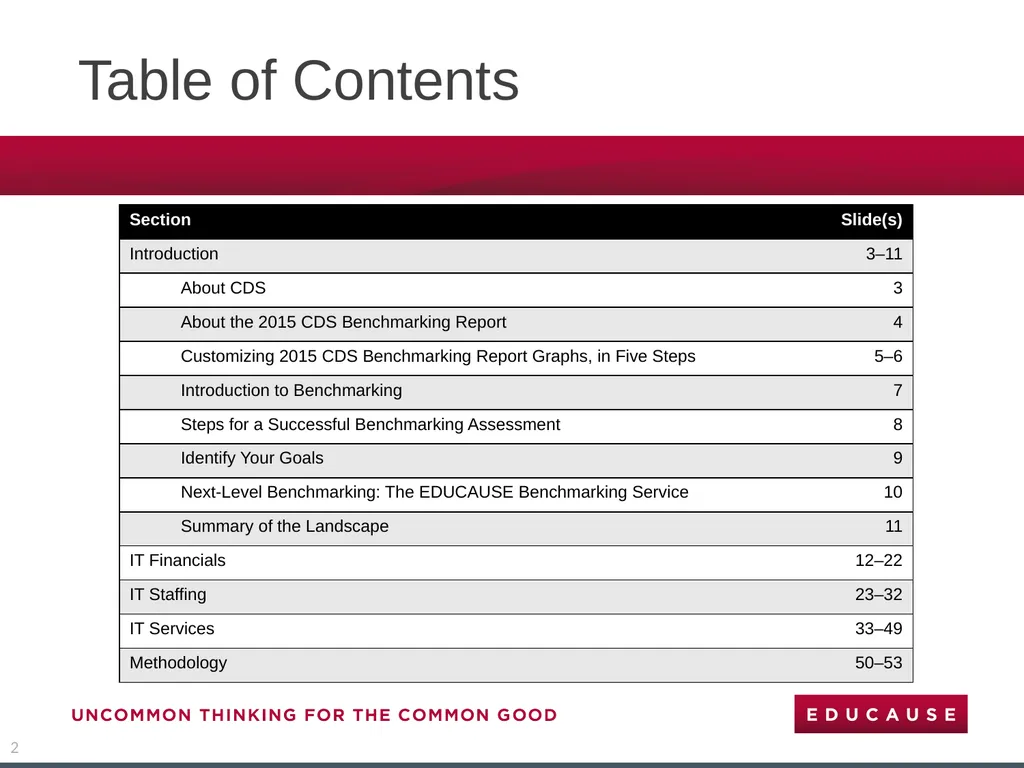
Table of Contents 2<br>
03
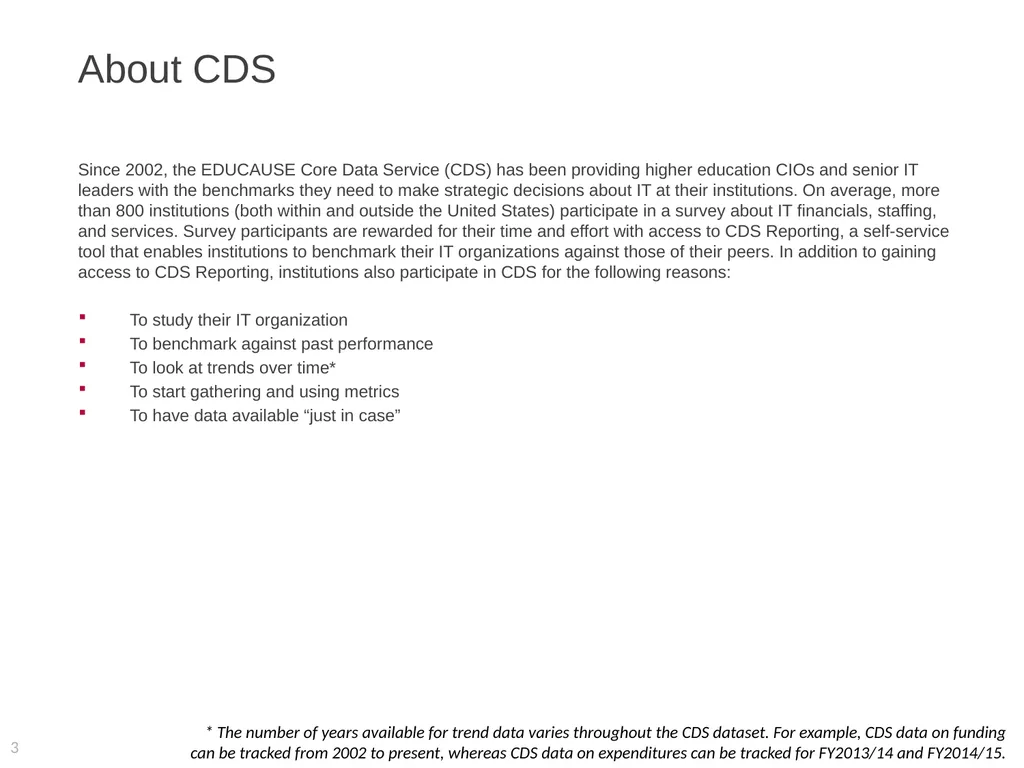
About CDS Since 2002, the EDUCAUSE Core Data Service (CDS) has been providing higher education CIOs and senior IT leaders with the benchmarks they need to make strategic decisions about IT at their institutions. On average, more than 800 institutions (both within and outside the United States) participate in a survey about IT financials, staffing, and services. Survey participants are rewarded for their time and effort with access to CDS Reporting, a self-service tool that enables institutions to benchmark their IT organizations against those of their peers. In addition to gaining access to CDS Reporting, institutions also participate in CDS for the following reasons:
To study their IT organization
To benchmark against past performance
To look at trends over time*
To start gathering and using metrics
To have data available “just in case” 3 * The number of years available for trend data varies throughout the CDS dataset. For example, CDS data on funding can be tracked from 2002 to present, whereas CDS data on expenditures can be tracked for FY2013/14 and FY2014/15.<br>
To study their IT organization
To benchmark against past performance
To look at trends over time*
To start gathering and using metrics
To have data available “just in case” 3 * The number of years available for trend data varies throughout the CDS dataset. For example, CDS data on funding can be tracked from 2002 to present, whereas CDS data on expenditures can be tracked for FY2013/14 and FY2014/15.<br>
04
About the 2015 CDS Benchmarking Report The 2015 CDS Benchmarking Report summarizes key findings from the CDS 2015 survey, provides a glimpse into the breadth of CDS data, and ultimately provides you with an opportunity to conduct your own benchmarking assessment. The customizable graphs contained within this report are meant to be used to assess your IT operation compared to that of peer institutions of similar size, control, or Carnegie Classification.
As you consider the metrics and benchmarks in this report in relation to your institution, findings that differ from your experience should inspire questions, not answers. When questions do arise, CDS Reporting can facilitate further investigation (if your institution participated in CDS 2015). If your institution did not participate, consider adding your data to the next CDS survey, launching in July 2016.
The CDS 2015 survey concluded with 813 participants. The metrics discussed in this report focus primarily on FY2014/15 central IT financials, staffing, and services from 718 nonspecialized U.S. institutions. Metrics are calculated for each of six Carnegie Classification groupings using the 2010 classification system (AA, BA, MA private, MA public, DR private, and DR public). These groupings provide the most granular breakdown by institutional type possible (given available sample sizes) and should provide suitable comparison groups for most institution types and sizes within the United States.
Forty-seven specialized U.S. institutions and 48 non-U.S. institutions from 17 countries participated in the 2015 survey; however, small sample sizes from each of these groups preclude meaningful aggregate analysis. If your institution is a specialized U.S. institution or a non-U.S. institution, this report may be used to compare your institution to institutions in a similar Carnegie Classification or to the metric calculated for All (non-specialized) U.S. institutions. A list of CDS 2015 participants can be found on the CDS website.
The metrics in this report evaluate central IT only. Central IT funding, expenditure, and staffing data are only one component of the full IT resource picture at institutions with significant distributed IT resources. Data on distributed resources, however, remain elusive. Thanks to a recent paper from ECAR Working Groups on Calculating the Costs of Distributed IT Staff and Applications, efforts are under way to improve the quality of these data for future years. As of CDS 2015, coarse estimates of distributed IT spending and staffing at institutions can be found in CDS Reporting. 4<br>
As you consider the metrics and benchmarks in this report in relation to your institution, findings that differ from your experience should inspire questions, not answers. When questions do arise, CDS Reporting can facilitate further investigation (if your institution participated in CDS 2015). If your institution did not participate, consider adding your data to the next CDS survey, launching in July 2016.
The CDS 2015 survey concluded with 813 participants. The metrics discussed in this report focus primarily on FY2014/15 central IT financials, staffing, and services from 718 nonspecialized U.S. institutions. Metrics are calculated for each of six Carnegie Classification groupings using the 2010 classification system (AA, BA, MA private, MA public, DR private, and DR public). These groupings provide the most granular breakdown by institutional type possible (given available sample sizes) and should provide suitable comparison groups for most institution types and sizes within the United States.
Forty-seven specialized U.S. institutions and 48 non-U.S. institutions from 17 countries participated in the 2015 survey; however, small sample sizes from each of these groups preclude meaningful aggregate analysis. If your institution is a specialized U.S. institution or a non-U.S. institution, this report may be used to compare your institution to institutions in a similar Carnegie Classification or to the metric calculated for All (non-specialized) U.S. institutions. A list of CDS 2015 participants can be found on the CDS website.
The metrics in this report evaluate central IT only. Central IT funding, expenditure, and staffing data are only one component of the full IT resource picture at institutions with significant distributed IT resources. Data on distributed resources, however, remain elusive. Thanks to a recent paper from ECAR Working Groups on Calculating the Costs of Distributed IT Staff and Applications, efforts are under way to improve the quality of these data for future years. As of CDS 2015, coarse estimates of distributed IT spending and staffing at institutions can be found in CDS Reporting. 4<br>
05
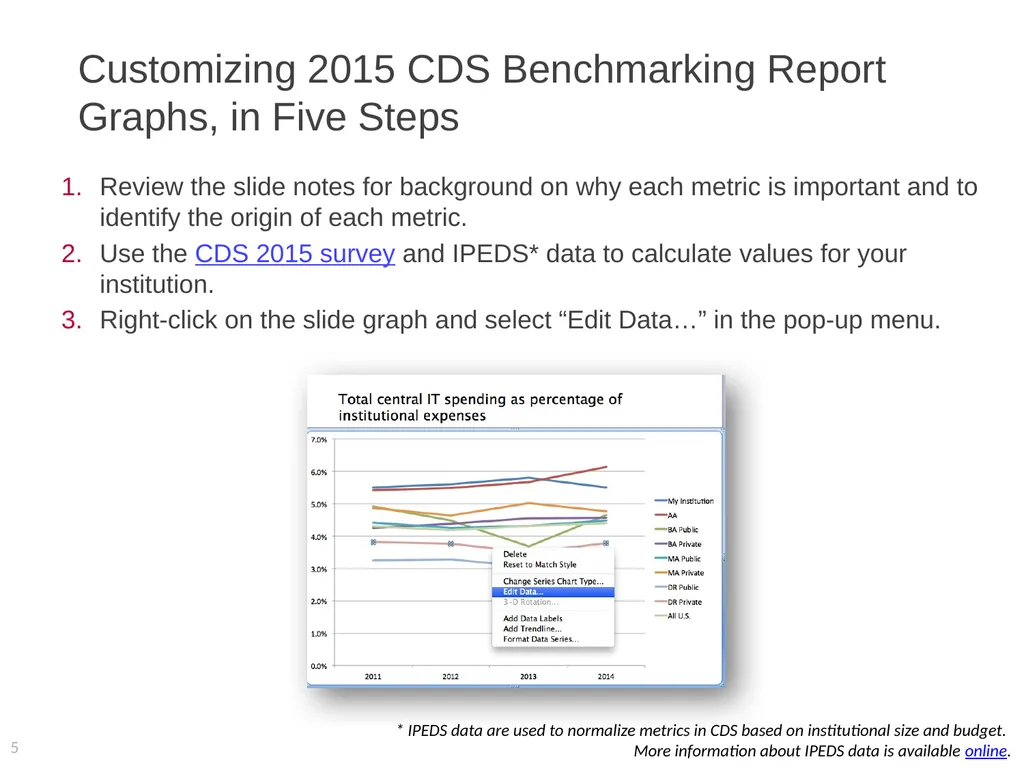
Customizing 2015 CDS Benchmarking Report Graphs, in Five Steps Review the slide notes for background on why each metric is important and to identify the origin of each metric.
Use the CDS 2015 survey and IPEDS* data to calculate values for your institution.
Right-click on the slide graph and select “Edit Data…” in the pop-up menu. 5 * IPEDS data are used to normalize metrics in CDS based on institutional size and budget. More information about IPEDS data is available online.<br>
Use the CDS 2015 survey and IPEDS* data to calculate values for your institution.
Right-click on the slide graph and select “Edit Data…” in the pop-up menu. 5 * IPEDS data are used to normalize metrics in CDS based on institutional size and budget. More information about IPEDS data is available online.<br>
06
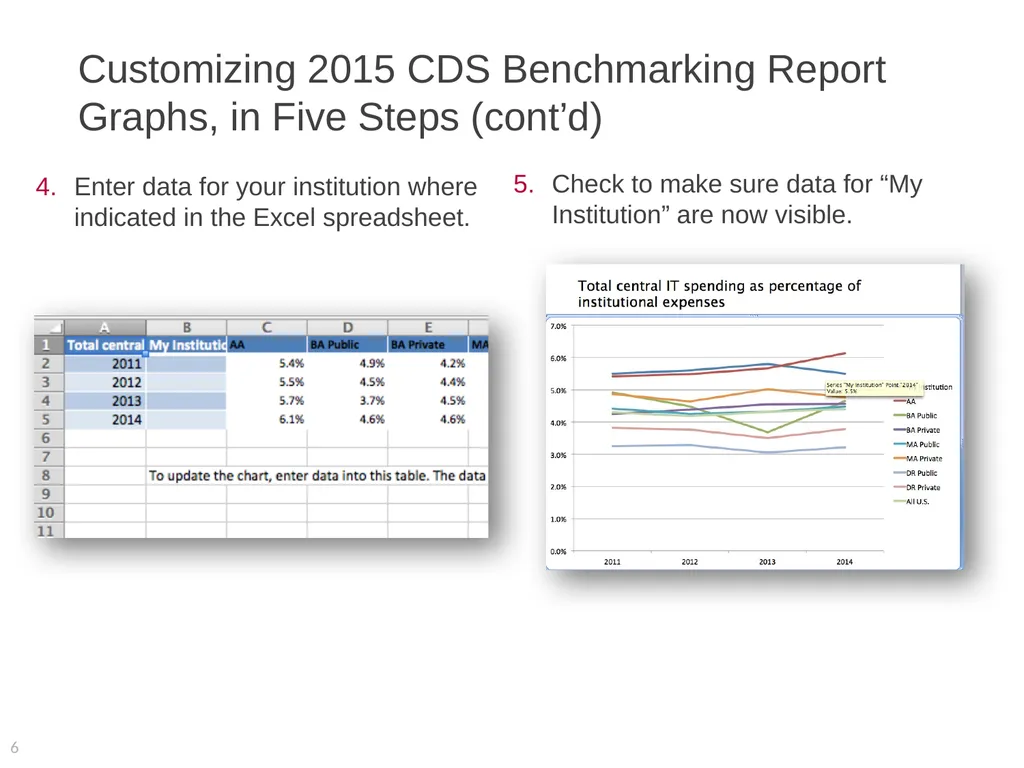
Customizing 2015 CDS Benchmarking Report Graphs, in Five Steps (cont’d) Enter data for your institution where indicated in the Excel spreadsheet. 6 Check to make sure data for “My Institution” are now visible.<br>
07
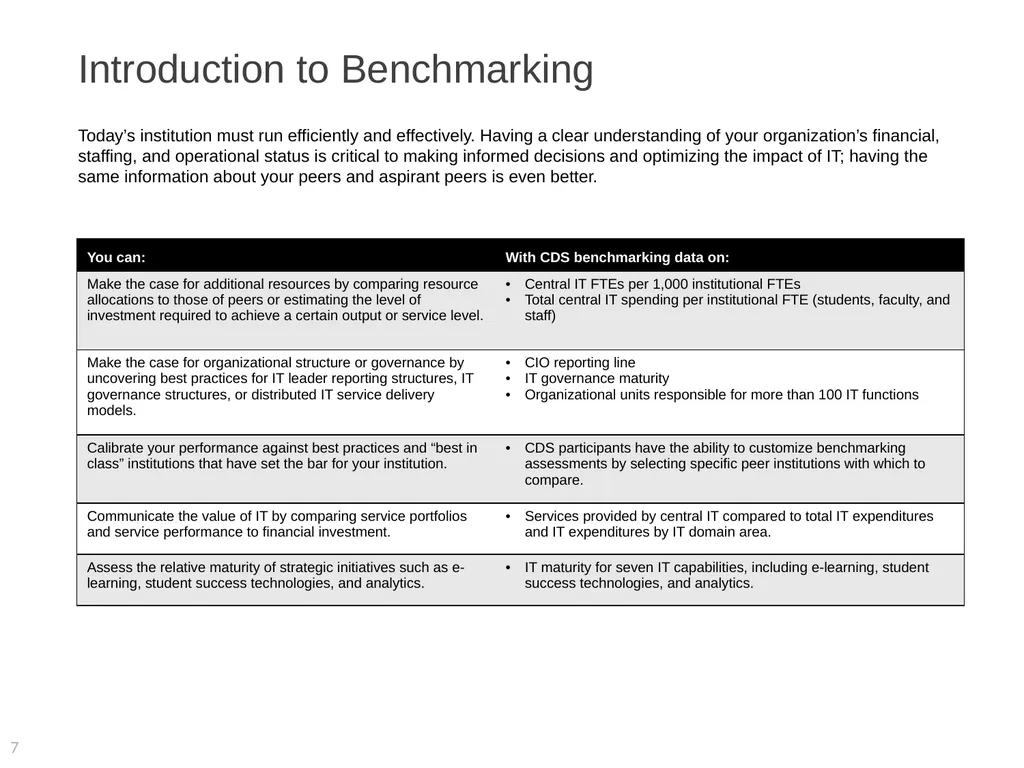
Introduction to Benchmarking Today’s institution must run efficiently and effectively. Having a clear understanding of your organization’s financial, staffing, and operational status is critical to making informed decisions and optimizing the impact of IT; having the same information about your peers and aspirant peers is even better. 7<br>
08
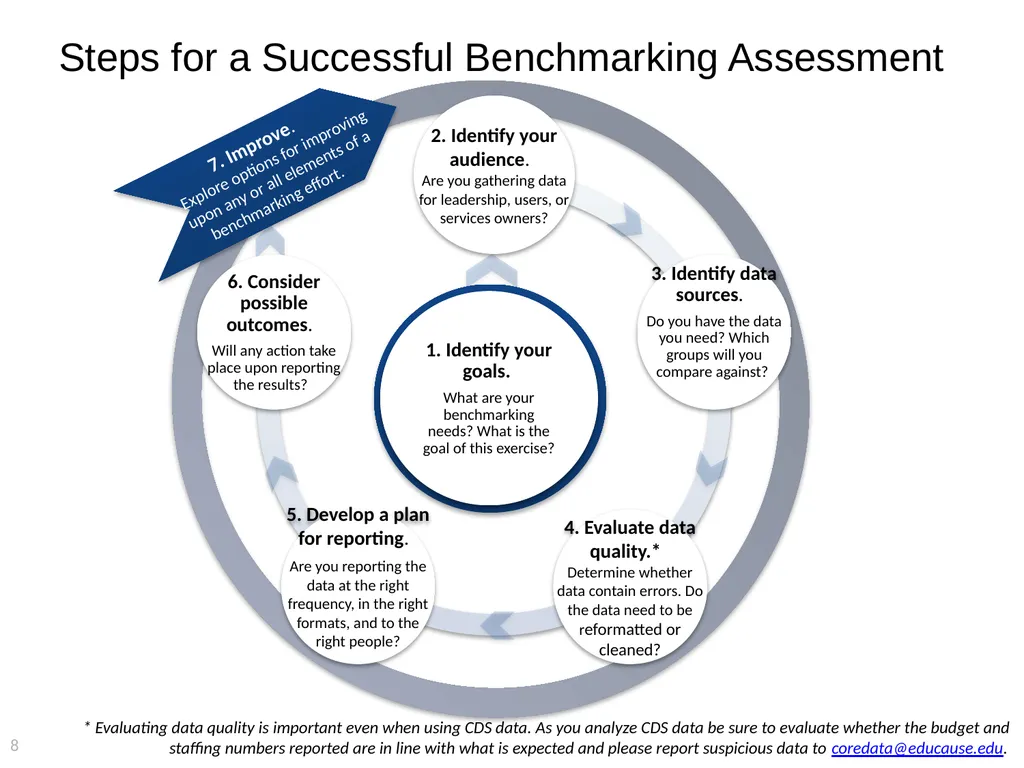
Steps for a Successful Benchmarking Assessment 8 * Evaluating data quality is important even when using CDS data. As you analyze CDS data be sure to evaluate whether the budget and staffing numbers reported are in line with what is expected and please report suspicious data to coredata@educause.edu.<br>
09
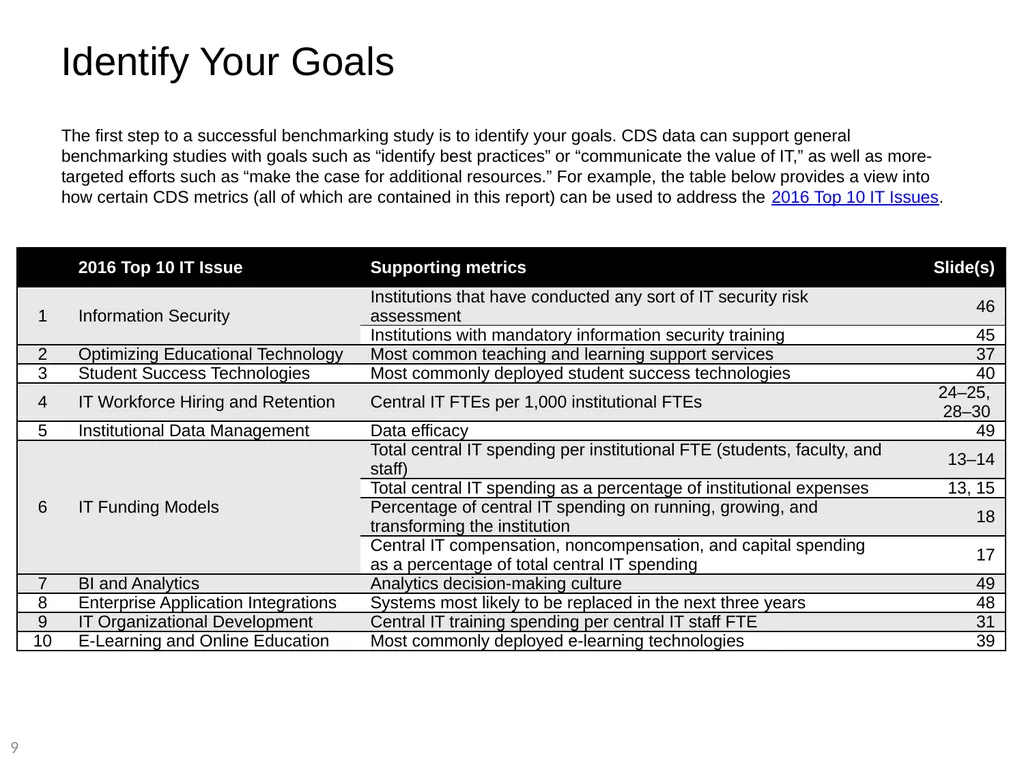
Identify Your Goals The first step to a successful benchmarking study is to identify your goals. CDS data can support general benchmarking studies with goals such as “identify best practices” or “communicate the value of IT,” as well as more-targeted efforts such as “make the case for additional resources.” For example, the table below provides a view into how certain CDS metrics (all of which are contained in this report) can be used to address the 2016 Top 10 IT Issues.<br>
10
Next-Level Benchmarking:
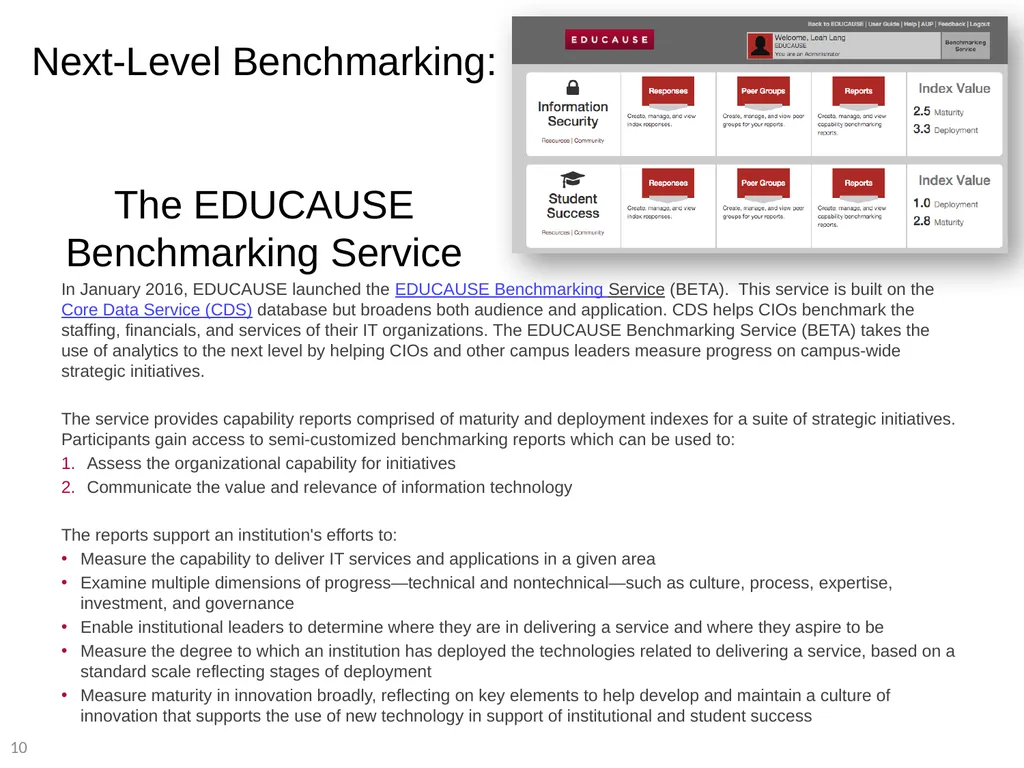
The EDUCAUSE Benchmarking Service In January 2016, EDUCAUSE launched the EDUCAUSE Benchmarking Service (BETA). This service is built on the Core Data Service (CDS) database but broadens both audience and application. CDS helps CIOs benchmark the staffing, financials, and services of their IT organizations. The EDUCAUSE Benchmarking Service (BETA) takes the use of analytics to the next level by helping CIOs and other campus leaders measure progress on campus-wide strategic initiatives.
The service provides capability reports comprised of maturity and deployment indexes for a suite of strategic initiatives. Participants gain access to semi-customized benchmarking reports which can be used to:
Assess the organizational capability for initiatives
Communicate the value and relevance of information technology
The reports support an institution's efforts to:
Measure the capability to deliver IT services and applications in a given area
Examine multiple dimensions of progress—technical and nontechnical—such as culture, process, expertise, investment, and governance
Enable institutional leaders to determine where they are in delivering a service and where they aspire to be
Measure the degree to which an institution has deployed the technologies related to delivering a service, based on a standard scale reflecting stages of deployment
Measure maturity in innovation broadly, reflecting on key elements to help develop and maintain a culture of innovation that supports the use of new technology in support of institutional and student success<br>
The service provides capability reports comprised of maturity and deployment indexes for a suite of strategic initiatives. Participants gain access to semi-customized benchmarking reports which can be used to:
Assess the organizational capability for initiatives
Communicate the value and relevance of information technology
The reports support an institution's efforts to:
Measure the capability to deliver IT services and applications in a given area
Examine multiple dimensions of progress—technical and nontechnical—such as culture, process, expertise, investment, and governance
Enable institutional leaders to determine where they are in delivering a service and where they aspire to be
Measure the degree to which an institution has deployed the technologies related to delivering a service, based on a standard scale reflecting stages of deployment
Measure maturity in innovation broadly, reflecting on key elements to help develop and maintain a culture of innovation that supports the use of new technology in support of institutional and student success<br>
11
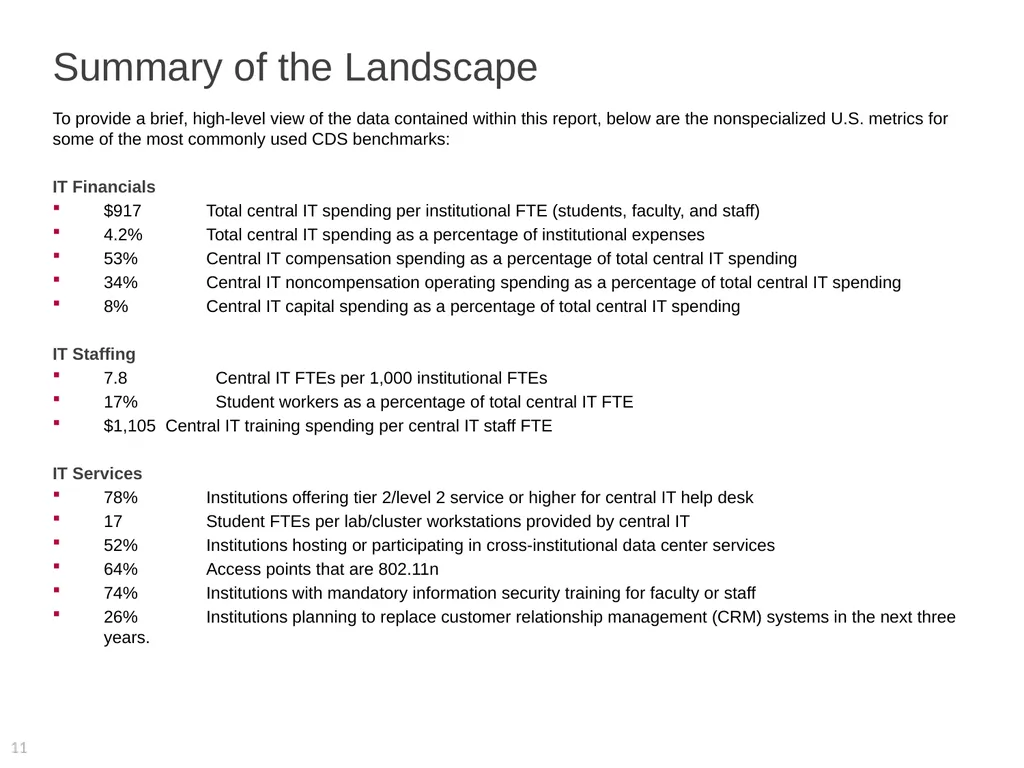
Summary of the Landscape To provide a brief, high-level view of the data contained within this report, below are the nonspecialized U.S. metrics for some of the most commonly used CDS benchmarks:
IT Financials
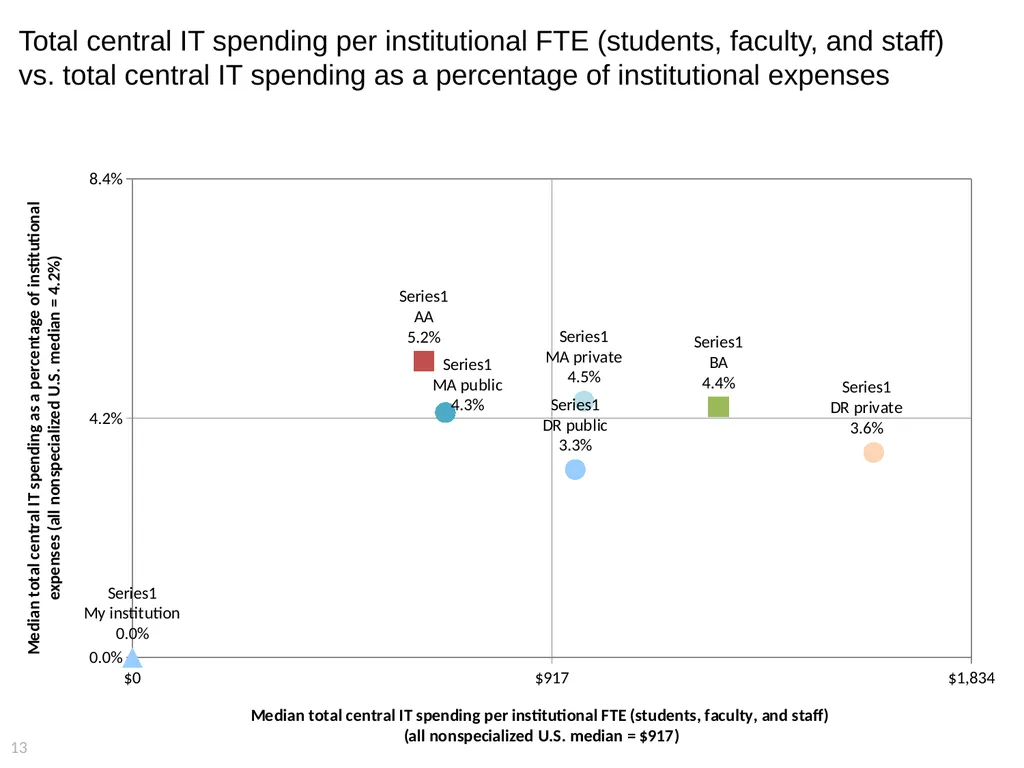
$917 Total central IT spending per institutional FTE (students, faculty, and staff)
4.2% Total central IT spending as a percentage of institutional expenses
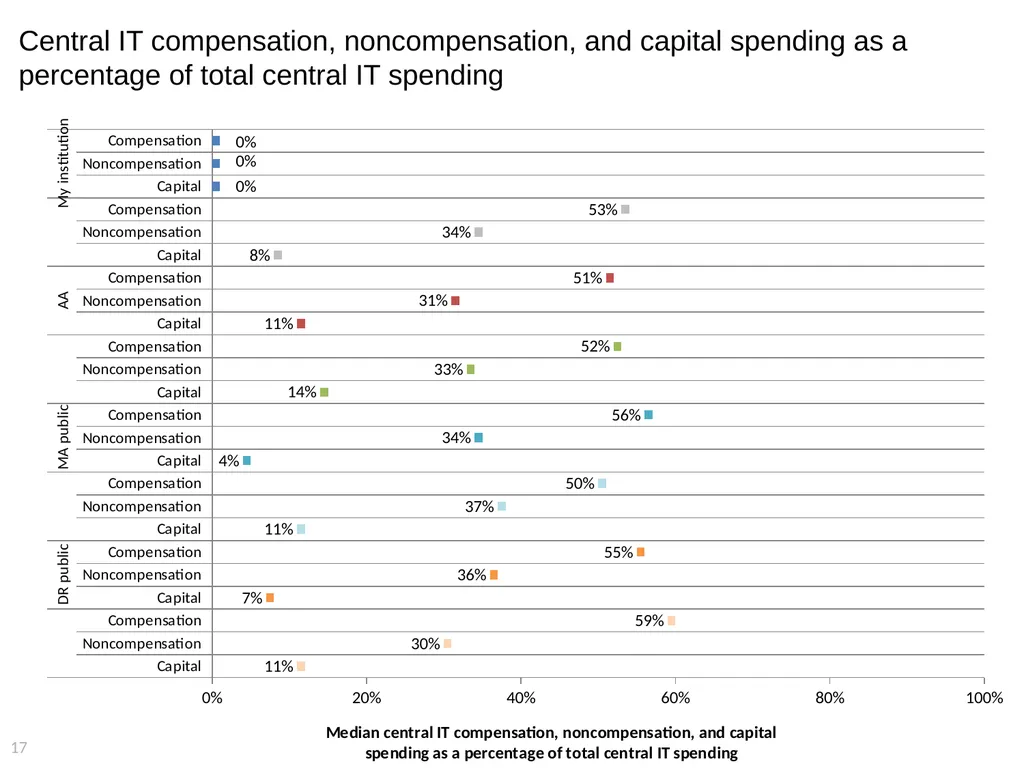
53% Central IT compensation spending as a percentage of total central IT spending
34% Central IT noncompensation operating spending as a percentage of total central IT spending
8% Central IT capital spending as a percentage of total central IT spending
IT Staffing
7.8 Central IT FTEs per 1,000 institutional FTEs
17% Student workers as a percentage of total central IT FTE
$1,105 Central IT training spending per central IT staff FTE
IT Services
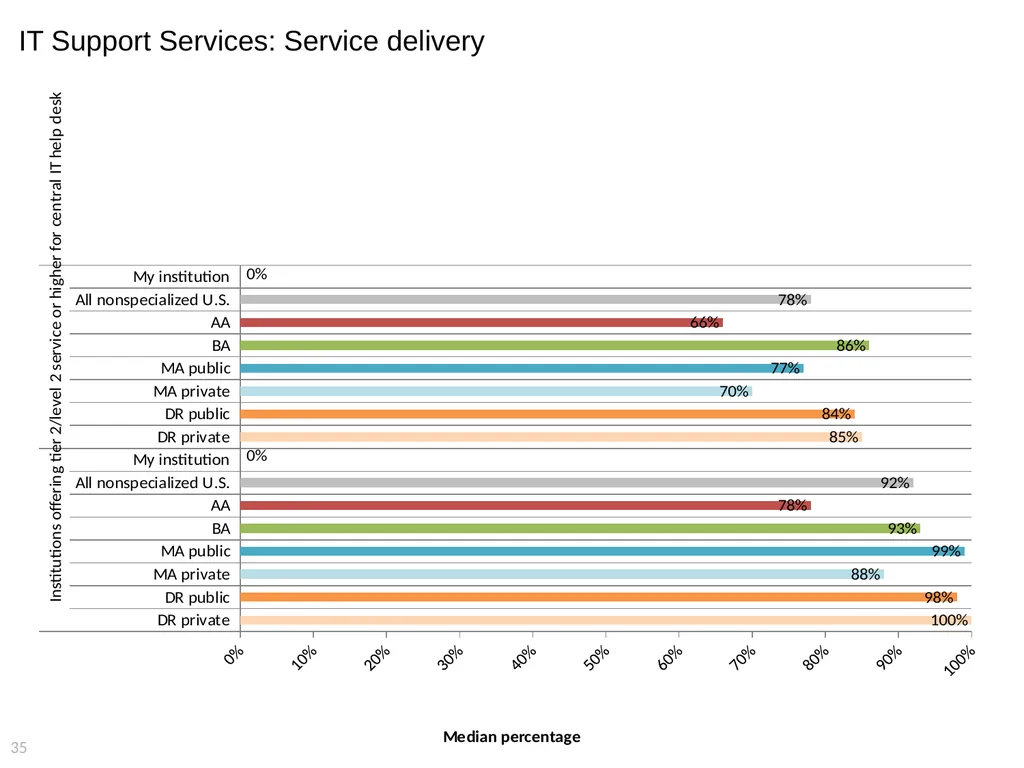
78% Institutions offering tier 2/level 2 service or higher for central IT help desk
17 Student FTEs per lab/cluster workstations provided by central IT
52% Institutions hosting or participating in cross-institutional data center services
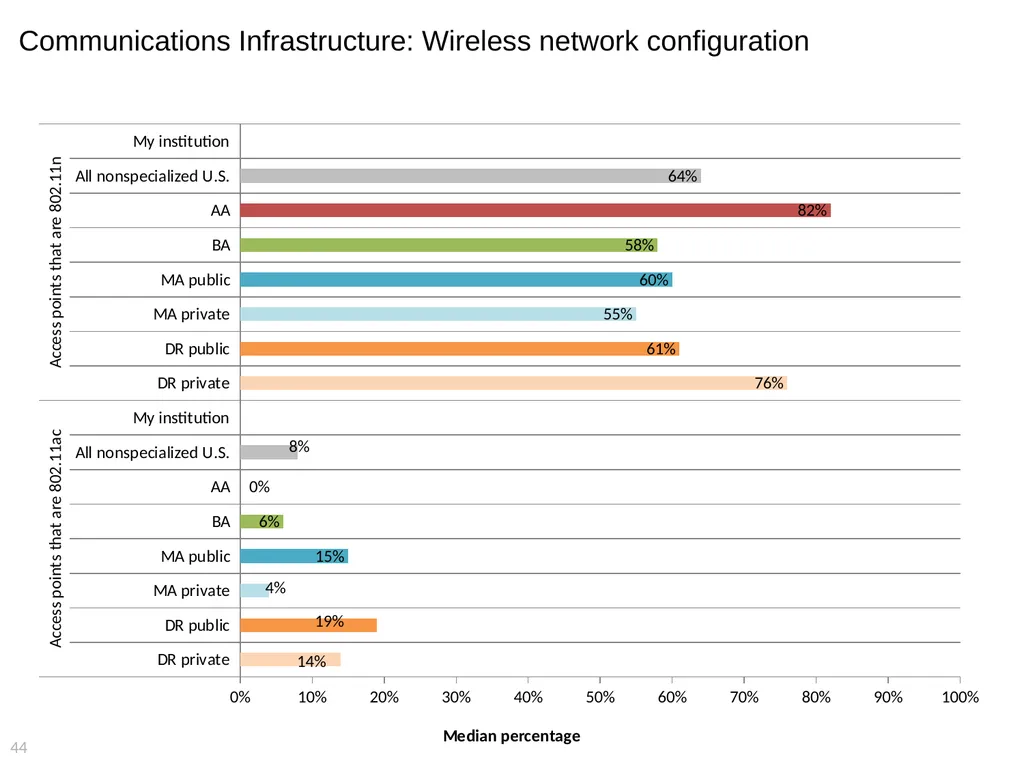
64% Access points that are 802.11n
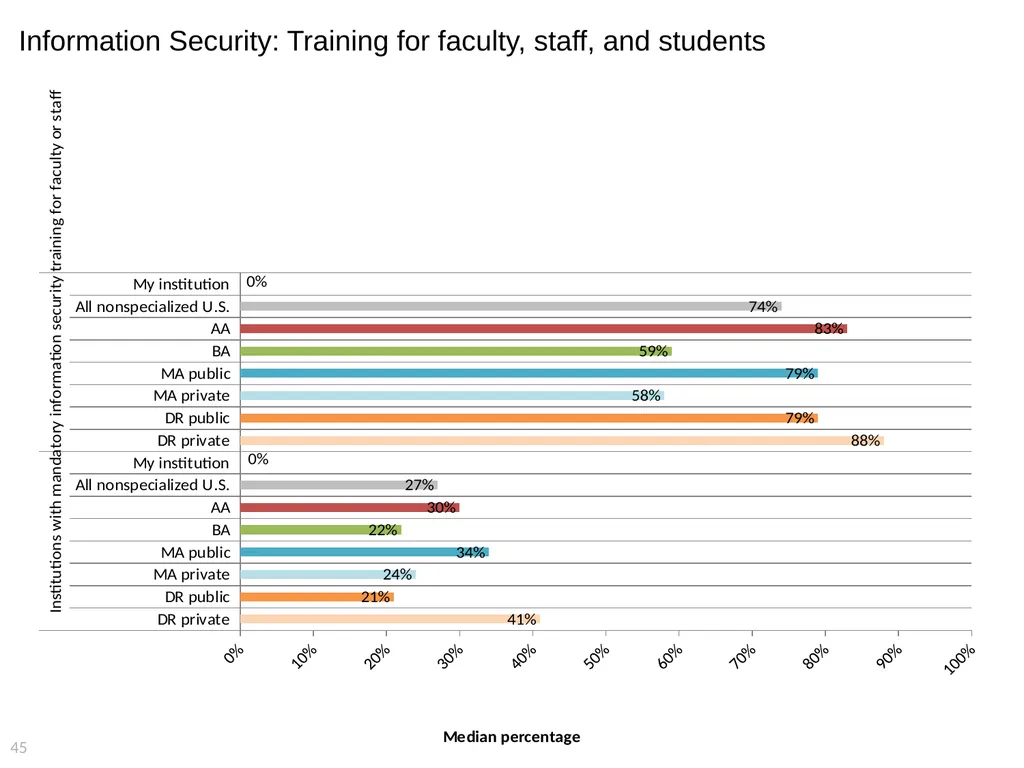
74% Institutions with mandatory information security training for faculty or staff
26% Institutions planning to replace customer relationship management (CRM) systems in the next three years. 11<br>
IT Financials
$917 Total central IT spending per institutional FTE (students, faculty, and staff)
4.2% Total central IT spending as a percentage of institutional expenses
53% Central IT compensation spending as a percentage of total central IT spending
34% Central IT noncompensation operating spending as a percentage of total central IT spending
8% Central IT capital spending as a percentage of total central IT spending
IT Staffing
7.8 Central IT FTEs per 1,000 institutional FTEs
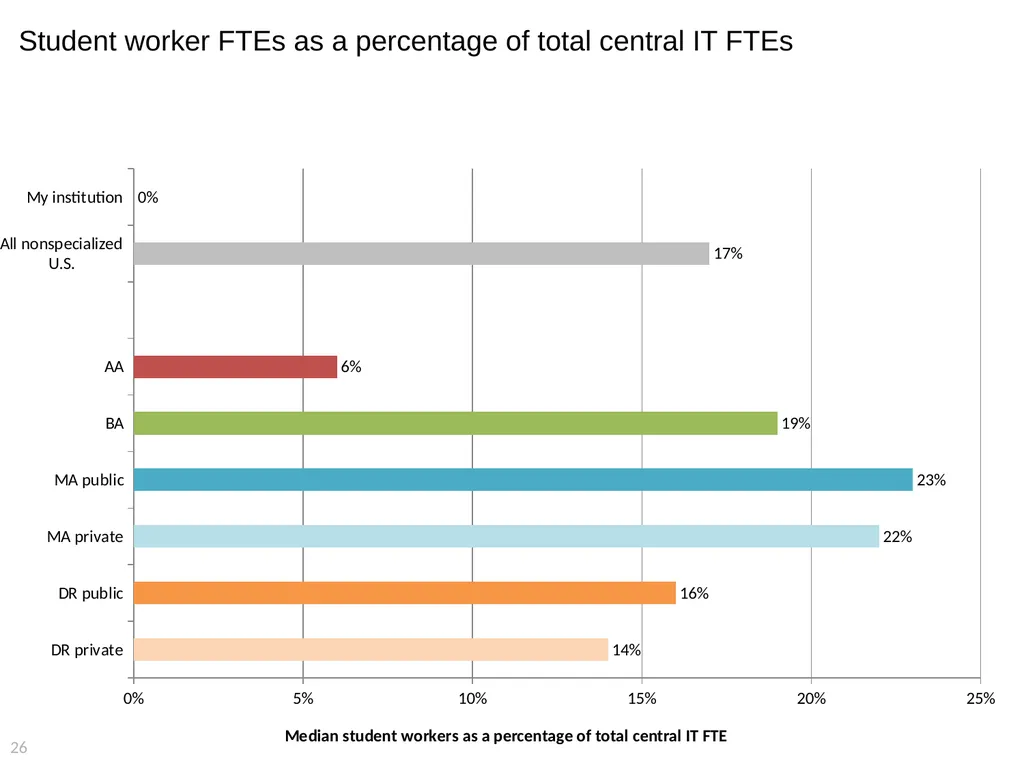
17% Student workers as a percentage of total central IT FTE
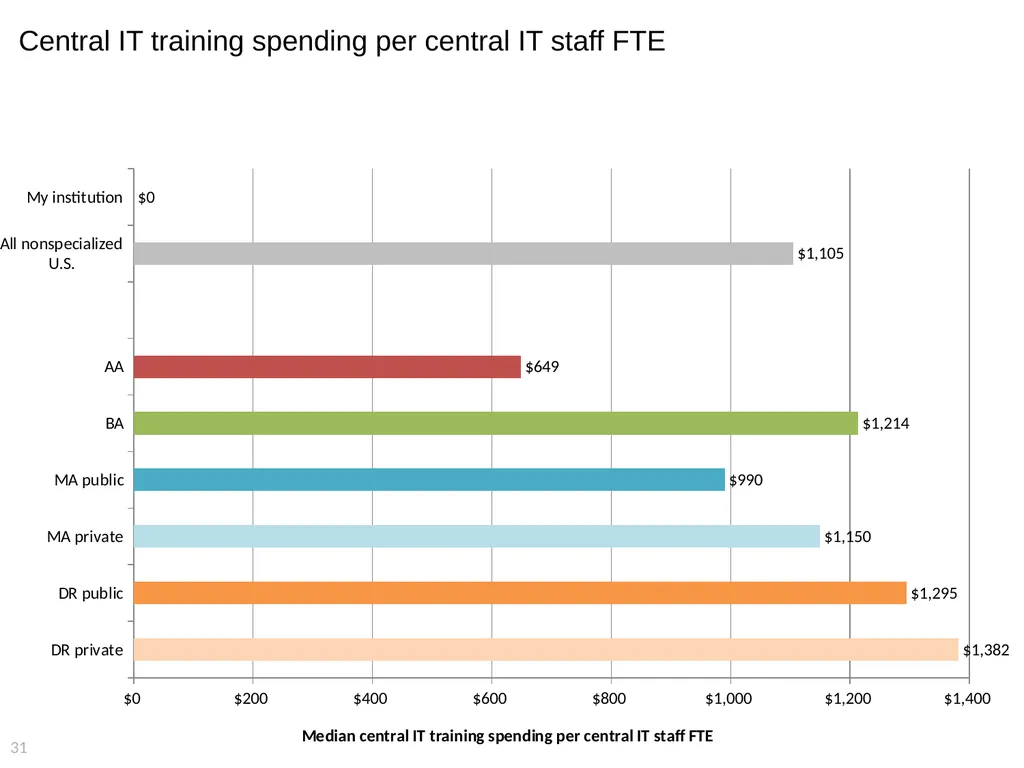
$1,105 Central IT training spending per central IT staff FTE
IT Services
78% Institutions offering tier 2/level 2 service or higher for central IT help desk
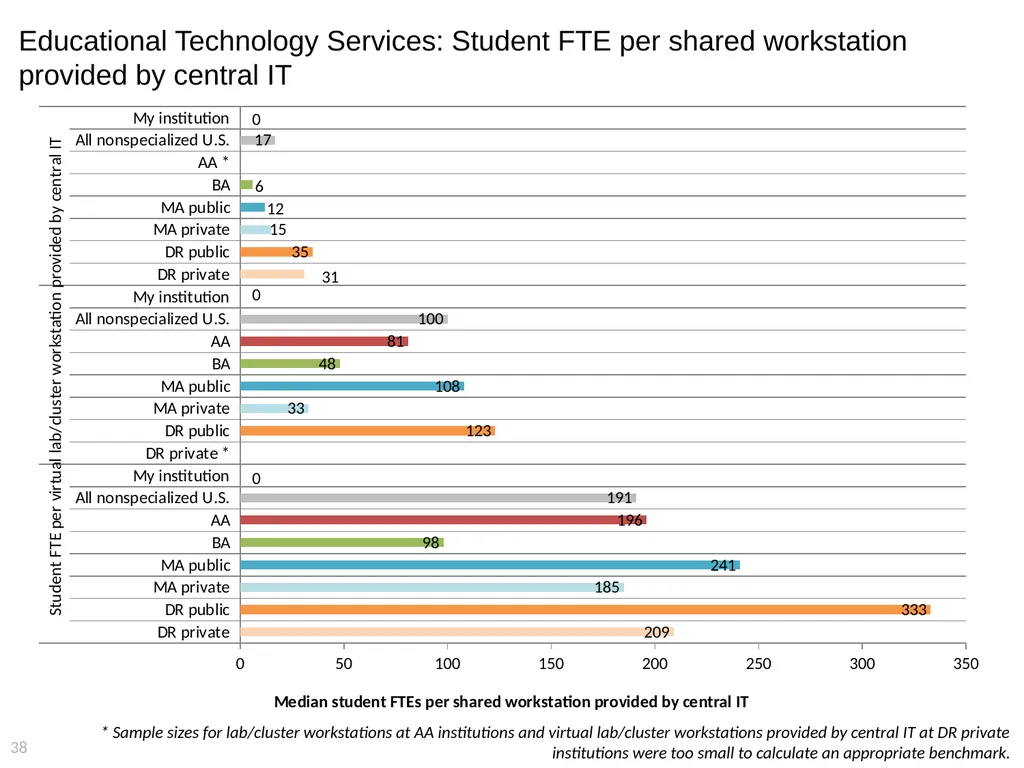
17 Student FTEs per lab/cluster workstations provided by central IT
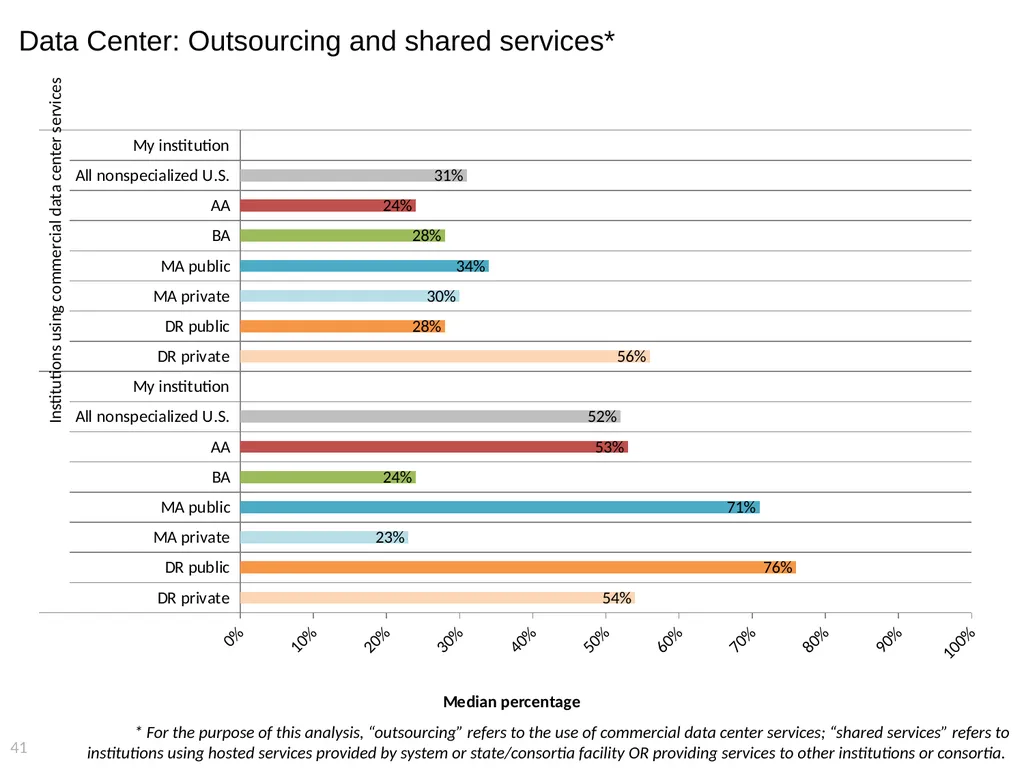
52% Institutions hosting or participating in cross-institutional data center services
64% Access points that are 802.11n
74% Institutions with mandatory information security training for faculty or staff
26% Institutions planning to replace customer relationship management (CRM) systems in the next three years. 11<br>
12
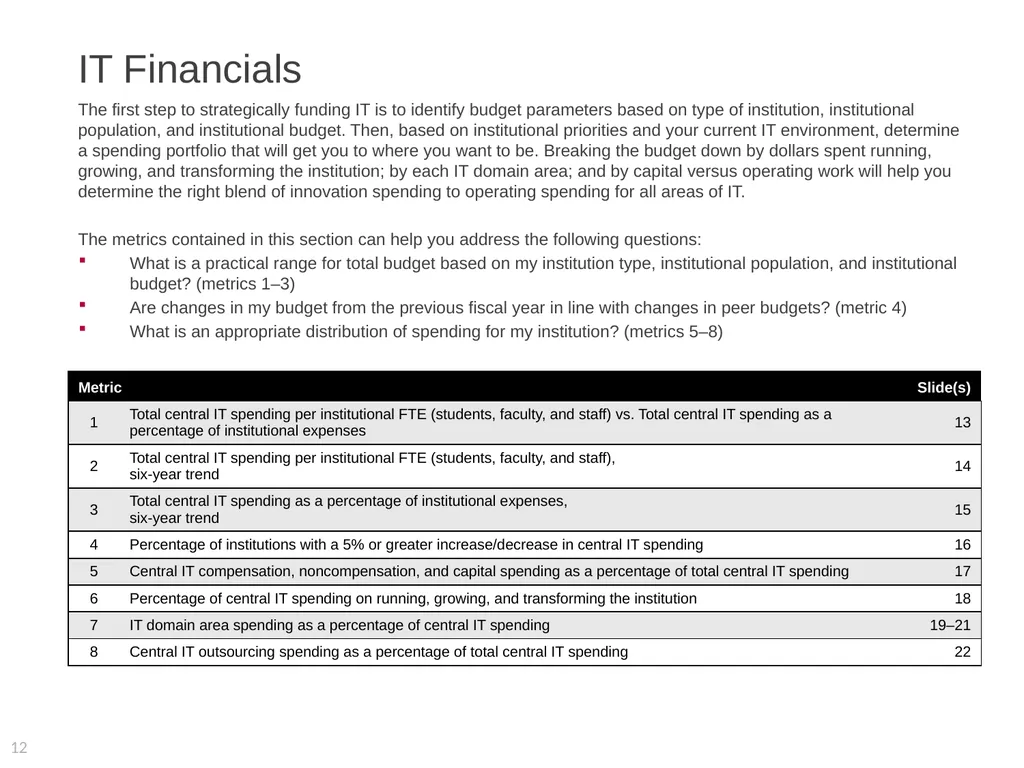
IT Financials The first step to strategically funding IT is to identify budget parameters based on type of institution, institutional population, and institutional budget. Then, based on institutional priorities and your current IT environment, determine a spending portfolio that will get you to where you want to be. Breaking the budget down by dollars spent running, growing, and transforming the institution; by each IT domain area; and by capital versus operating work will help you determine the right blend of innovation spending to operating spending for all areas of IT.
The metrics contained in this section can help you address the following questions:
What is a practical range for total budget based on my institution type, institutional population, and institutional budget? (metrics 1–3)
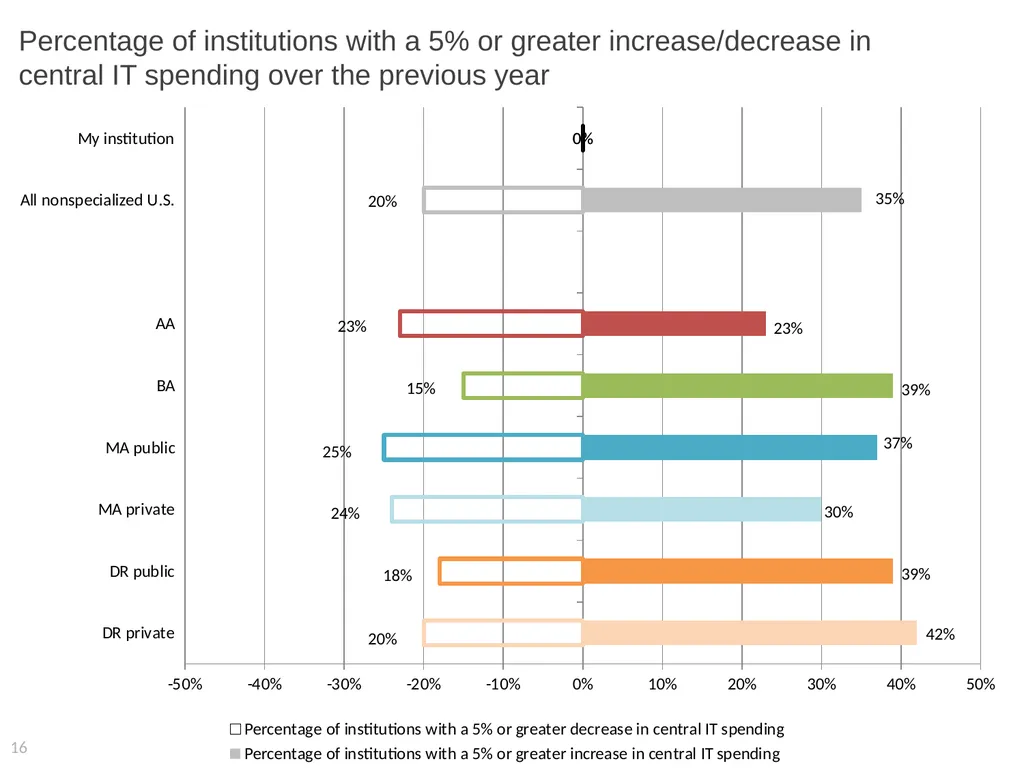
Are changes in my budget from the previous fiscal year in line with changes in peer budgets? (metric 4)
What is an appropriate distribution of spending for my institution? (metrics 5–8) 12<br>
The metrics contained in this section can help you address the following questions:
What is a practical range for total budget based on my institution type, institutional population, and institutional budget? (metrics 1–3)
Are changes in my budget from the previous fiscal year in line with changes in peer budgets? (metric 4)
What is an appropriate distribution of spending for my institution? (metrics 5–8) 12<br>
13
Total central IT spending per institutional FTE (students, faculty, and staff)
vs. total central IT spending as a percentage of institutional expenses 13<br>
14
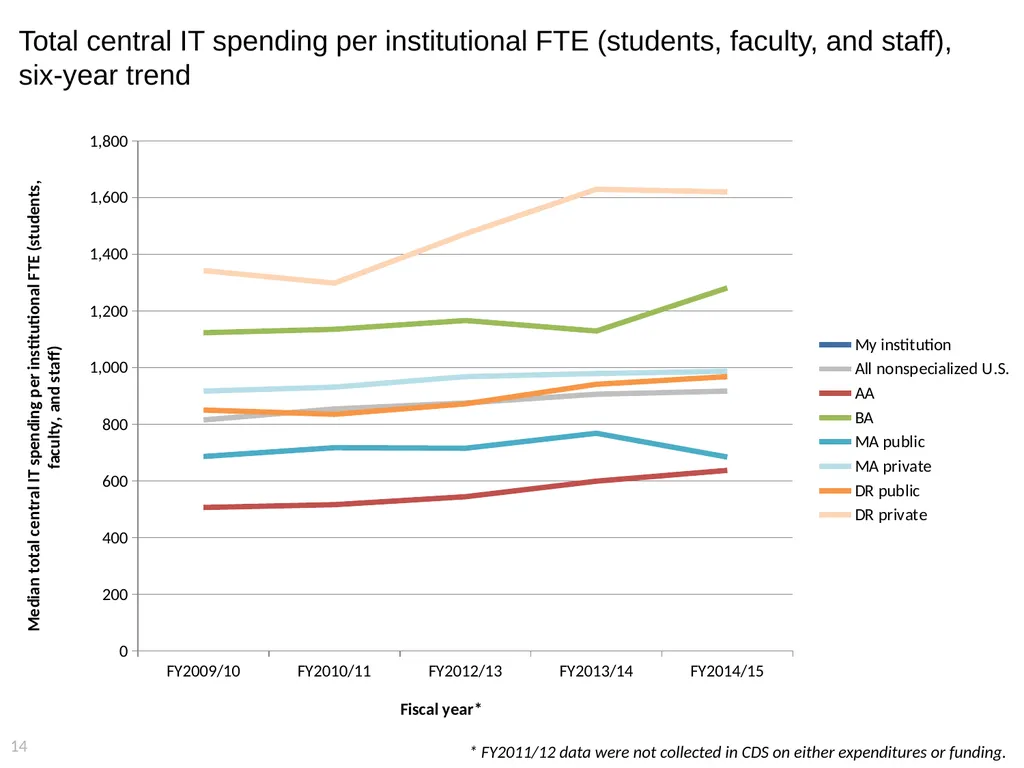
Total central IT spending per institutional FTE (students, faculty, and staff),
six-year trend 14 * FY2011/12 data were not collected in CDS on either expenditures or funding.<br>
15
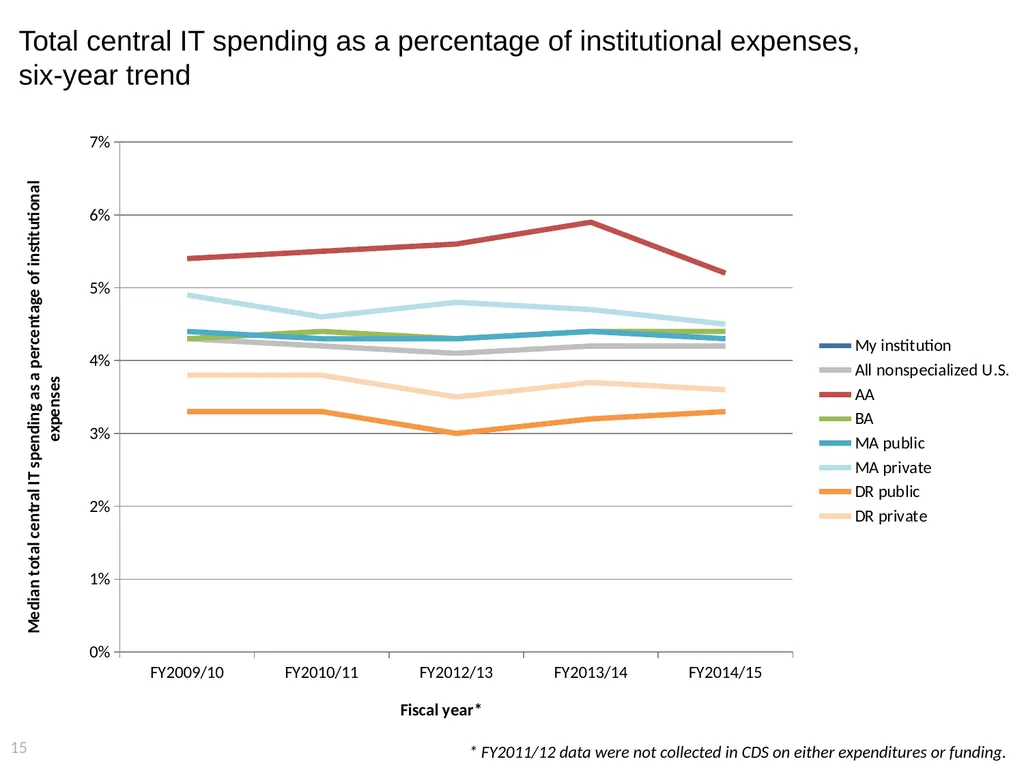
Total central IT spending as a percentage of institutional expenses,
six-year trend 15 * FY2011/12 data were not collected in CDS on either expenditures or funding.<br>
16
Percentage of institutions with a 5% or greater increase/decrease in central IT spending over the previous year 16<br>
17
Central IT compensation, noncompensation, and capital spending as a percentage of total central IT spending 17<br>
18
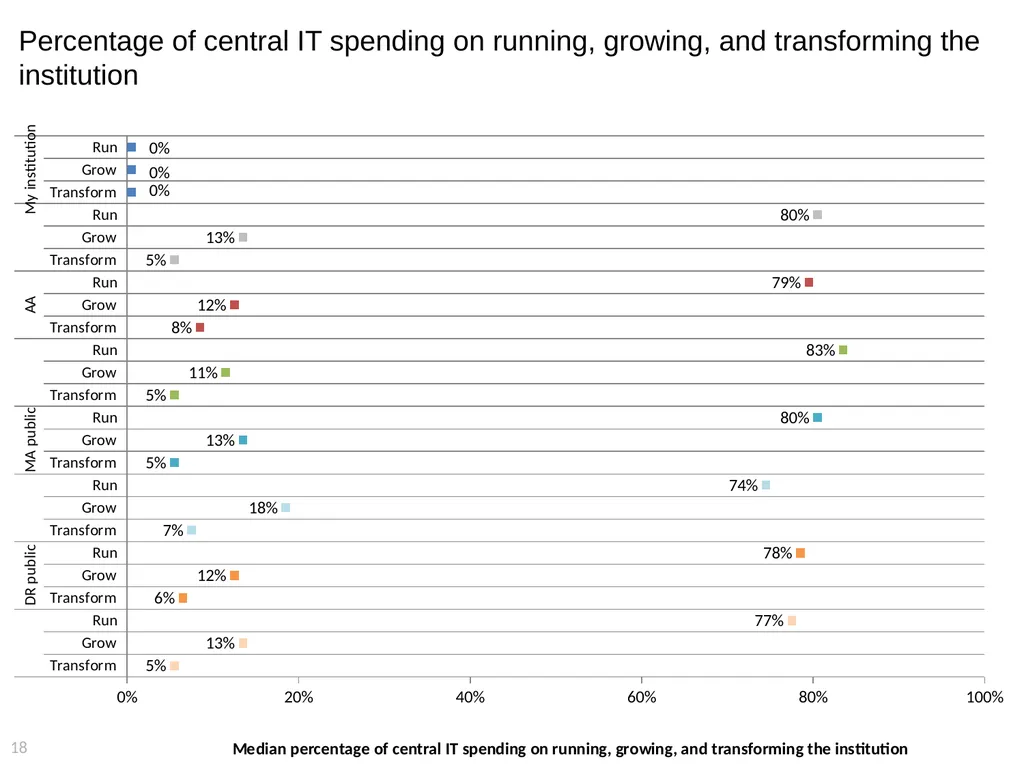
Percentage of central IT spending on running, growing, and transforming the institution 18<br>
19
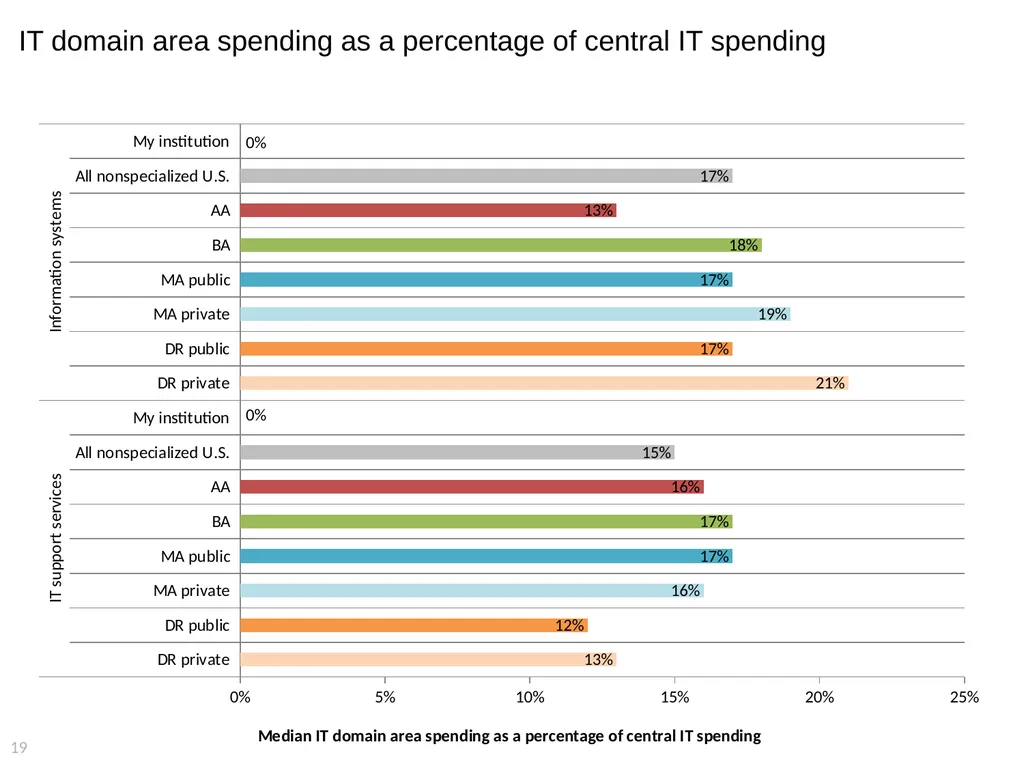
IT domain area spending as a percentage of central IT spending 19<br>
20
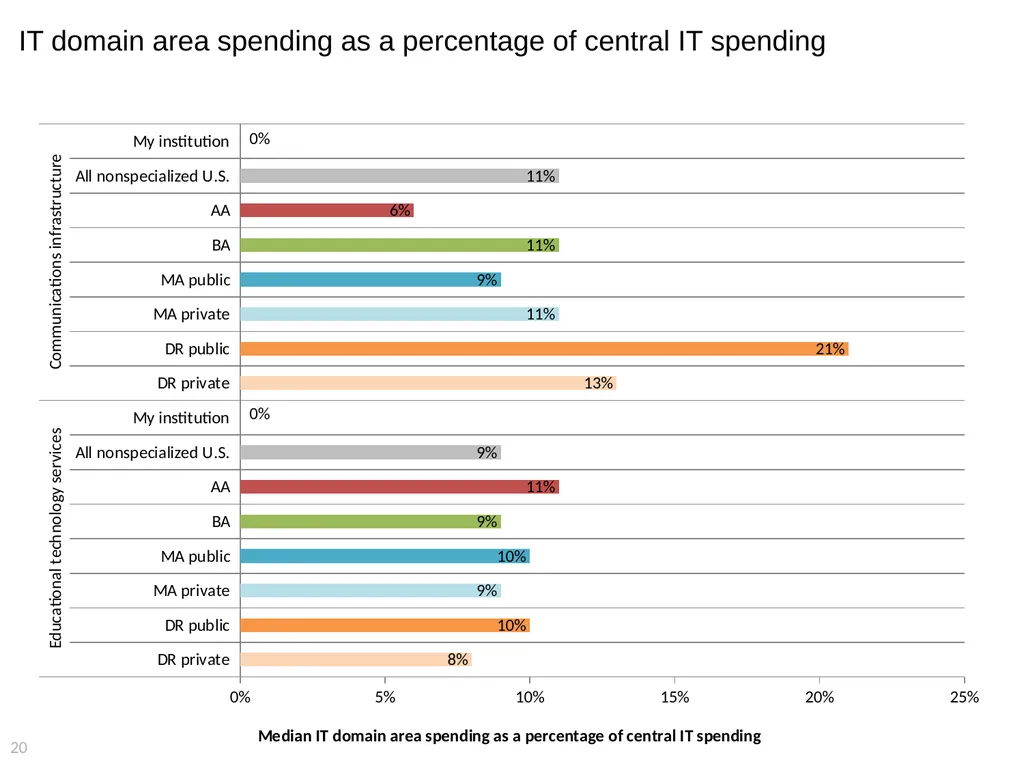
IT domain area spending as a percentage of central IT spending 20<br>
21
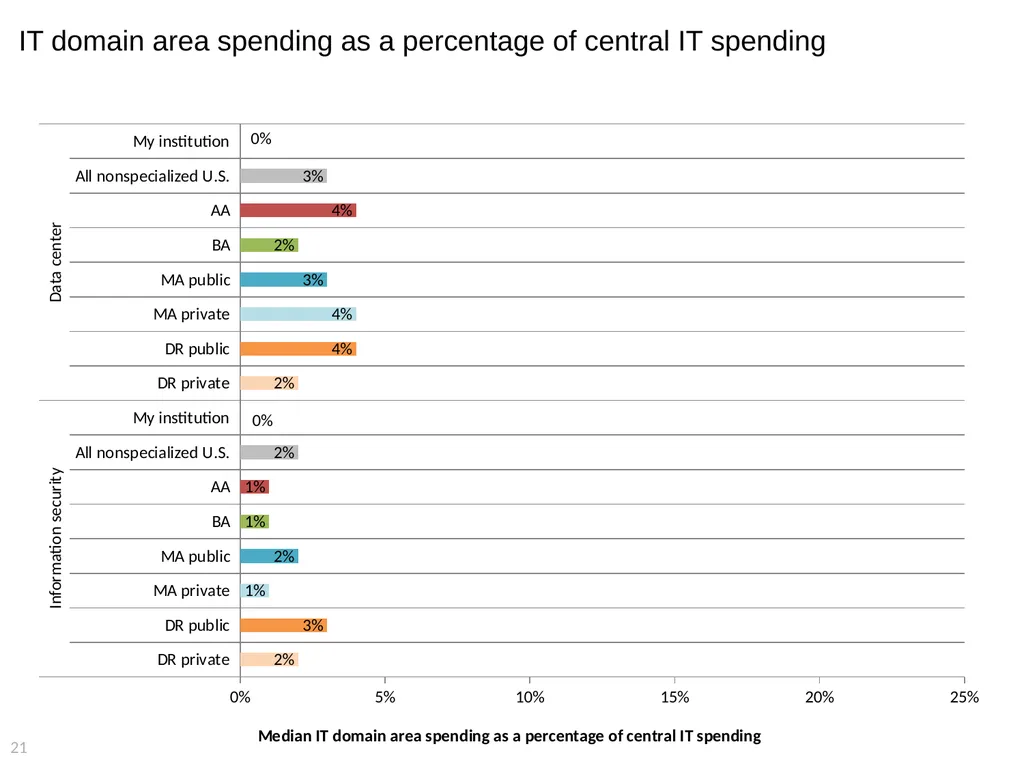
IT domain area spending as a percentage of central IT spending 21<br>
22
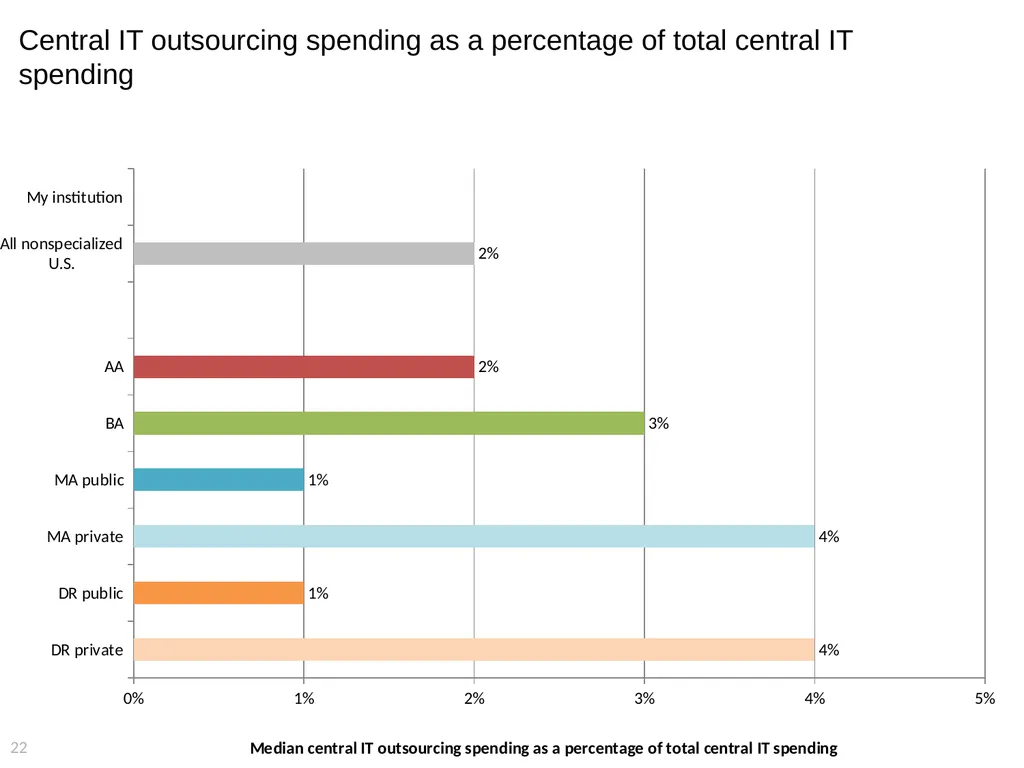
Central IT outsourcing spending as a percentage of total central IT spending 22<br>
23
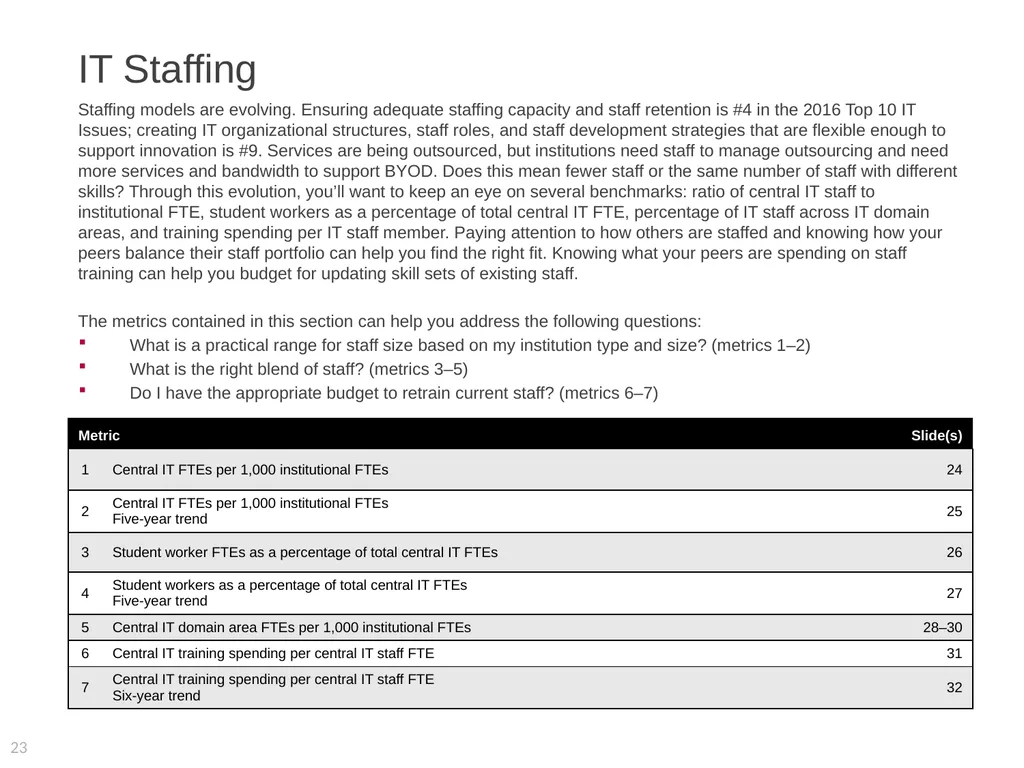
IT Staffing Staffing models are evolving. Ensuring adequate staffing capacity and staff retention is #4 in the 2016 Top 10 IT Issues; creating IT organizational structures, staff roles, and staff development strategies that are flexible enough to support innovation is #9. Services are being outsourced, but institutions need staff to manage outsourcing and need more services and bandwidth to support BYOD. Does this mean fewer staff or the same number of staff with different skills? Through this evolution, you’ll want to keep an eye on several benchmarks: ratio of central IT staff to institutional FTE, student workers as a percentage of total central IT FTE, percentage of IT staff across IT domain areas, and training spending per IT staff member. Paying attention to how others are staffed and knowing how your peers balance their staff portfolio can help you find the right fit. Knowing what your peers are spending on staff training can help you budget for updating skill sets of existing staff.
The metrics contained in this section can help you address the following questions:
What is a practical range for staff size based on my institution type and size? (metrics 1–2)
What is the right blend of staff? (metrics 3–5)
Do I have the appropriate budget to retrain current staff? (metrics 6–7) 23<br>
The metrics contained in this section can help you address the following questions:
What is a practical range for staff size based on my institution type and size? (metrics 1–2)
What is the right blend of staff? (metrics 3–5)
Do I have the appropriate budget to retrain current staff? (metrics 6–7) 23<br>
24
Central IT FTEs per 1,000 institutional FTEs 24<br>
25
Central IT FTEs per 1,000 institutional FTEs,
five-year trend 25<br>
26
Student worker FTEs as a percentage of total central IT FTEs 26<br>
27
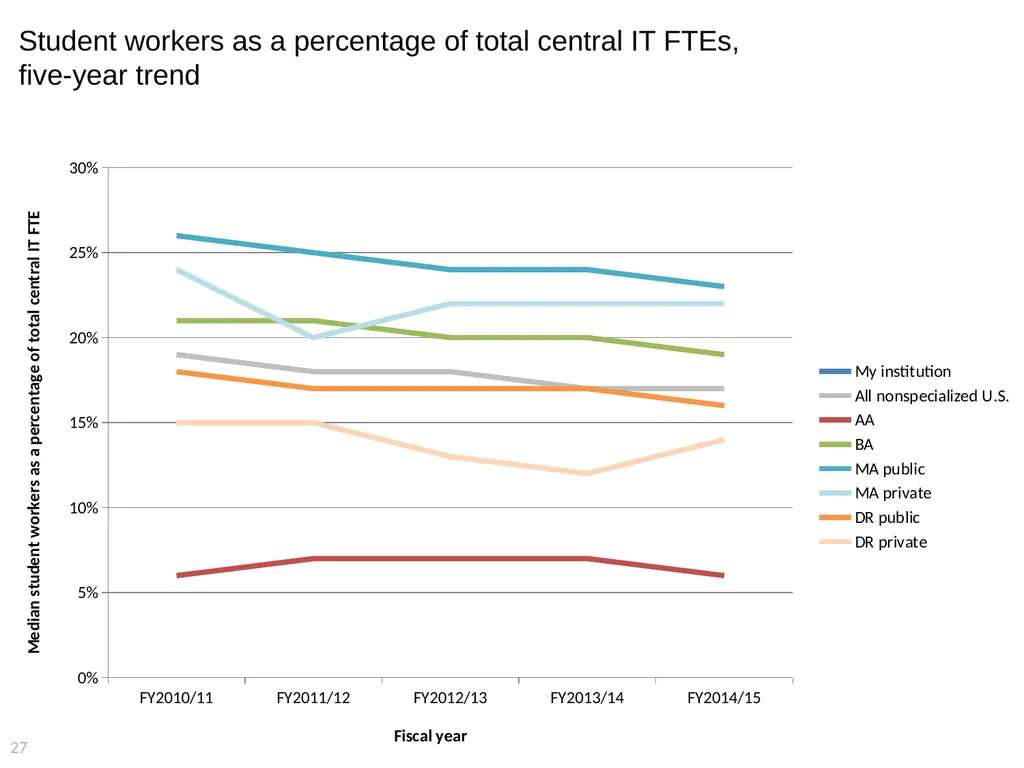
Student workers as a percentage of total central IT FTEs,
five-year trend 27<br>
28
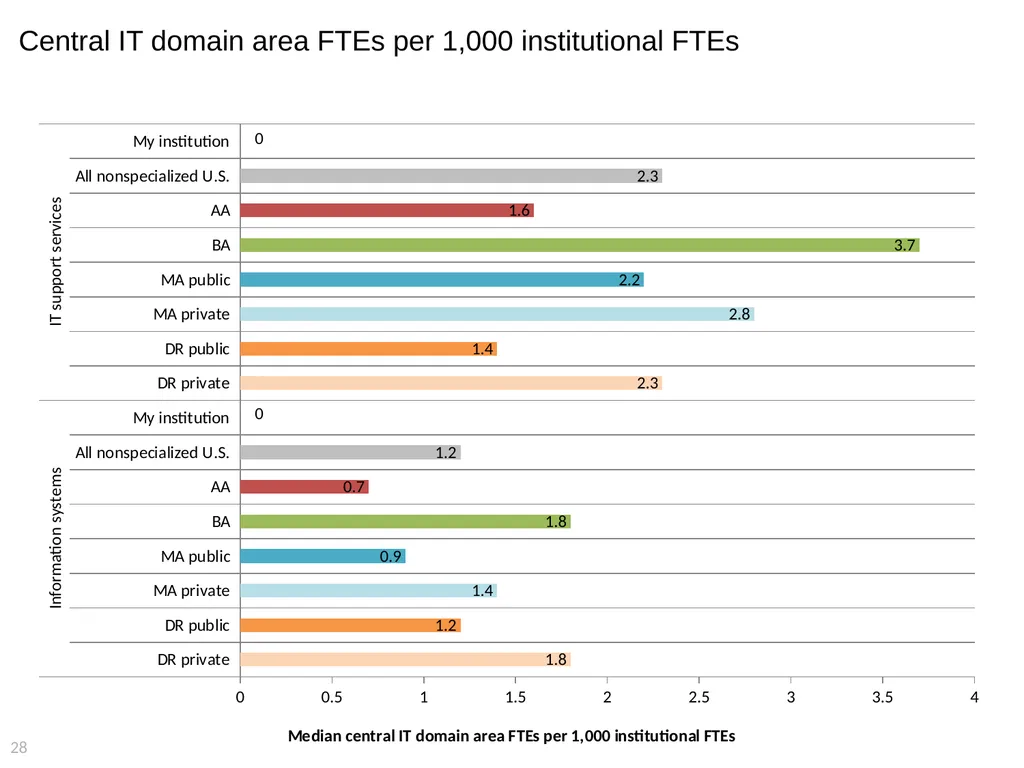
Central IT domain area FTEs per 1,000 institutional FTEs 28<br>
29
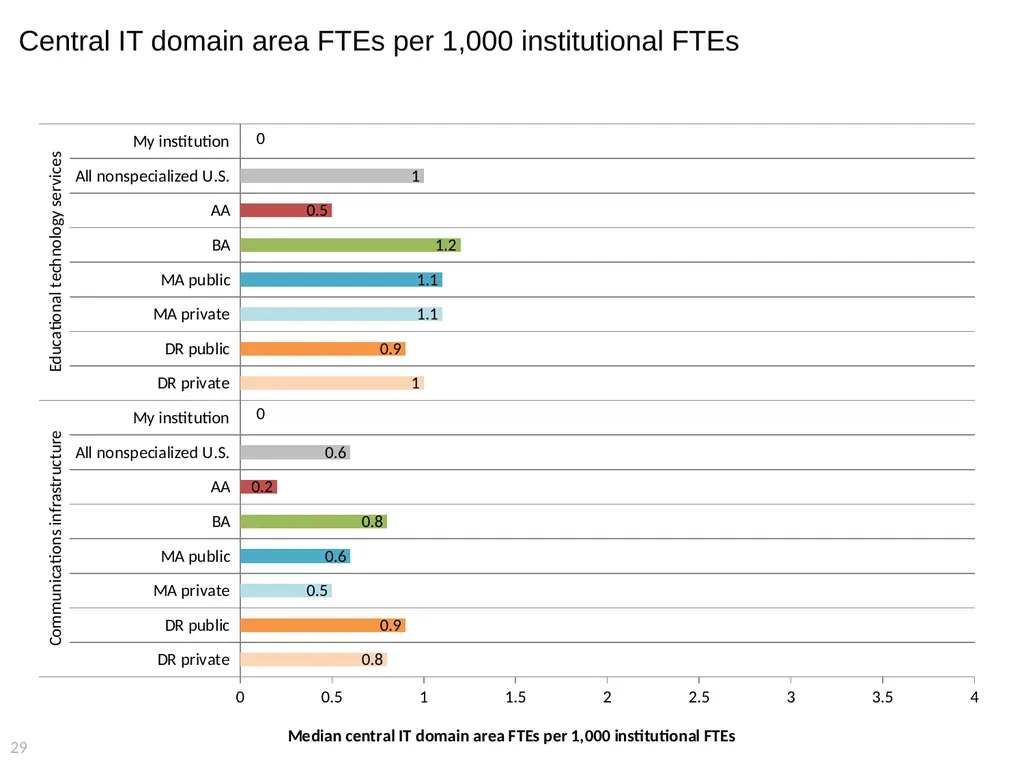
Central IT domain area FTEs per 1,000 institutional FTEs 29<br>
30
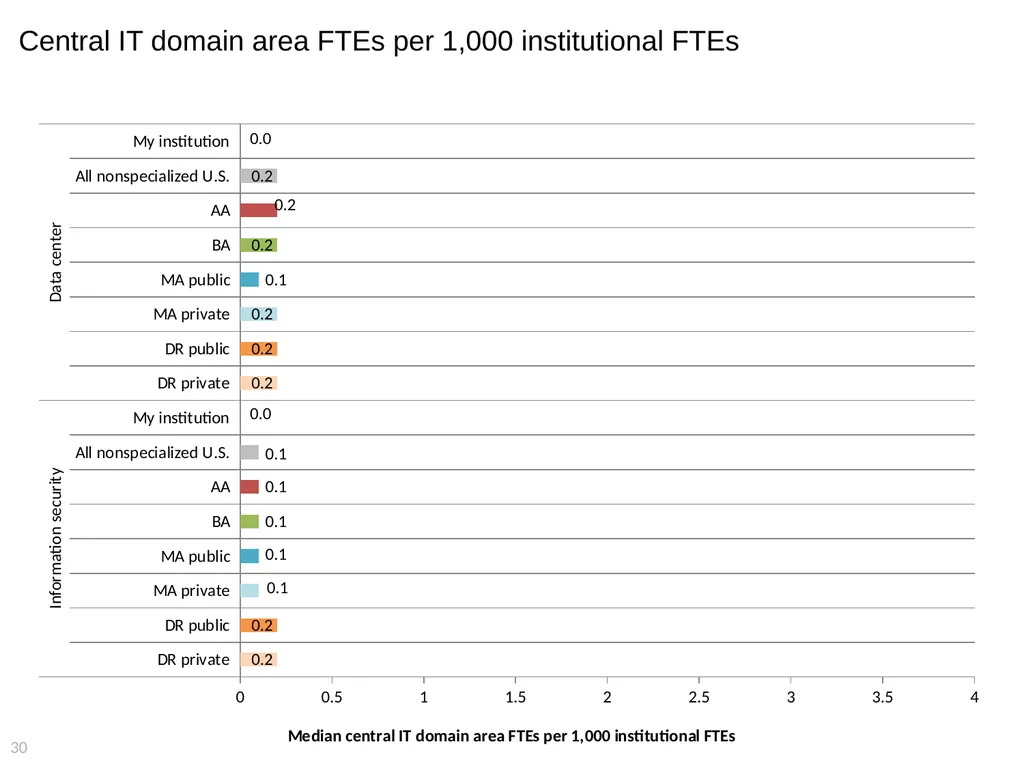
Central IT domain area FTEs per 1,000 institutional FTEs 30<br>
31
Central IT training spending per central IT staff FTE 31<br>
32
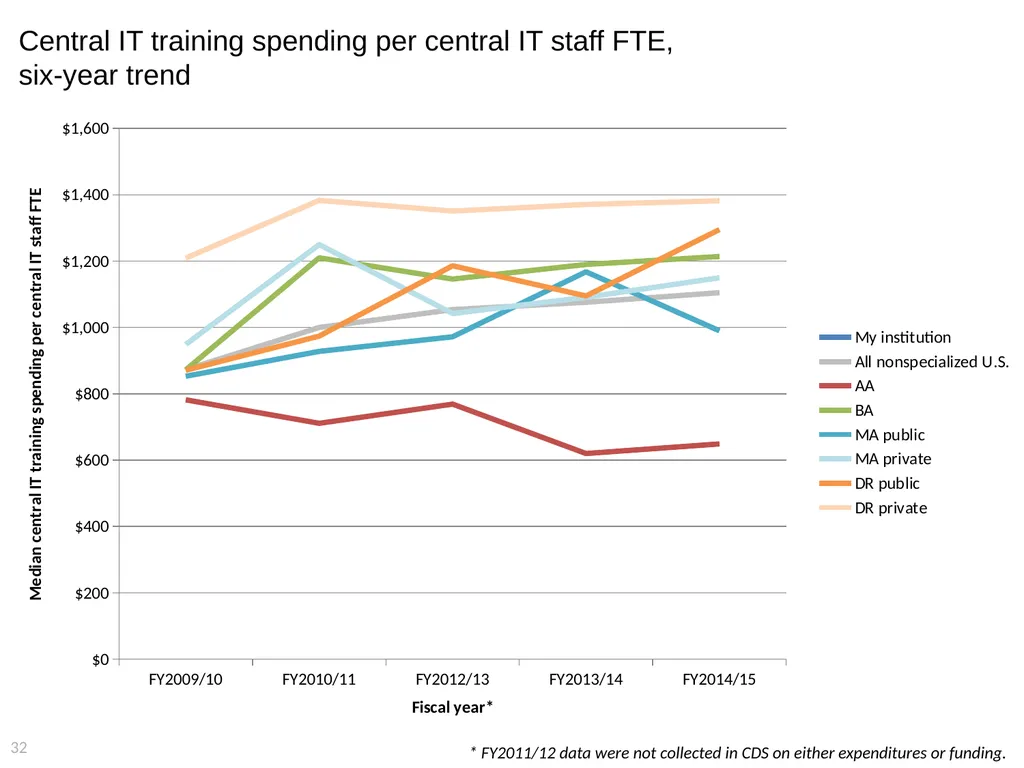
Central IT training spending per central IT staff FTE,
six-year trend 32 * FY2011/12 data were not collected in CDS on either expenditures or funding.<br>
33
IT Services In a changing environment, it is important to know which services are in demand and which are fading in importance; which should stay local and which can be outsourced; and which must have mobile deployment or be accessible via the cloud. It’s important to provide the right services in the most efficient manner. CDS has data that can help you understand how your peers are supporting users in mobile computing, online education, cloud, and BYOD environments. CDS data on faculty support services can help you determine how to help your faculty optimize the use of technology in teaching and learning, and data (including vendor/product, deployment, and management strategy) on 50 different information systems can help you strategize for an enterprise architecture that is right for you.
The metrics contained in this section can help you address the following questions:
What services should I provide?
How should I provide those services?
How can I evaluate service efficiency or effectiveness? 33<br>
The metrics contained in this section can help you address the following questions:
What services should I provide?
How should I provide those services?
How can I evaluate service efficiency or effectiveness? 33<br>
34
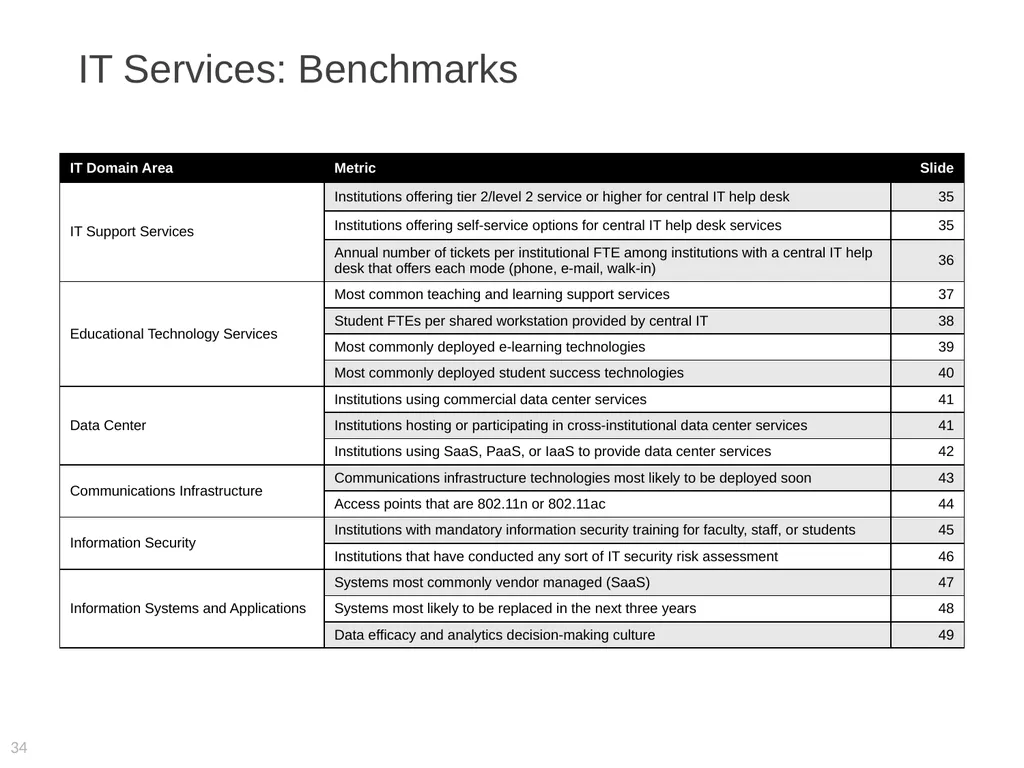
34 IT Services: Benchmarks<br>
35
IT Support Services: Service delivery 35<br>
36
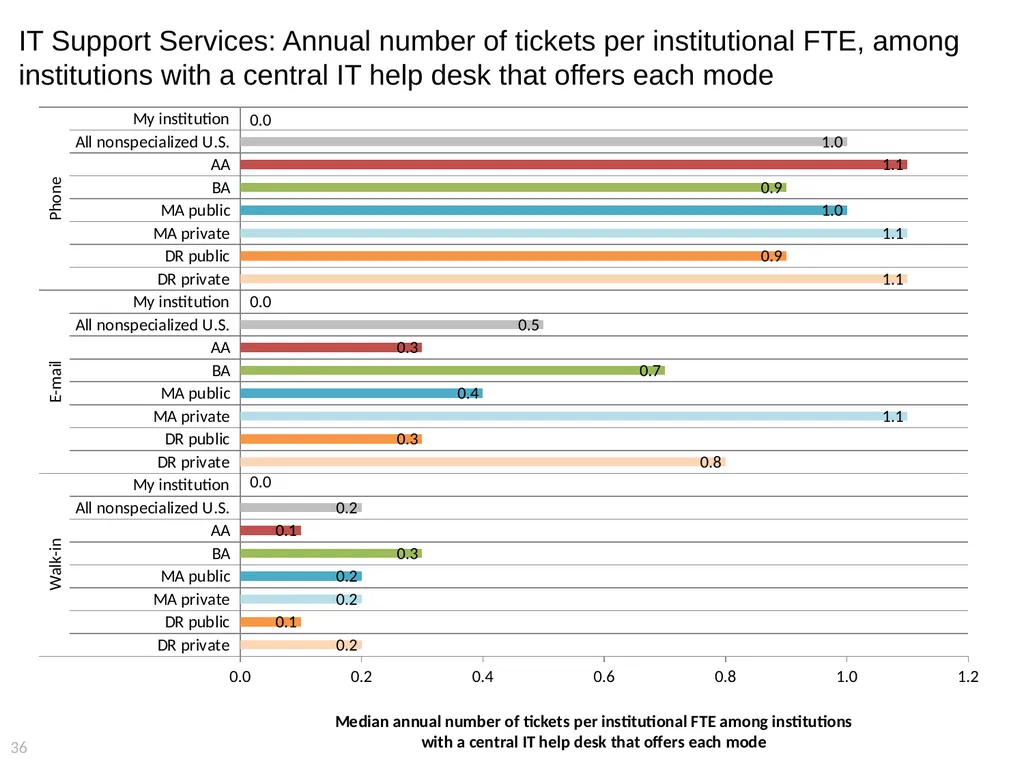
IT Support Services: Annual number of tickets per institutional FTE, among institutions with a central IT help desk that offers each mode 36<br>
37
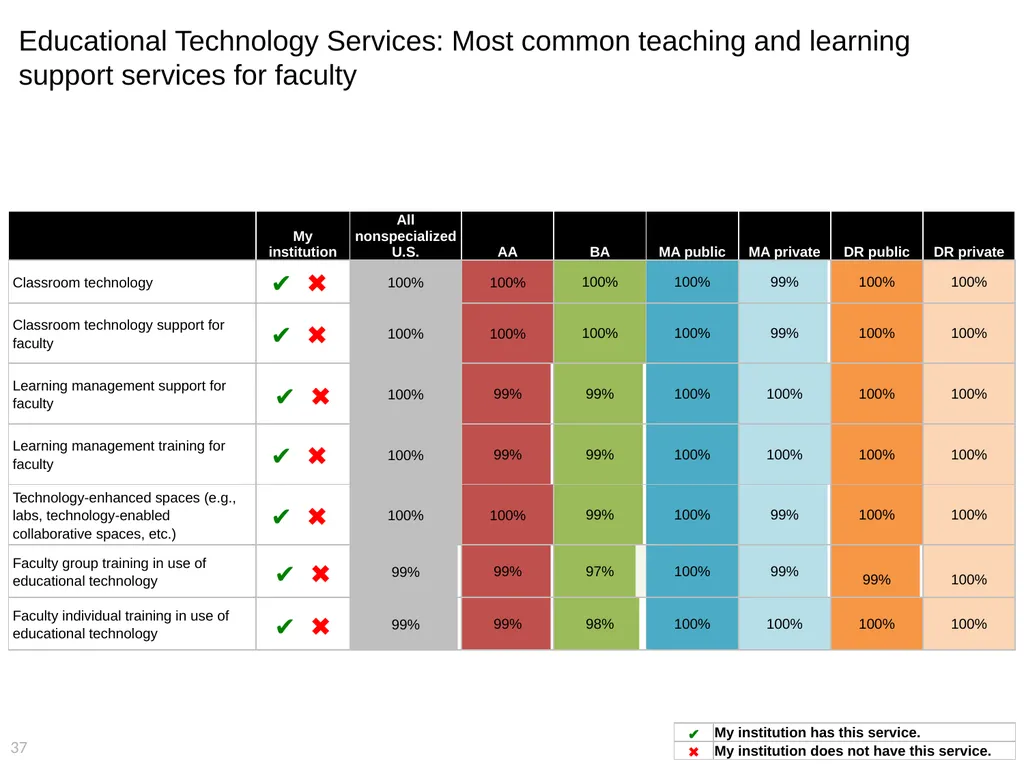
Educational Technology Services: Most common teaching and learning support services for faculty 37<br>
38
Educational Technology Services: Student FTE per shared workstation provided by central IT 38 * Sample sizes for lab/cluster workstations at AA institutions and virtual lab/cluster workstations provided by central IT at DR private institutions were too small to calculate an appropriate benchmark.<br>
39
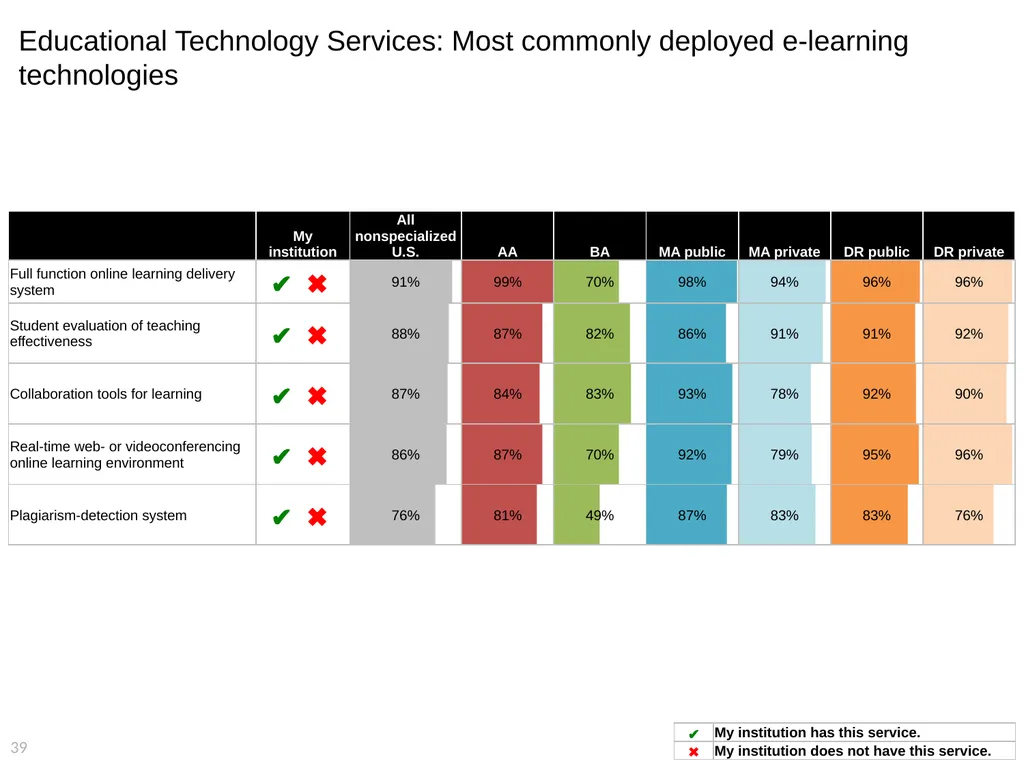
Educational Technology Services: Most commonly deployed e-learning technologies 39<br>
40
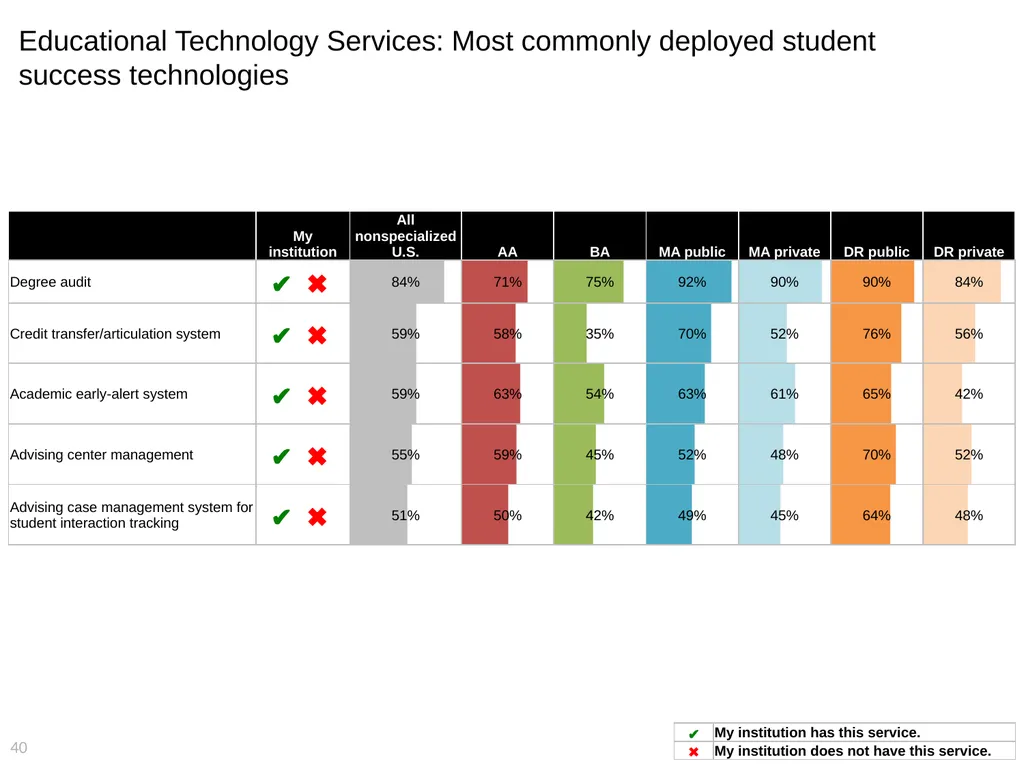
Educational Technology Services: Most commonly deployed student success technologies 40<br>
41
Data Center: Outsourcing and shared services* 41 * For the purpose of this analysis, “outsourcing” refers to the use of commercial data center services; “shared services” refers to institutions using hosted services provided by system or state/consortia facility OR providing services to other institutions or consortia.<br>
42
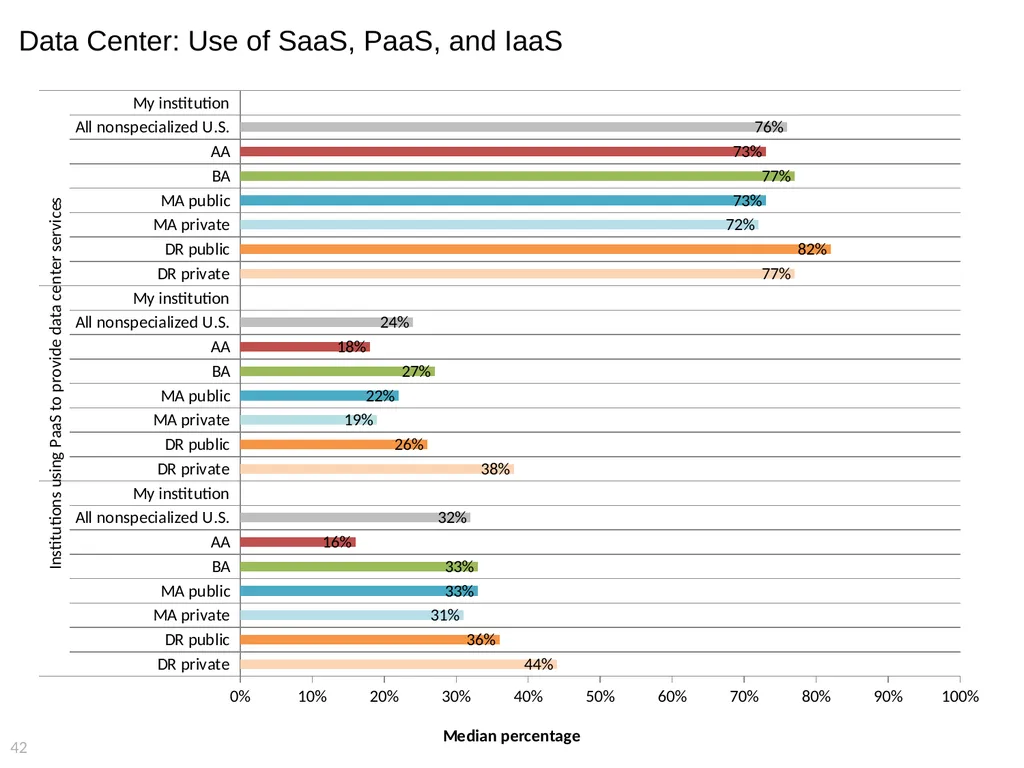
Data Center: Use of SaaS, PaaS, and IaaS 42<br>
43
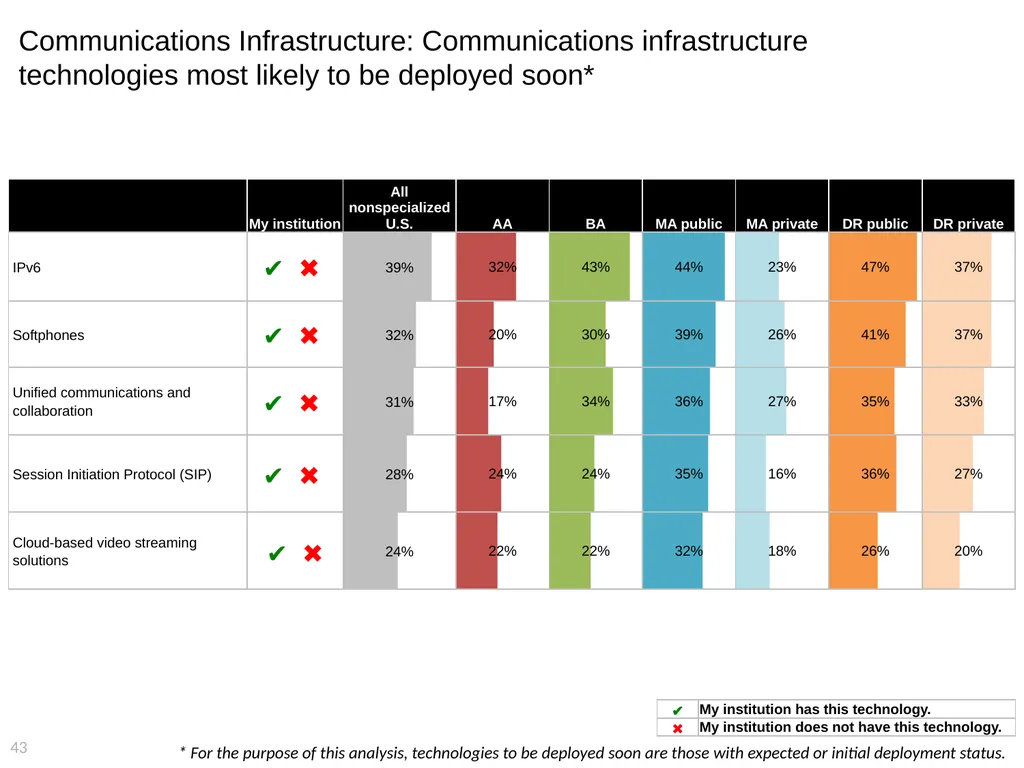
Communications Infrastructure: Communications infrastructure technologies most likely to be deployed soon* 43 * For the purpose of this analysis, technologies to be deployed soon are those with expected or initial deployment status.<br>
44
Communications Infrastructure: Wireless network configuration 44<br>
45
Information Security: Training for faculty, staff, and students 45<br>
46
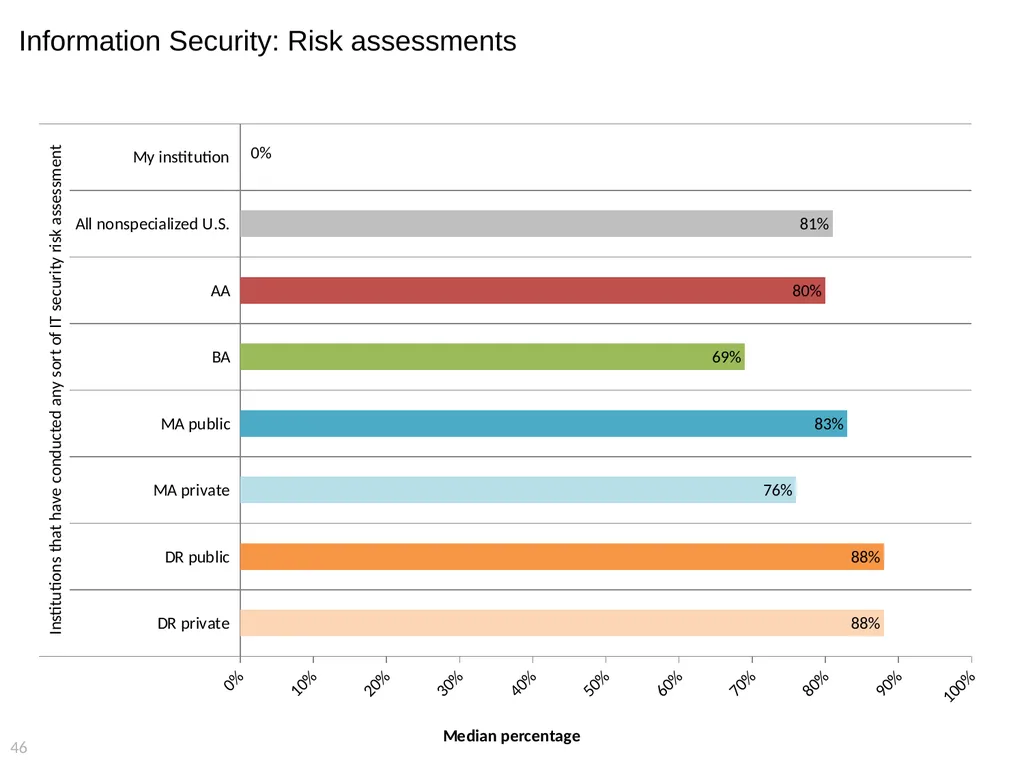
Information Security: Risk assessments 46<br>
47
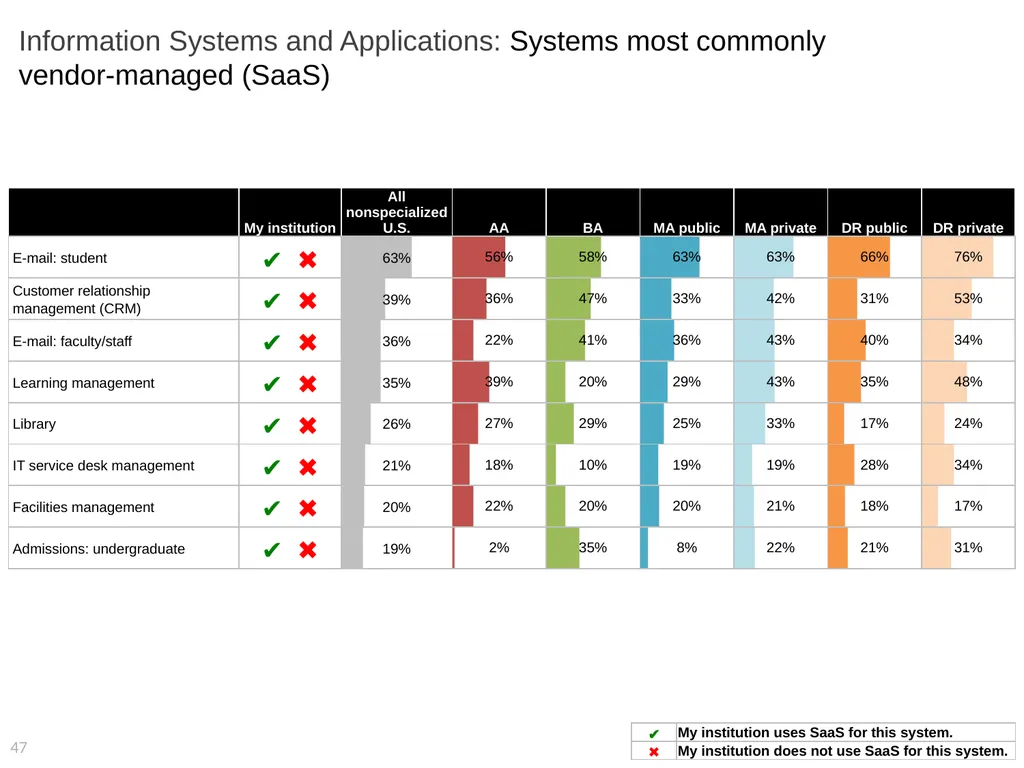
Information Systems and Applications: Systems most commonly
vendor-managed (SaaS) 47<br>
48
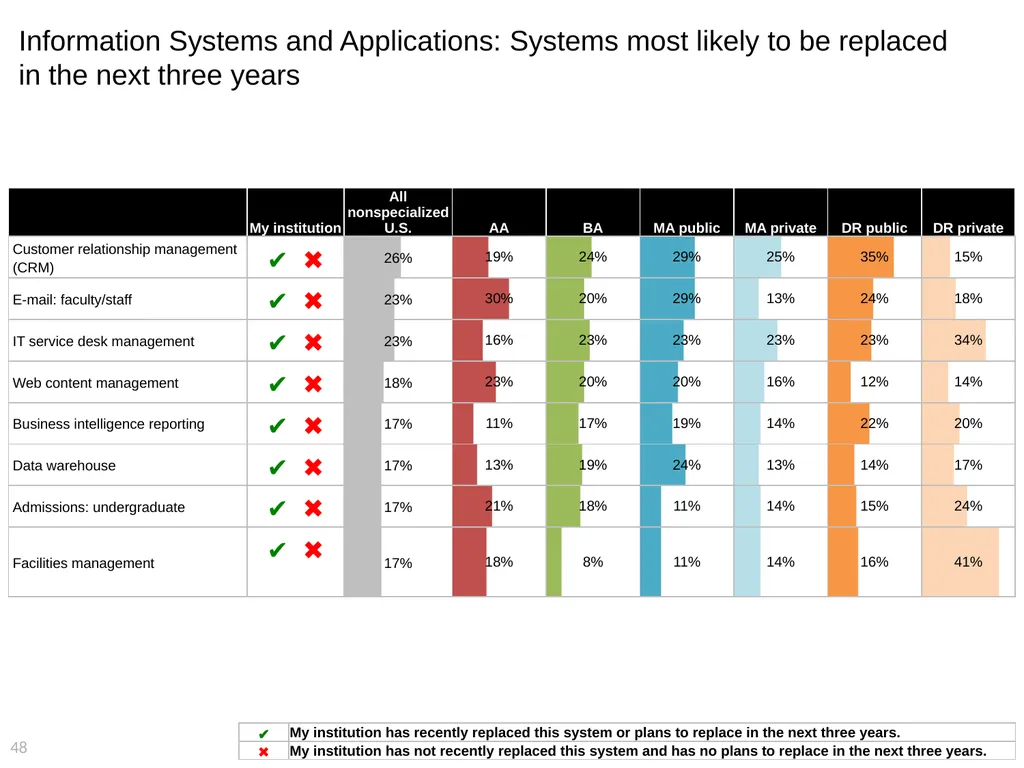
Information Systems and Applications: Systems most likely to be replaced in the next three years 48<br>
49
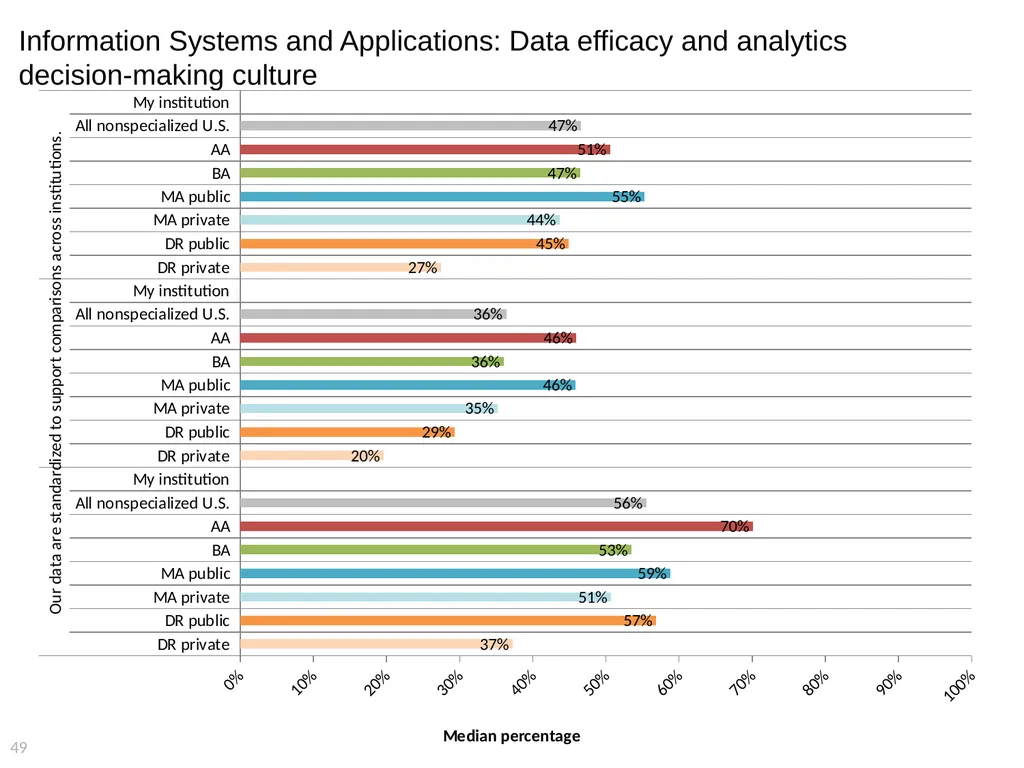
Information Systems and Applications: Data efficacy and analytics decision-making culture 49<br>
50
Methodology<br>
51
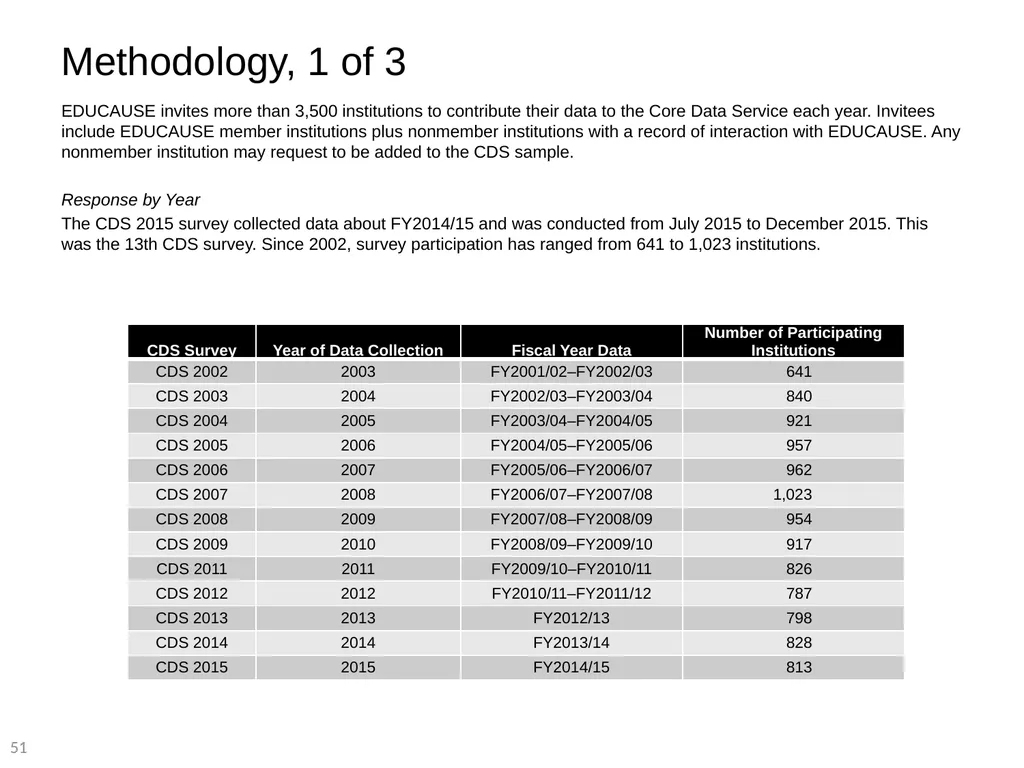
Methodology, 1 of 3 EDUCAUSE invites more than 3,500 institutions to contribute their data to the Core Data Service each year. Invitees include EDUCAUSE member institutions plus nonmember institutions with a record of interaction with EDUCAUSE. Any nonmember institution may request to be added to the CDS sample.
Response by Year
The CDS 2015 survey collected data about FY2014/15 and was conducted from July 2015 to December 2015. This was the 13th CDS survey. Since 2002, survey participation has ranged from 641 to 1,023 institutions.<br>
Response by Year
The CDS 2015 survey collected data about FY2014/15 and was conducted from July 2015 to December 2015. This was the 13th CDS survey. Since 2002, survey participation has ranged from 641 to 1,023 institutions.<br>
52
Methodology, 2 of 3 Response by Carnegie Classification
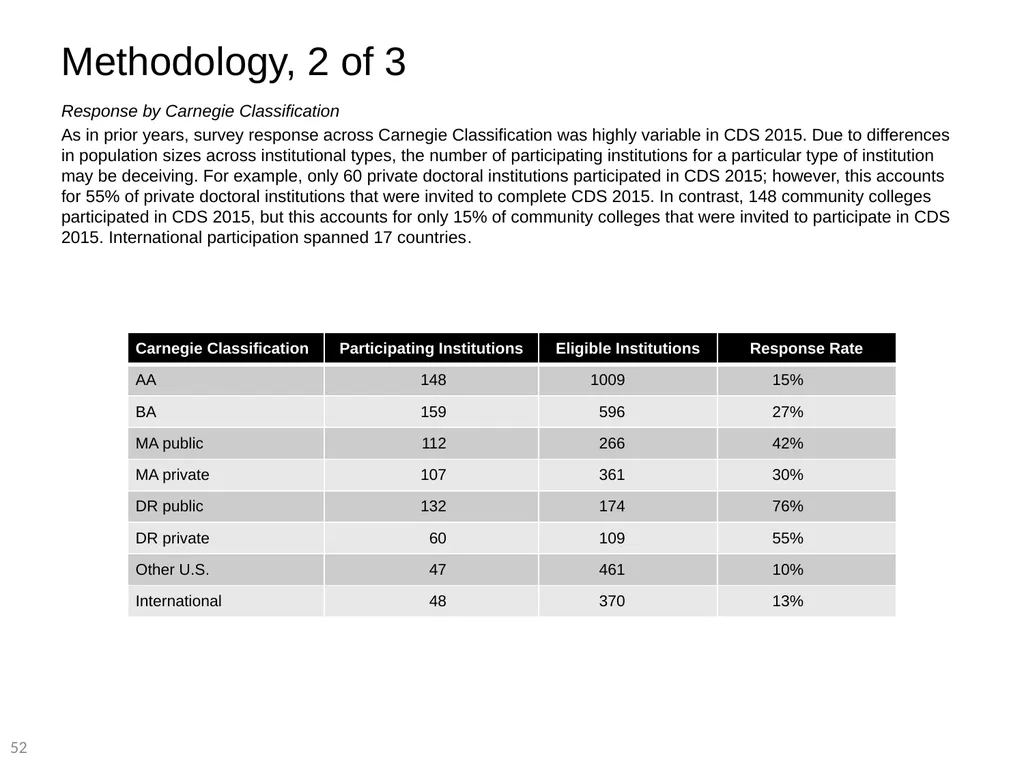
As in prior years, survey response across Carnegie Classification was highly variable in CDS 2015. Due to differences in population sizes across institutional types, the number of participating institutions for a particular type of institution may be deceiving. For example, only 60 private doctoral institutions participated in CDS 2015; however, this accounts for 55% of private doctoral institutions that were invited to complete CDS 2015. In contrast, 148 community colleges participated in CDS 2015, but this accounts for only 15% of community colleges that were invited to participate in CDS 2015. International participation spanned 17 countries.<br>
As in prior years, survey response across Carnegie Classification was highly variable in CDS 2015. Due to differences in population sizes across institutional types, the number of participating institutions for a particular type of institution may be deceiving. For example, only 60 private doctoral institutions participated in CDS 2015; however, this accounts for 55% of private doctoral institutions that were invited to complete CDS 2015. In contrast, 148 community colleges participated in CDS 2015, but this accounts for only 15% of community colleges that were invited to participate in CDS 2015. International participation spanned 17 countries.<br>
53
Methodology, 3 of 3 Response by Module
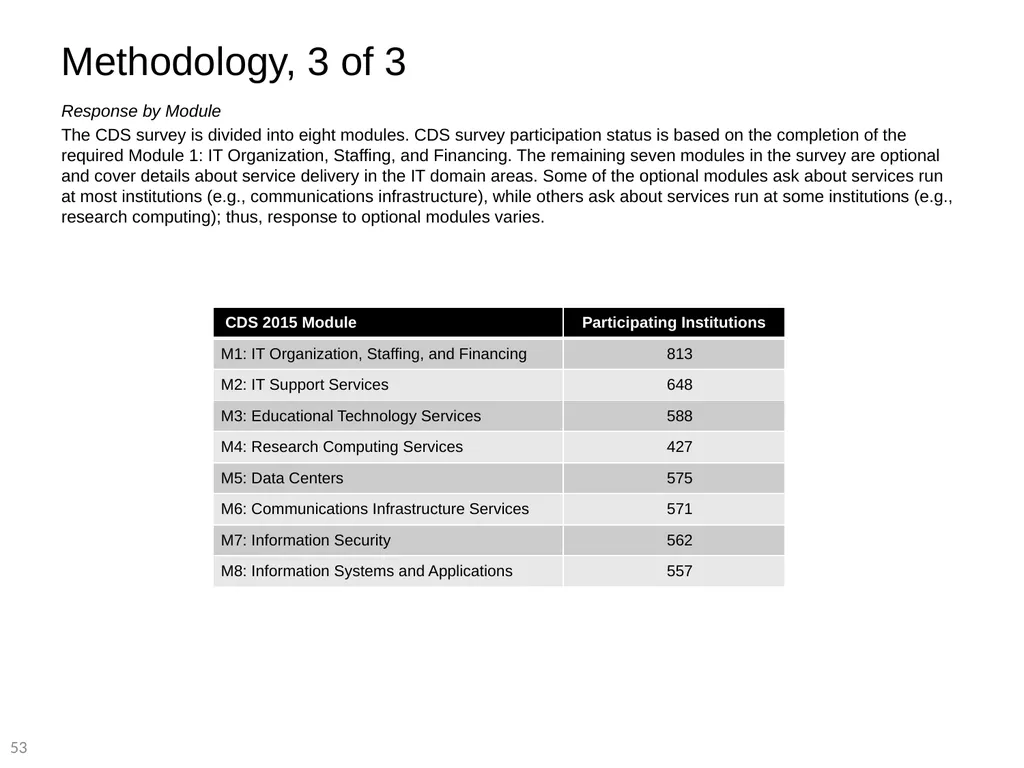
The CDS survey is divided into eight modules. CDS survey participation status is based on the completion of the required Module 1: IT Organization, Staffing, and Financing. The remaining seven modules in the survey are optional and cover details about service delivery in the IT domain areas. Some of the optional modules ask about services run at most institutions (e.g., communications infrastructure), while others ask about services run at some institutions (e.g., research computing); thus, response to optional modules varies.<br>
The CDS survey is divided into eight modules. CDS survey participation status is based on the completion of the required Module 1: IT Organization, Staffing, and Financing. The remaining seven modules in the survey are optional and cover details about service delivery in the IT domain areas. Some of the optional modules ask about services run at most institutions (e.g., communications infrastructure), while others ask about services run at some institutions (e.g., research computing); thus, response to optional modules varies.<br>