A suite of community-contributed programs to produce outcome tables and graphs for demographic and survival data Rachel Pearce British Society of Blood and Marrow Transplantation Guys Hospital Background BSBMT is an organisation for
"A suite of community-contributed programs to" is the property of its rightful owner. Permission is granted to
download and print the materials on this website for personal, non-commercial use only, and to display it
on your personal computer provided you do not modify the materials and that you retain all copyright
notices contained in the materials. By downloading content from our website, you accept the terms of this
agreement.
Presentation Transcript
01
A suite of community-contributed programs to produce outcome tables and graphs for demographic and survival data Rachel Pearce
British Society of Blood and Marrow Transplantation
Guy’s Hospital<br>
02
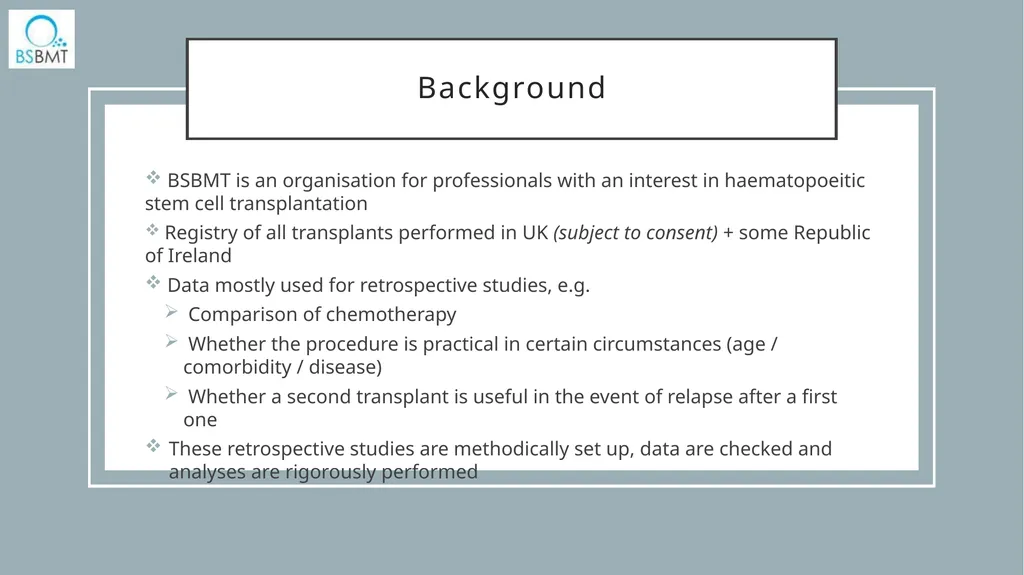
Background BSBMT is an organisation for professionals with an interest in haematopoeitic stem cell transplantation
Registry of all transplants performed in UK (subject to consent) + some Republic of Ireland
Data mostly used for retrospective studies, e.g.
Comparison of chemotherapy
Whether the procedure is practical in certain circumstances (age / comorbidity / disease)
Whether a second transplant is useful in the event of relapse after a first one
These retrospective studies are methodically set up, data are checked and analyses are rigorously performed<br>
03
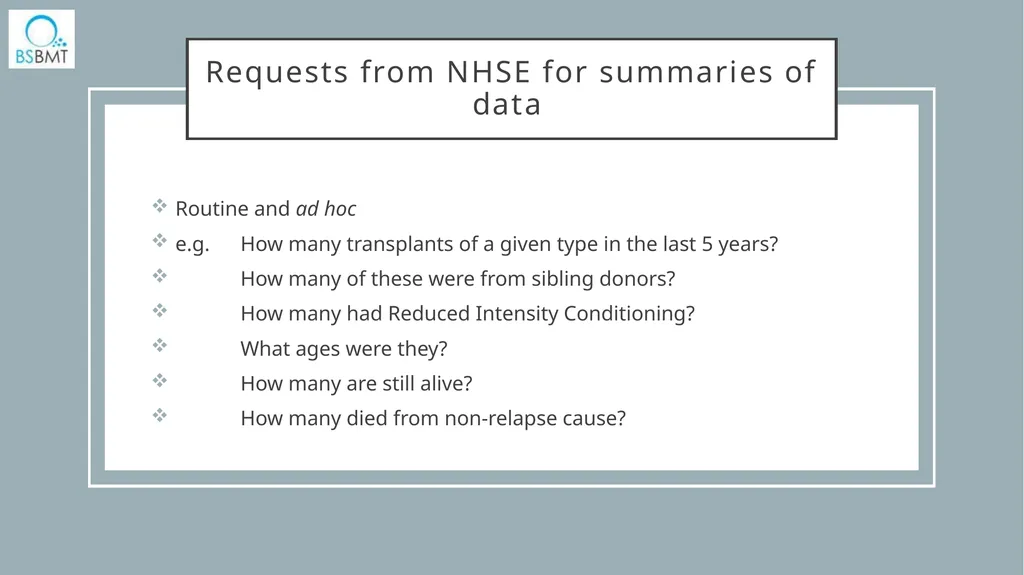
Requests from NHSE for summaries of data Routine and ad hoc
e.g. How many transplants of a given type in the last 5 years?
How many of these were from sibling donors?
How many had Reduced Intensity Conditioning?
What ages were they?
How many are still alive?
How many died from non-relapse cause?<br>
04
Two sorts of programs developed Programs to generate datasets: take Registry data and create summary tables as Stata datasets
Programs to generate outputs: combine these datasets into datasets suitable for output to a Word file via putdocx<br>
05
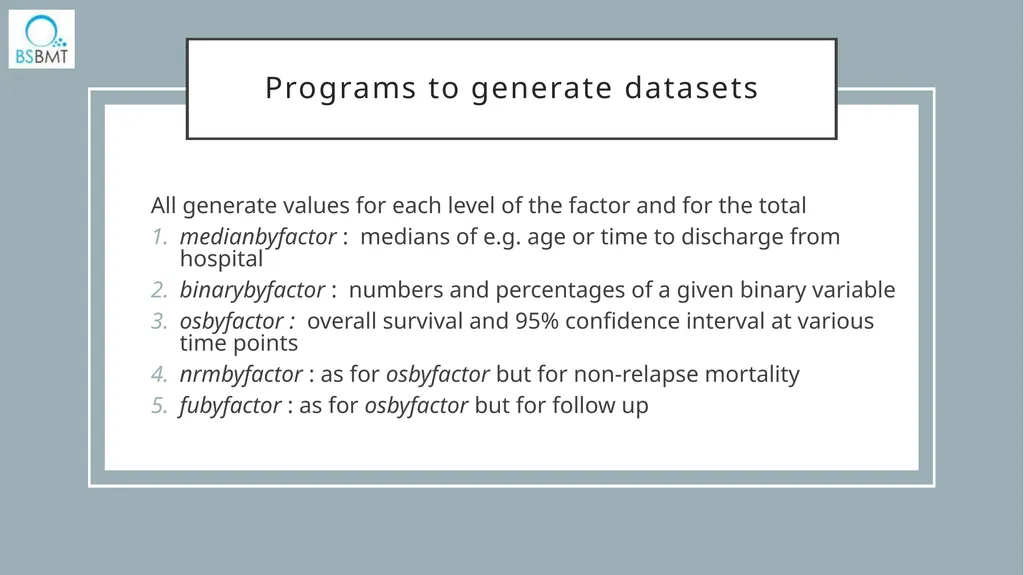
Programs to generate datasets All generate values for each level of the factor and for the total
medianbyfactor : medians of e.g. age or time to discharge from hospital
binarybyfactor : numbers and percentages of a given binary variable
osbyfactor : overall survival and 95% confidence interval at various time points
nrmbyfactor : as for osbyfactor but for non-relapse mortality
fubyfactor : as for osbyfactor but for follow up<br>
06
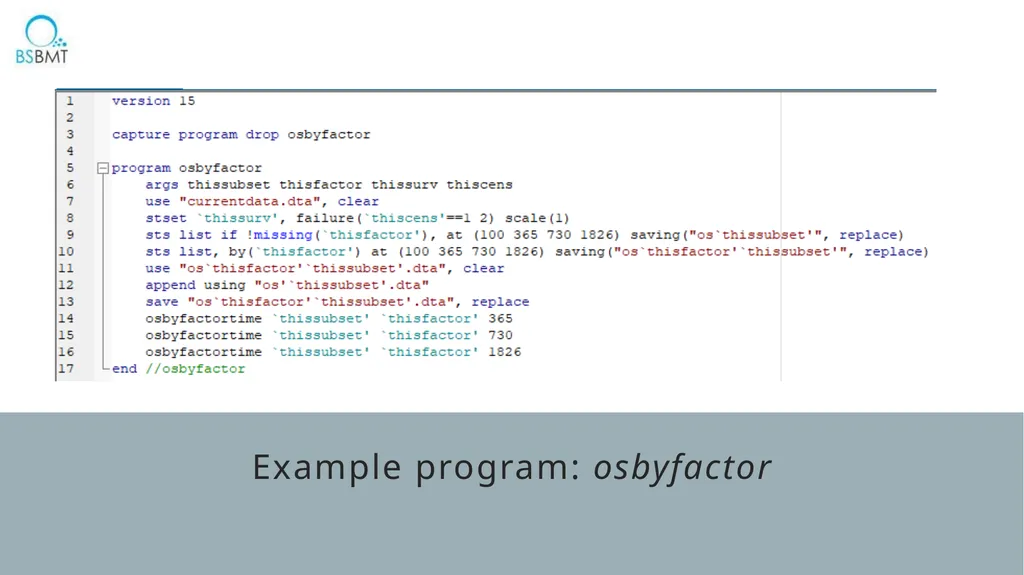
Example program: osbyfactor<br>
07
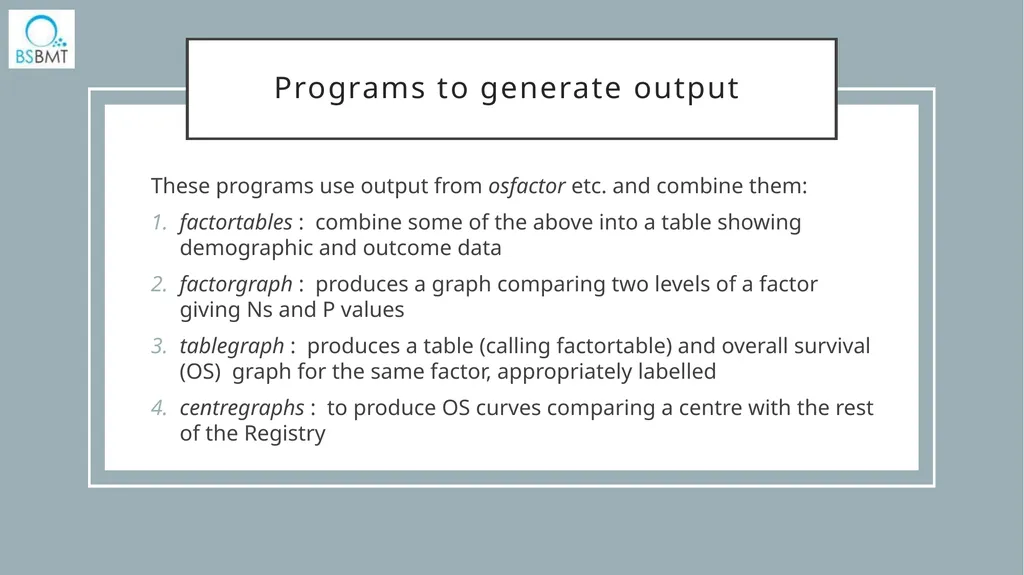
Programs to generate output These programs use output from osfactor etc. and combine them:
factortables : combine some of the above into a table showing demographic and outcome data
factorgraph : produces a graph comparing two levels of a factor giving Ns and P values
tablegraph : produces a table (calling factortable) and overall survival (OS) graph for the same factor, appropriately labelled
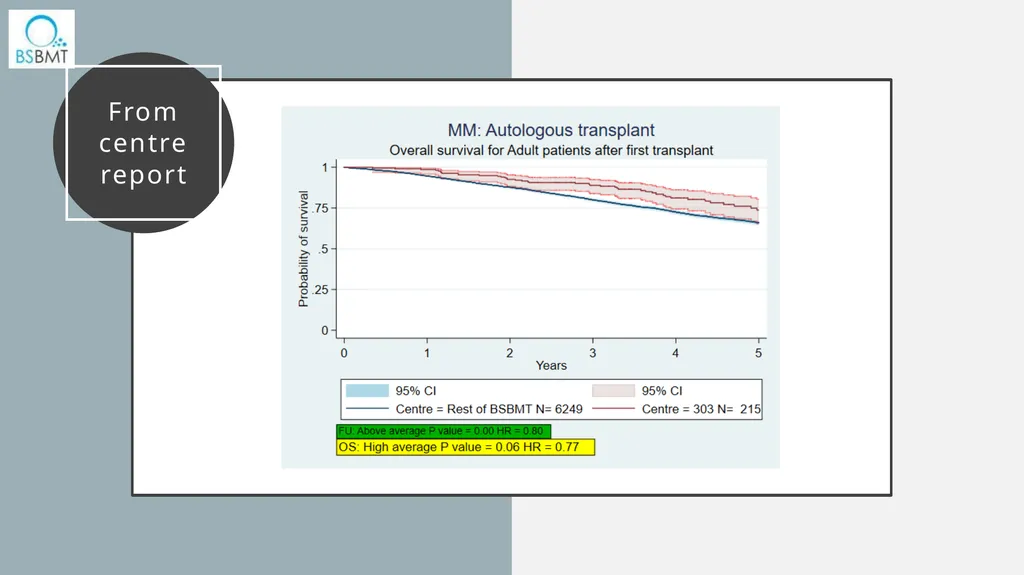
centregraphs : to produce OS curves comparing a centre with the rest of the Registry<br>
08
Example 1: Prospective trial proposed to discover the prognostic value of a particular test
Specific population with a particular diagnosis
Test only recently available; presence of indicator is speculated to have poor prognosis
Trial design to establish this requires estimate of 2y OS in each case
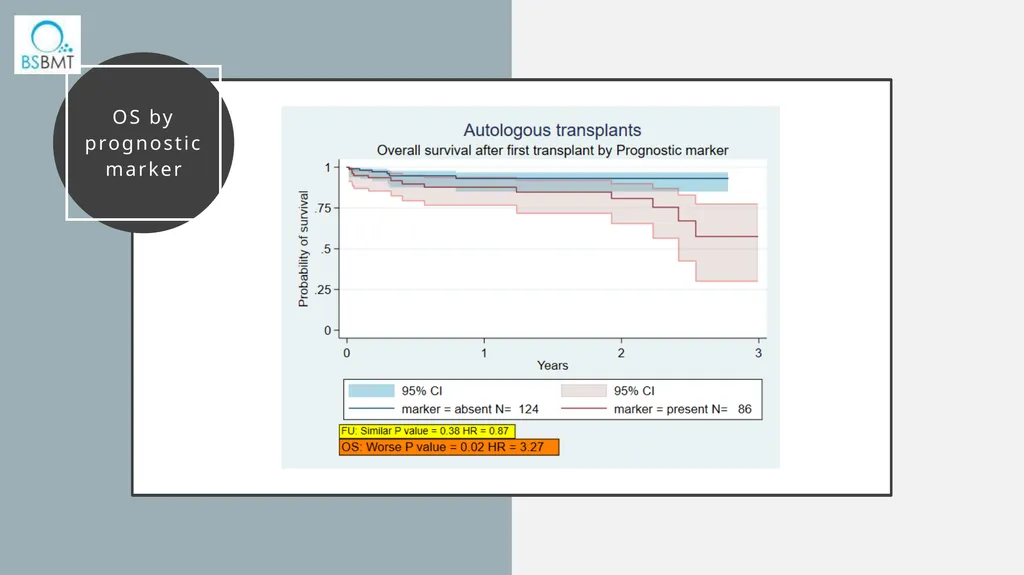
I was able to swiftly estimate the baseline survivals in the two subpopulations and graphically illustrate them<br>
09
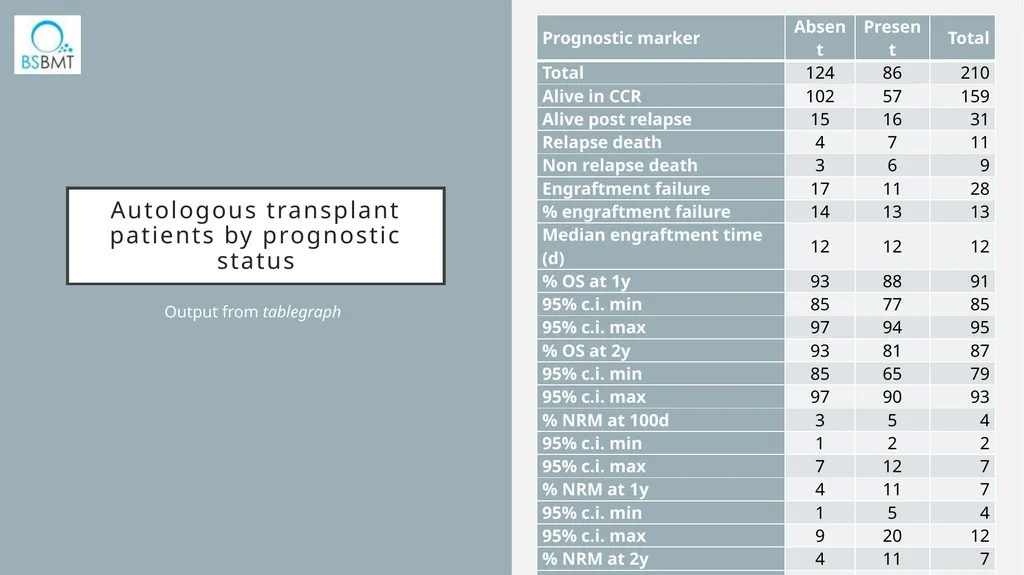
Autologous transplant patients by prognostic status Output from tablegraph<br>
10
OS by prognostic marker<br>
11
Example 2: Outcomes by centre Asked to report numbers and outcomes by centre, by diagnosis and by type of transplant
Need to compare outcomes with UK standard
Reasonable comparisons require stratification / risk adjustment<br>
12
From centre report<br>
13
Thanks Rest of the Registry Team
Physicians and Data Managers at all the centres which contribute data
Fellow Stata users on Statalist and Twitter
Patients who consent for their data to be used