
A summer internship project report on “A Study on


Description: A summer internship project report on A Study on Financial performance analysis of top 3 Indian IT companies at Bombay Stock Exchange Brokers Forum (BBF) Submitted to : S. R. Luthra Institute of Management. Under Guidance of: Ranjan
Related Topics
Download Presentation
"A summer internship project report on “A Study on" is the property of its rightful owner. Permission is granted to download and print the materials on this website for personal, non-commercial use only, and to display it on your personal computer provided you do not modify the materials and that you retain all copyright notices contained in the materials. By downloading content from our website, you accept the terms of this agreement.
Presentation Transcript
slide1. A summer internship project report on
“A Study on Financial performance analysis of top 3 Indian IT companies”
at
“Bombay Stock Exchange Brokers’ Forum (BBF)” Submitted to : S. R. Luthra Institute of Management.
Under Guidance of: Ranjan Sabhaya (Assistant Professor)
Submitted By: Rishabh Rathod (LM21MGMB220)<br>
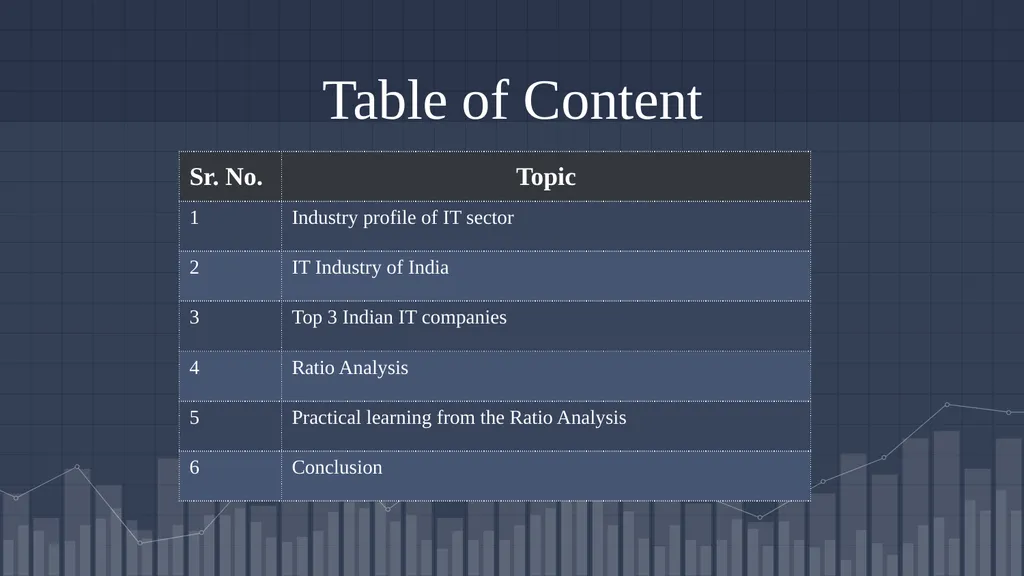
slide2. Table of Content<br>
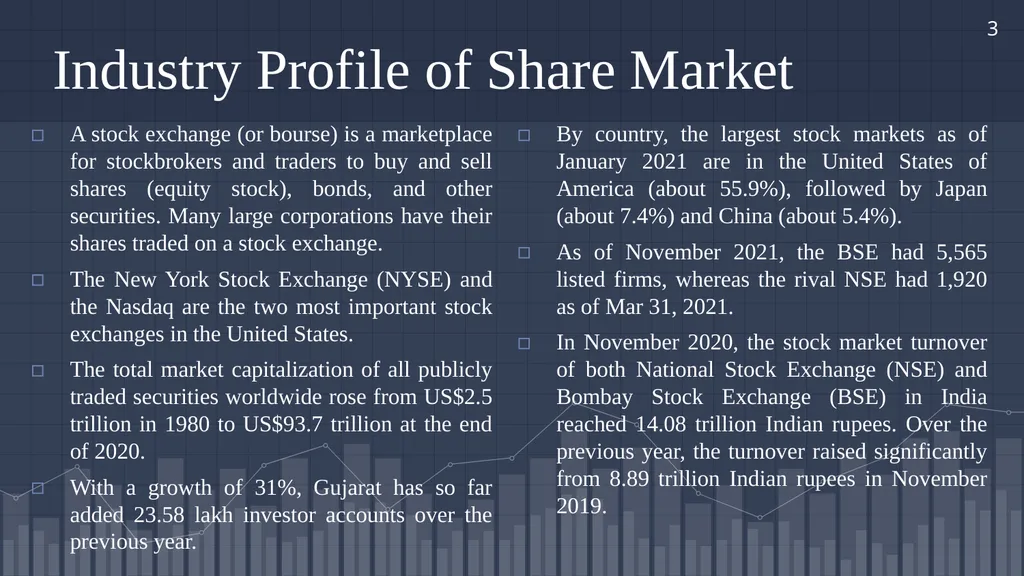
slide3. Industry Profile of Share Market A stock exchange (or bourse) is a marketplace for stockbrokers and traders to buy and sell shares (equity stock), bonds, and other securities. Many large corporations have their shares traded on a stock exchange.
The New York Stock Exchange (NYSE) and the Nasdaq are the two most important stock exchanges in the United States.
The total market capitalization of all publicly traded securities worldwide rose from US$2.5 trillion in 1980 to US$93.7 trillion at the end of 2020.
With a growth of 31%, Gujarat has so far added 23.58 lakh investor accounts over the previous year. By country, the largest stock markets as of January 2021 are in the United States of America (about 55.9%), followed by Japan (about 7.4%) and China (about 5.4%).
As of November 2021, the BSE had 5,565 listed firms, whereas the rival NSE had 1,920 as of Mar 31, 2021.
In November 2020, the stock market turnover of both National Stock Exchange (NSE) and Bombay Stock Exchange (BSE) in India reached 14.08 trillion Indian rupees. Over the previous year, the turnover raised significantly from 8.89 trillion Indian rupees in November 2019. 3<br>
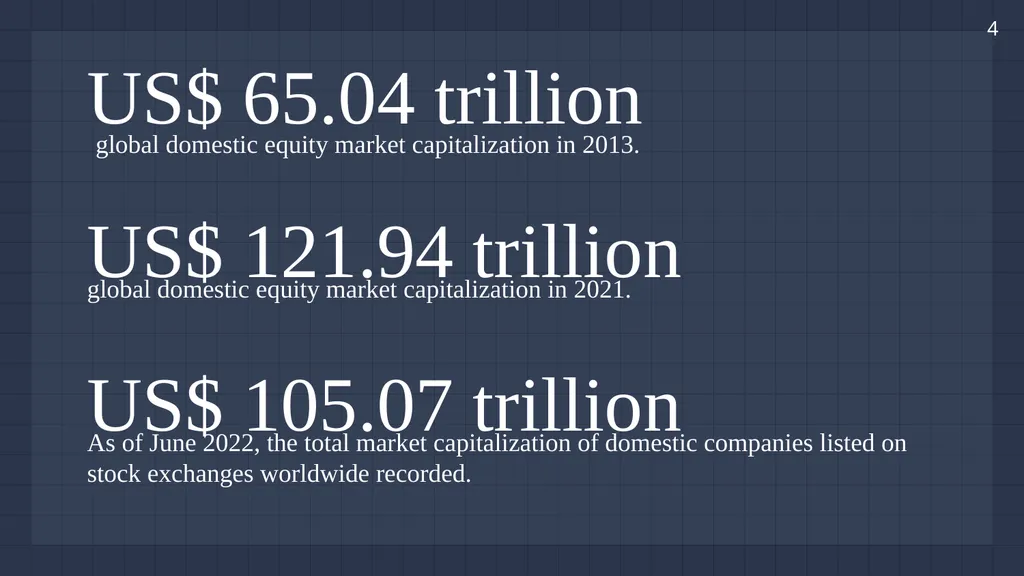
slide4. US$ 65.04 trillion global domestic equity market capitalization in 2013. US$ 105.07 trillion As of June 2022, the total market capitalization of domestic companies listed on stock exchanges worldwide recorded. US$ 121.94 trillion global domestic equity market capitalization in 2021. 4<br>
slide5. Company profile of BSE brokers’ forum BBF is a member of a number of international organizations, including the International Council of Securities Associations (ICSA), the Asia Securities Forum, and the International Forum for Investor Education (IFIE). We communicate with local financial market organizations from different jurisdictions throughout the world at these conferences.
The Bombay Stock Exchange Brokers' Forum (BBF) is established in 4th February, 1993. In 1992, that time was a problem of SEBI with Brokers. The main objective of BBF is to basically represent the problem of broker’s to SEBI, RBI, and Ministry of finance and to the Government bodies. The basically model of working is the brokers paid membership fees. Annual membership fees this paid by brokers. And with the membership fees they carried out their expenses. So, Membership fees are the main income. And little amount they get from the investors awareness program.
Whatever problem is the broker’s faces in terms of Compliance, Rules and Regulations, Difficulties. They highlight it to the basically government bodies and the regulators and the Stock Exchanges. 5<br>
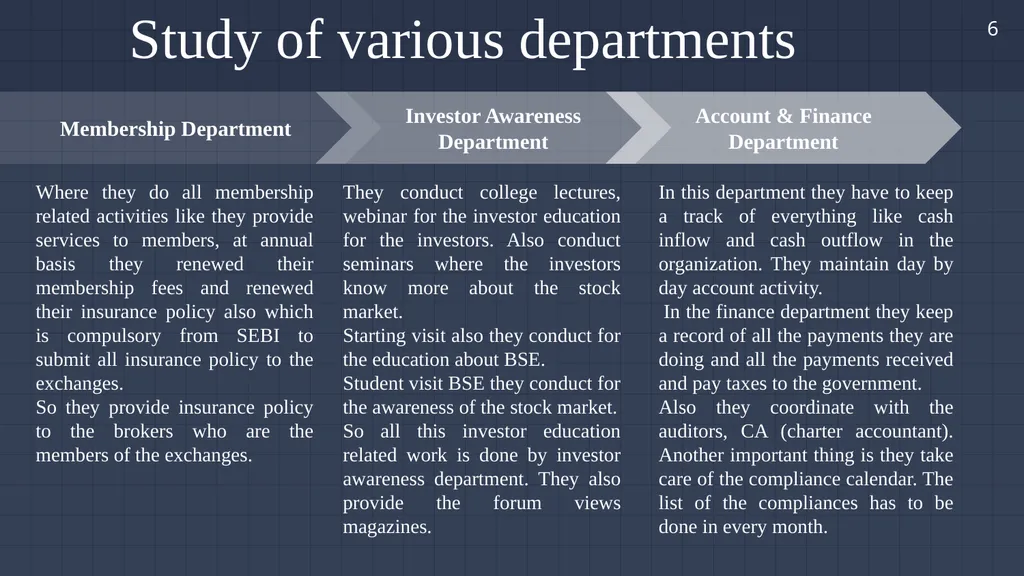
slide6. Study of various departments 6<br>
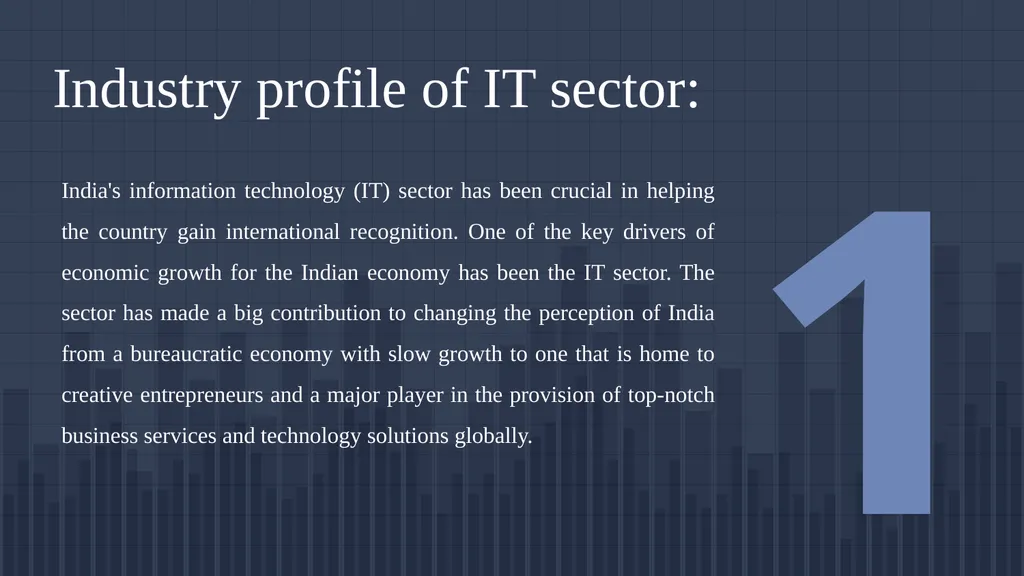
slide7. Industry profile of IT sector: India's information technology (IT) sector has been crucial in helping the country gain international recognition. One of the key drivers of economic growth for the Indian economy has been the IT sector. The sector has made a big contribution to changing the perception of India from a bureaucratic economy with slow growth to one that is home to creative entrepreneurs and a major player in the provision of top-notch business services and technology solutions globally. 1<br>
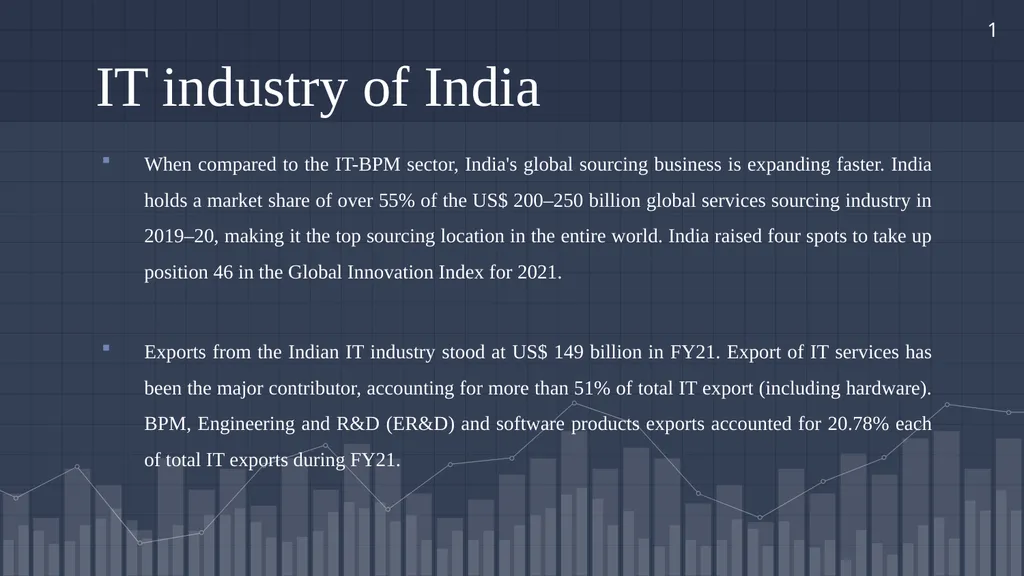
slide8. IT industry of India When compared to the IT-BPM sector, India's global sourcing business is expanding faster. India holds a market share of over 55% of the US$ 200–250 billion global services sourcing industry in 2019–20, making it the top sourcing location in the entire world. India raised four spots to take up position 46 in the Global Innovation Index for 2021.
Exports from the Indian IT industry stood at US$ 149 billion in FY21. Export of IT services has been the major contributor, accounting for more than 51% of total IT export (including hardware). BPM, Engineering and R&D (ER&D) and software products exports accounted for 20.78% each of total IT exports during FY21. 1<br>
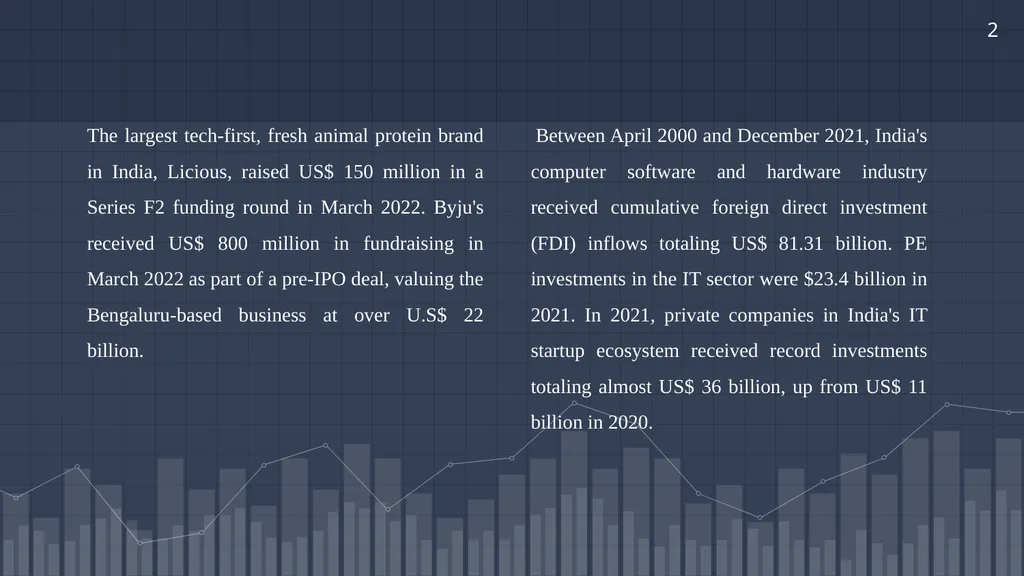
slide9. The largest tech-first, fresh animal protein brand in India, Licious, raised US$ 150 million in a Series F2 funding round in March 2022. Byju's received US$ 800 million in fundraising in March 2022 as part of a pre-IPO deal, valuing the Bengaluru-based business at over U.S$ 22 billion. Between April 2000 and December 2021, India's computer software and hardware industry received cumulative foreign direct investment (FDI) inflows totaling US$ 81.31 billion. PE investments in the IT sector were $23.4 billion in 2021. In 2021, private companies in India's IT startup ecosystem received record investments totaling almost US$ 36 billion, up from US$ 11 billion in 2020. 2<br>
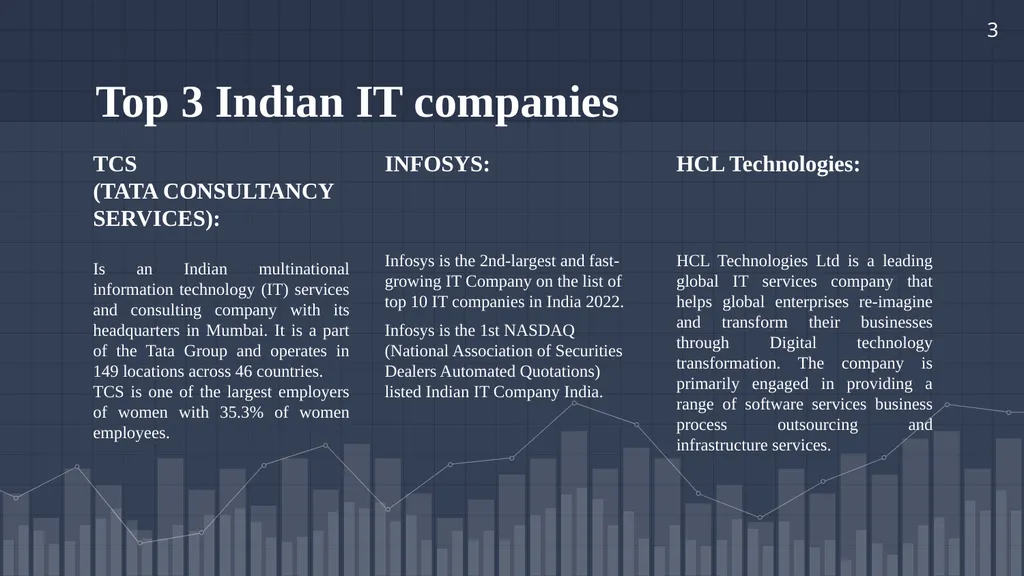
slide10. Top 3 Indian IT companies TCS
(TATA CONSULTANCY SERVICES):
Is an Indian multinational information technology (IT) services and consulting company with its headquarters in Mumbai. It is a part of the Tata Group and operates in 149 locations across 46 countries.
TCS is one of the largest employers of women with 35.3% of women employees. INFOSYS:
Infosys is the 2nd-largest and fast-growing IT Company on the list of top 10 IT companies in India 2022.
Infosys is the 1st NASDAQ (National Association of Securities Dealers Automated Quotations) listed Indian IT Company India. HCL Technologies:
HCL Technologies Ltd is a leading global IT services company that helps global enterprises re-imagine and transform their businesses through Digital technology transformation. The company is primarily engaged in providing a range of software services business process outsourcing and infrastructure services. 3<br>
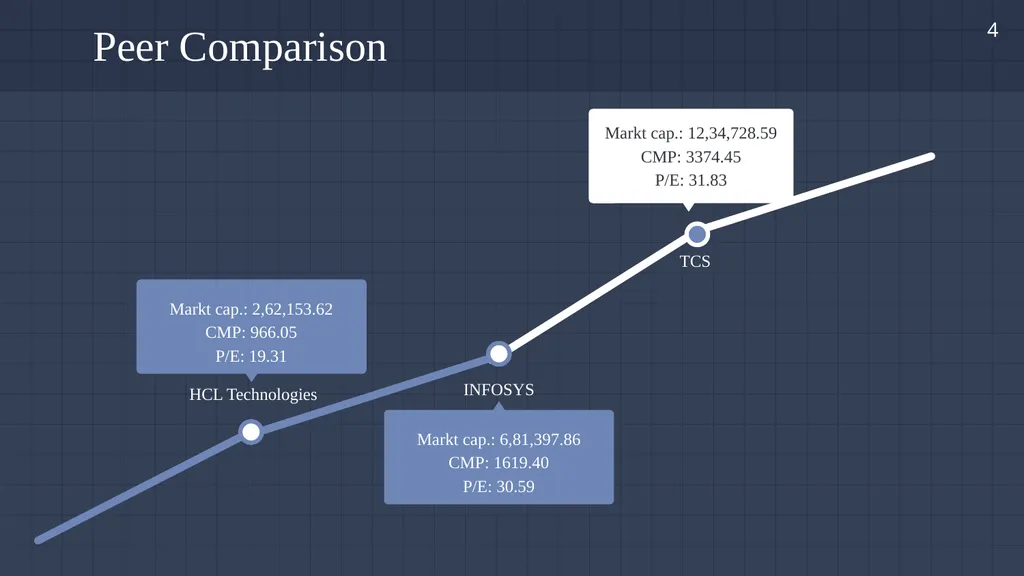
slide11. Peer Comparison 4<br>
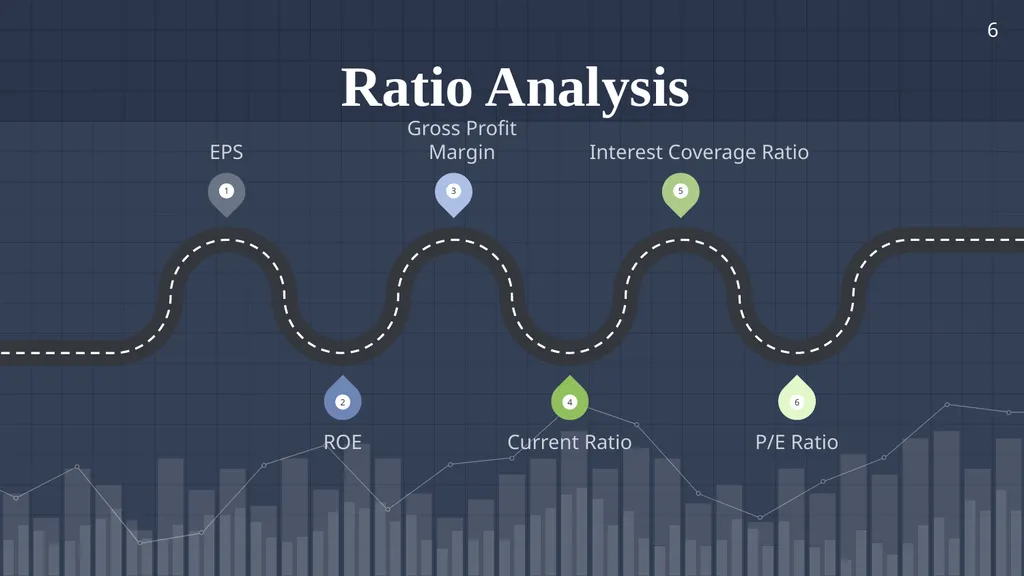
slide12. Ratio Analysis 6 EPS Gross Profit Margin Interest Coverage Ratio ROE Current Ratio P/E Ratio<br>
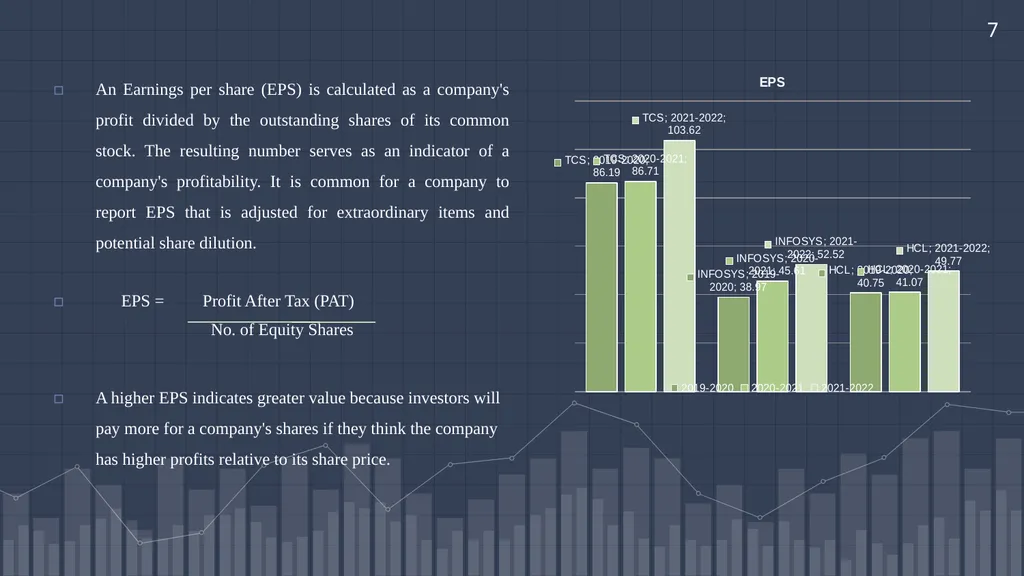
slide13. An Earnings per share (EPS) is calculated as a company's profit divided by the outstanding shares of its common stock. The resulting number serves as an indicator of a company's profitability. It is common for a company to report EPS that is adjusted for extraordinary items and potential share dilution.
EPS = Profit After Tax (PAT)
No. of Equity Shares
A higher EPS indicates greater value because investors will pay more for a company's shares if they think the company has higher profits relative to its share price. 7<br>
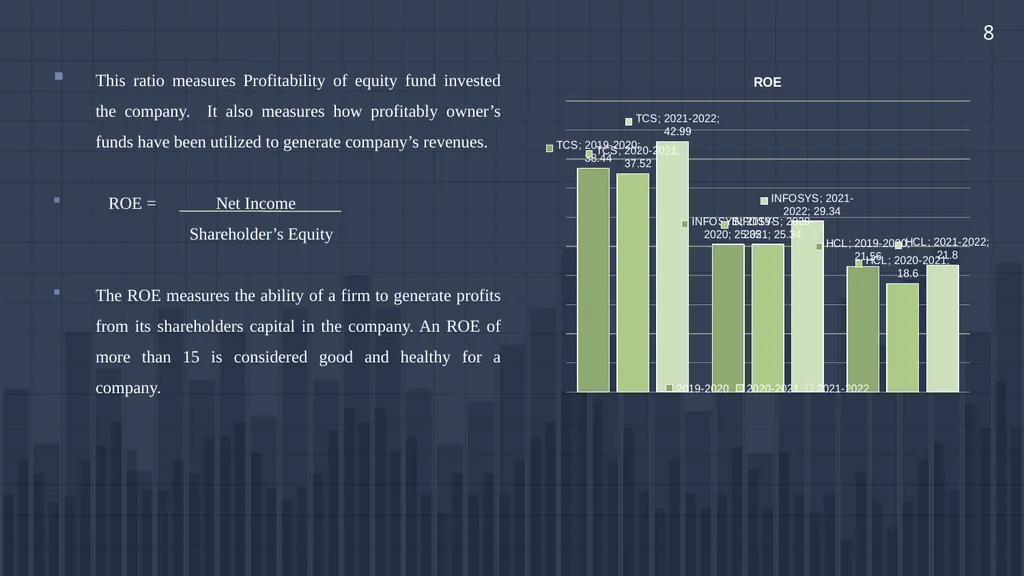
slide14. This ratio measures Profitability of equity fund invested the company. It also measures how profitably owner’s funds have been utilized to generate company’s revenues.
ROE = Net Income
Shareholder’s Equity
The ROE measures the ability of a firm to generate profits from its shareholders capital in the company. An ROE of more than 15 is considered good and healthy for a company. 8<br>
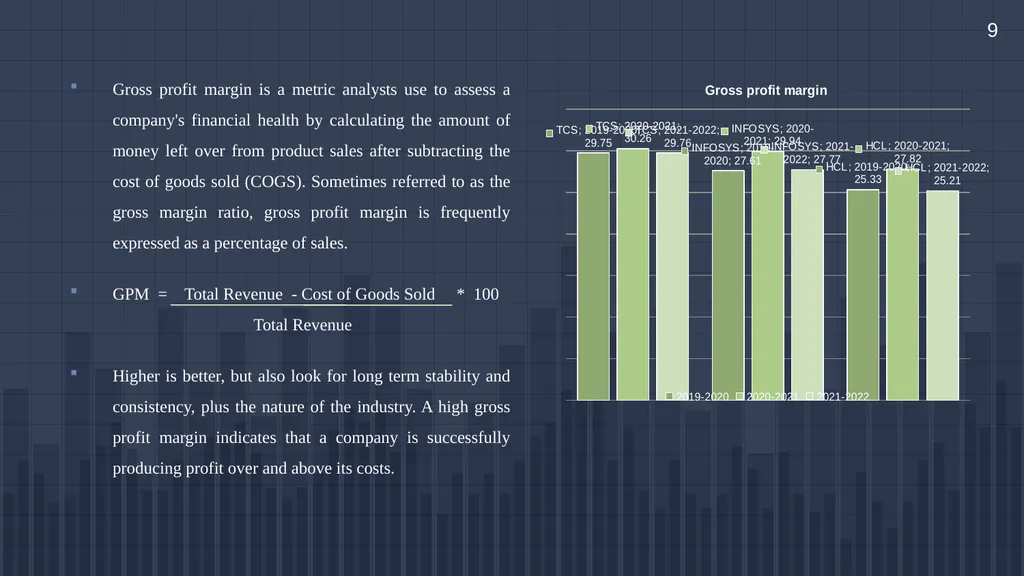
slide15. Gross profit margin is a metric analysts use to assess a company's financial health by calculating the amount of money left over from product sales after subtracting the cost of goods sold (COGS). Sometimes referred to as the gross margin ratio, gross profit margin is frequently expressed as a percentage of sales.
GPM = Total Revenue - Cost of Goods Sold * 100
Total Revenue
Higher is better, but also look for long term stability and consistency, plus the nature of the industry. A high gross profit margin indicates that a company is successfully producing profit over and above its costs. 9<br>
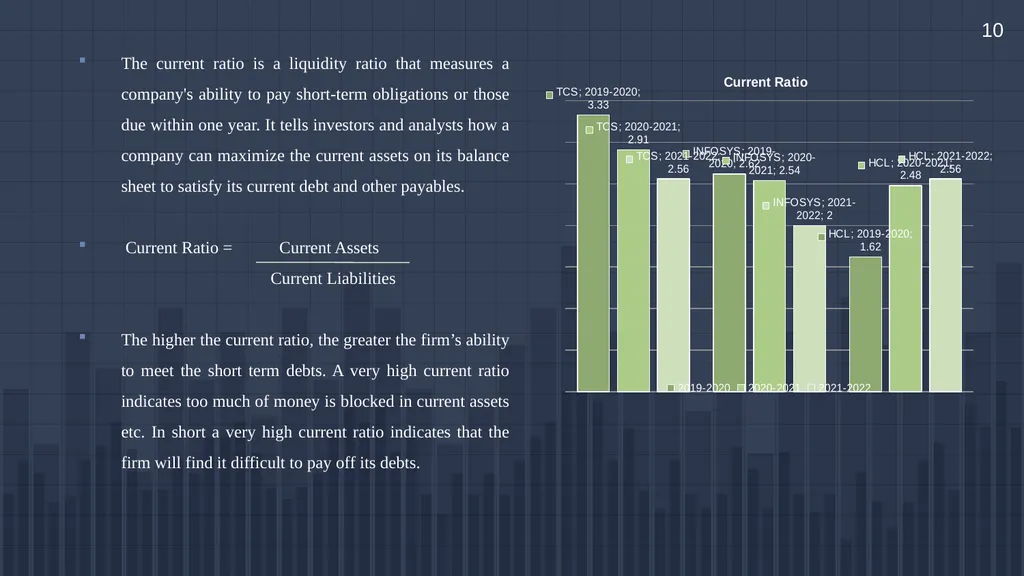
slide16. The current ratio is a liquidity ratio that measures a company's ability to pay short-term obligations or those due within one year. It tells investors and analysts how a company can maximize the current assets on its balance sheet to satisfy its current debt and other payables.
Current Ratio = Current Assets
Current Liabilities
The higher the current ratio, the greater the firm’s ability to meet the short term debts. A very high current ratio indicates too much of money is blocked in current assets etc. In short a very high current ratio indicates that the firm will find it difficult to pay off its debts. 10<br>
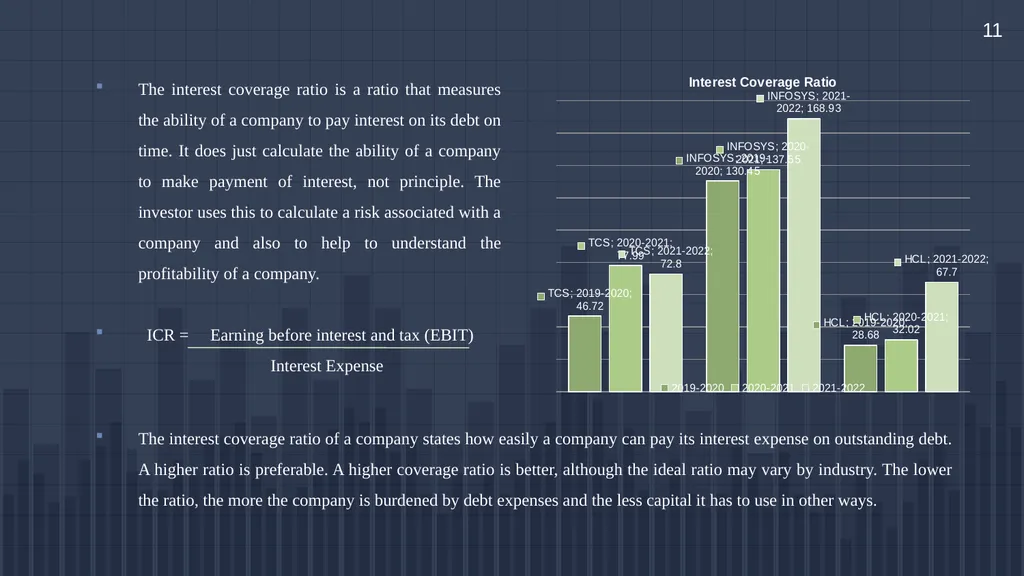
slide17. The interest coverage ratio of a company states how easily a company can pay its interest expense on outstanding debt. A higher ratio is preferable. A higher coverage ratio is better, although the ideal ratio may vary by industry. The lower the ratio, the more the company is burdened by debt expenses and the less capital it has to use in other ways. The interest coverage ratio is a ratio that measures the ability of a company to pay interest on its debt on time. It does just calculate the ability of a company to make payment of interest, not principle. The investor uses this to calculate a risk associated with a company and also to help to understand the profitability of a company.
ICR = Earning before interest and tax (EBIT)
Interest Expense 11<br>
slide18. P/E ratios are used by investors and analysts to determine the relative value of a company's shares in an apples-to-apples comparison. It can also be used to compare a company against its own historical record or to compare aggregate markets against one another or over time.
P/E Ratio = Share price
Earnings per share(EPS) A high P/E ratio could mean that a company's stock is overvalued, or that investors are expecting high growth rates in the future. A low P/E can indicate either that a company may currently be undervalued or that the company is doing exceptionally well relative to its past trends. 12<br>
slide19. Practical learning from the Ratio analysis From this in depth study of financial performance analysis of the top 3 IT companies is show that the growth of the companies. Evaluate companies overall performance with respect to their different ratios. In the financial ratio analysis understand company’s financial growth, profitability, liquidity, efficiency and more.
It can also help investors to understand it is better to invest in that companies stock. IT sector is the India’s most growing sector. TATA consultancy services and Infosys are in one of the top 10 companies in world. Overall performance of TATA consultancy services is better than Infosys and HCL Technologies.
In this depth study per share ratio analysis of TATA consultancy is good than other two companies. The interest coverage ratio is higher of Infosys, so Infosys is doing well than other two company. 13<br>
slide20. CONCLUSION A TATA consultancy service (TCS) is the major player in the IT industry. In per share ratio EPS of TCS is higher. ROE (Return on equity) is increasing over a period in all the three companies that indicate IT companies doing well in profitability growth. In debt to equity ratio, HCL technologies has higher ratio. TCS and Infosys is debt free company. In valuation ratio, that TCS, Infosys and HCL technologies stock is overvalued . In the overall financial analysis TCS has best performance. 14<br>
slide21. THANK YOU 15<br>
Under Guidance of: Ranjan Sabhaya (Assistant Professor)
Submitted By: Rishabh Rathod (LM21MGMB220)<br>
slide2. Table of Content<br>
slide3. Industry Profile of Share Market A stock exchange (or bourse) is a marketplace for stockbrokers and traders to buy and sell shares (equity stock), bonds, and other securities. Many large corporations have their shares traded on a stock exchange.
The New York Stock Exchange (NYSE) and the Nasdaq are the two most important stock exchanges in the United States.
The total market capitalization of all publicly traded securities worldwide rose from US$2.5 trillion in 1980 to US$93.7 trillion at the end of 2020.
With a growth of 31%, Gujarat has so far added 23.58 lakh investor accounts over the previous year. By country, the largest stock markets as of January 2021 are in the United States of America (about 55.9%), followed by Japan (about 7.4%) and China (about 5.4%).
As of November 2021, the BSE had 5,565 listed firms, whereas the rival NSE had 1,920 as of Mar 31, 2021.
In November 2020, the stock market turnover of both National Stock Exchange (NSE) and Bombay Stock Exchange (BSE) in India reached 14.08 trillion Indian rupees. Over the previous year, the turnover raised significantly from 8.89 trillion Indian rupees in November 2019. 3<br>
slide4. US$ 65.04 trillion global domestic equity market capitalization in 2013. US$ 105.07 trillion As of June 2022, the total market capitalization of domestic companies listed on stock exchanges worldwide recorded. US$ 121.94 trillion global domestic equity market capitalization in 2021. 4<br>
slide5. Company profile of BSE brokers’ forum BBF is a member of a number of international organizations, including the International Council of Securities Associations (ICSA), the Asia Securities Forum, and the International Forum for Investor Education (IFIE). We communicate with local financial market organizations from different jurisdictions throughout the world at these conferences.
The Bombay Stock Exchange Brokers' Forum (BBF) is established in 4th February, 1993. In 1992, that time was a problem of SEBI with Brokers. The main objective of BBF is to basically represent the problem of broker’s to SEBI, RBI, and Ministry of finance and to the Government bodies. The basically model of working is the brokers paid membership fees. Annual membership fees this paid by brokers. And with the membership fees they carried out their expenses. So, Membership fees are the main income. And little amount they get from the investors awareness program.
Whatever problem is the broker’s faces in terms of Compliance, Rules and Regulations, Difficulties. They highlight it to the basically government bodies and the regulators and the Stock Exchanges. 5<br>
slide6. Study of various departments 6<br>
slide7. Industry profile of IT sector: India's information technology (IT) sector has been crucial in helping the country gain international recognition. One of the key drivers of economic growth for the Indian economy has been the IT sector. The sector has made a big contribution to changing the perception of India from a bureaucratic economy with slow growth to one that is home to creative entrepreneurs and a major player in the provision of top-notch business services and technology solutions globally. 1<br>
slide8. IT industry of India When compared to the IT-BPM sector, India's global sourcing business is expanding faster. India holds a market share of over 55% of the US$ 200–250 billion global services sourcing industry in 2019–20, making it the top sourcing location in the entire world. India raised four spots to take up position 46 in the Global Innovation Index for 2021.
Exports from the Indian IT industry stood at US$ 149 billion in FY21. Export of IT services has been the major contributor, accounting for more than 51% of total IT export (including hardware). BPM, Engineering and R&D (ER&D) and software products exports accounted for 20.78% each of total IT exports during FY21. 1<br>
slide9. The largest tech-first, fresh animal protein brand in India, Licious, raised US$ 150 million in a Series F2 funding round in March 2022. Byju's received US$ 800 million in fundraising in March 2022 as part of a pre-IPO deal, valuing the Bengaluru-based business at over U.S$ 22 billion. Between April 2000 and December 2021, India's computer software and hardware industry received cumulative foreign direct investment (FDI) inflows totaling US$ 81.31 billion. PE investments in the IT sector were $23.4 billion in 2021. In 2021, private companies in India's IT startup ecosystem received record investments totaling almost US$ 36 billion, up from US$ 11 billion in 2020. 2<br>
slide10. Top 3 Indian IT companies TCS
(TATA CONSULTANCY SERVICES):
Is an Indian multinational information technology (IT) services and consulting company with its headquarters in Mumbai. It is a part of the Tata Group and operates in 149 locations across 46 countries.
TCS is one of the largest employers of women with 35.3% of women employees. INFOSYS:
Infosys is the 2nd-largest and fast-growing IT Company on the list of top 10 IT companies in India 2022.
Infosys is the 1st NASDAQ (National Association of Securities Dealers Automated Quotations) listed Indian IT Company India. HCL Technologies:
HCL Technologies Ltd is a leading global IT services company that helps global enterprises re-imagine and transform their businesses through Digital technology transformation. The company is primarily engaged in providing a range of software services business process outsourcing and infrastructure services. 3<br>
slide11. Peer Comparison 4<br>
slide12. Ratio Analysis 6 EPS Gross Profit Margin Interest Coverage Ratio ROE Current Ratio P/E Ratio<br>
slide13. An Earnings per share (EPS) is calculated as a company's profit divided by the outstanding shares of its common stock. The resulting number serves as an indicator of a company's profitability. It is common for a company to report EPS that is adjusted for extraordinary items and potential share dilution.
EPS = Profit After Tax (PAT)
No. of Equity Shares
A higher EPS indicates greater value because investors will pay more for a company's shares if they think the company has higher profits relative to its share price. 7<br>
slide14. This ratio measures Profitability of equity fund invested the company. It also measures how profitably owner’s funds have been utilized to generate company’s revenues.
ROE = Net Income
Shareholder’s Equity
The ROE measures the ability of a firm to generate profits from its shareholders capital in the company. An ROE of more than 15 is considered good and healthy for a company. 8<br>
slide15. Gross profit margin is a metric analysts use to assess a company's financial health by calculating the amount of money left over from product sales after subtracting the cost of goods sold (COGS). Sometimes referred to as the gross margin ratio, gross profit margin is frequently expressed as a percentage of sales.
GPM = Total Revenue - Cost of Goods Sold * 100
Total Revenue
Higher is better, but also look for long term stability and consistency, plus the nature of the industry. A high gross profit margin indicates that a company is successfully producing profit over and above its costs. 9<br>
slide16. The current ratio is a liquidity ratio that measures a company's ability to pay short-term obligations or those due within one year. It tells investors and analysts how a company can maximize the current assets on its balance sheet to satisfy its current debt and other payables.
Current Ratio = Current Assets
Current Liabilities
The higher the current ratio, the greater the firm’s ability to meet the short term debts. A very high current ratio indicates too much of money is blocked in current assets etc. In short a very high current ratio indicates that the firm will find it difficult to pay off its debts. 10<br>
slide17. The interest coverage ratio of a company states how easily a company can pay its interest expense on outstanding debt. A higher ratio is preferable. A higher coverage ratio is better, although the ideal ratio may vary by industry. The lower the ratio, the more the company is burdened by debt expenses and the less capital it has to use in other ways. The interest coverage ratio is a ratio that measures the ability of a company to pay interest on its debt on time. It does just calculate the ability of a company to make payment of interest, not principle. The investor uses this to calculate a risk associated with a company and also to help to understand the profitability of a company.
ICR = Earning before interest and tax (EBIT)
Interest Expense 11<br>
slide18. P/E ratios are used by investors and analysts to determine the relative value of a company's shares in an apples-to-apples comparison. It can also be used to compare a company against its own historical record or to compare aggregate markets against one another or over time.
P/E Ratio = Share price
Earnings per share(EPS) A high P/E ratio could mean that a company's stock is overvalued, or that investors are expecting high growth rates in the future. A low P/E can indicate either that a company may currently be undervalued or that the company is doing exceptionally well relative to its past trends. 12<br>
slide19. Practical learning from the Ratio analysis From this in depth study of financial performance analysis of the top 3 IT companies is show that the growth of the companies. Evaluate companies overall performance with respect to their different ratios. In the financial ratio analysis understand company’s financial growth, profitability, liquidity, efficiency and more.
It can also help investors to understand it is better to invest in that companies stock. IT sector is the India’s most growing sector. TATA consultancy services and Infosys are in one of the top 10 companies in world. Overall performance of TATA consultancy services is better than Infosys and HCL Technologies.
In this depth study per share ratio analysis of TATA consultancy is good than other two companies. The interest coverage ratio is higher of Infosys, so Infosys is doing well than other two company. 13<br>
slide20. CONCLUSION A TATA consultancy service (TCS) is the major player in the IT industry. In per share ratio EPS of TCS is higher. ROE (Return on equity) is increasing over a period in all the three companies that indicate IT companies doing well in profitability growth. In debt to equity ratio, HCL technologies has higher ratio. TCS and Infosys is debt free company. In valuation ratio, that TCS, Infosys and HCL technologies stock is overvalued . In the overall financial analysis TCS has best performance. 14<br>
slide21. THANK YOU 15<br>