
AIA Foresight Report 2017 Global Perspective:

Description: AIA Foresight Report 2017 Global Perspective: Challenge and Change GEOPOLITICAL SHIFTS 121 Countries changed heads of state or senior-most leaders between 2015 and 2016 Source: U.S. State Department SECURITY MILITARY 1.76t Global
Related Topics
Download Presentation
"AIA Foresight Report 2017 Global Perspective:" is the property of its rightful owner. Permission is granted to download and print the materials on this website for personal, non-commercial use only, and to display it on your personal computer provided you do not modify the materials and that you retain all copyright notices contained in the materials. By downloading content from our website, you accept the terms of this agreement.
Presentation Transcript
slide1. AIA Foresight Report 2017<br>
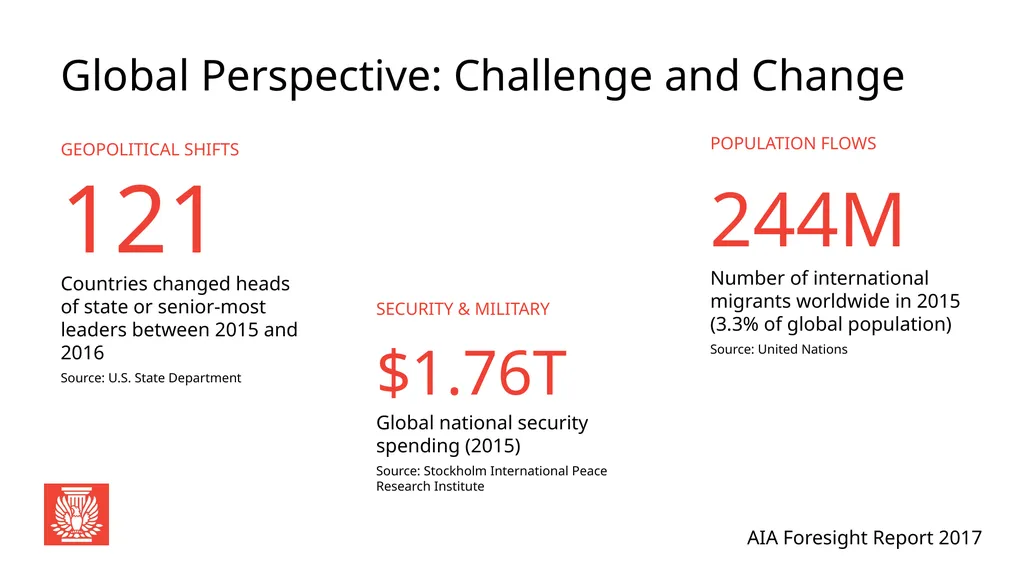
slide2. Global Perspective: Challenge and Change GEOPOLITICAL SHIFTS
121
Countries changed heads of state or senior-most leaders between 2015 and 2016
Source: U.S. State Department SECURITY & MILITARY
$1.76t
Global national security spending (2015)
Source: Stockholm International Peace Research Institute POPULATION FLOWS
244m
Number of international migrants worldwide in 2015
(3.3% of global population)
Source: United Nations<br>
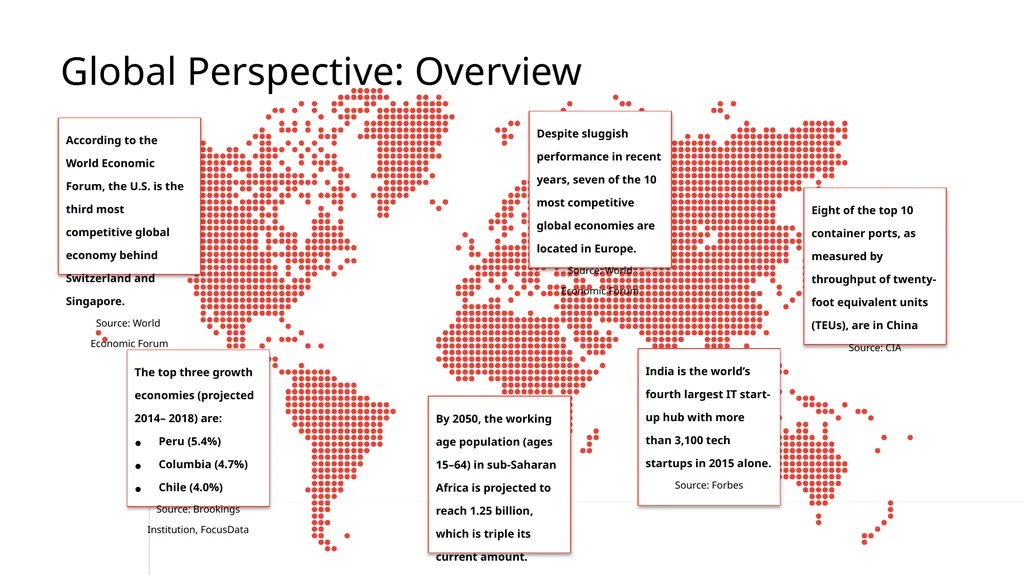
slide3. According to the World Economic Forum, the U.S. is the third most competitive global economy behind Switzerland and Singapore.
Source: World Economic Forum Despite sluggish performance in recent years, seven of the 10 most competitive global economies are located in Europe.
Source: World Economic Forum Eight of the top 10 container ports, as measured by throughput of twenty-foot equivalent units (TEUs), are in China
Source: CIA India is the world’s fourth largest IT start-up hub with more than 3,100 tech startups in 2015 alone.
Source: Forbes By 2050, the working age population (ages 15–64) in sub-Saharan Africa is projected to reach 1.25 billion, which is triple its current amount.
Source: IMF The top three growth economies (projected 2014– 2018) are:
Peru (5.4%)
Columbia (4.7%)
Chile (4.0%)
Source: Brookings Institution, FocusData Global Perspective: Overview<br>
slide4. United States: Social & Demographic Change Two-parent households declined from 87% in 1960 to 69% in 2016.
Roughly 17% of kids in the U.S. currently live in blended families.
By 2055, the U.S. will not have a single racial or ethnic majority.
59 million immigrants have come to the country since the middle 1960s.<br>
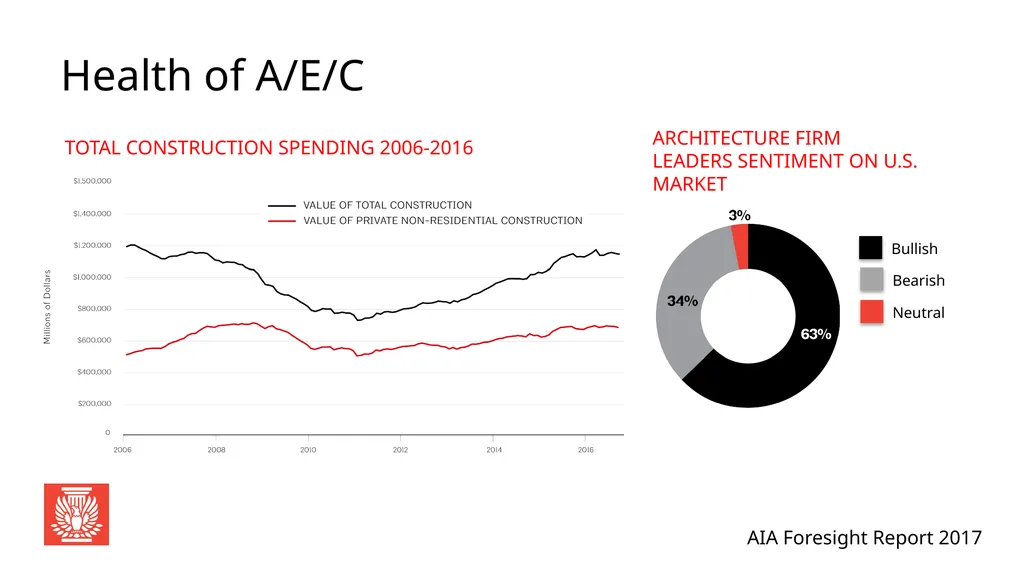
slide5. Health of A/E/C<br>
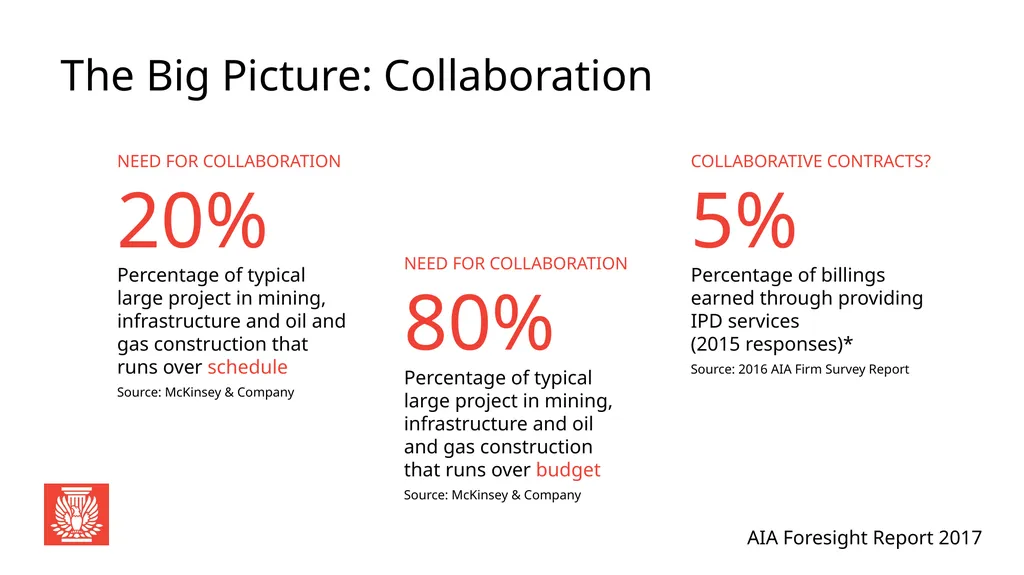
slide6. The Big Picture: Collaboration COLLABORATIVE CONTRACTS?
5%
Percentage of billings earned through providing IPD services (2015 responses)*
Source: 2016 AIA Firm Survey Report NEED FOR COLLABORATION
20%
Percentage of typical large project in mining, infrastructure and oil and gas construction that runs over schedule
Source: McKinsey & Company NEED FOR COLLABORATION
80%
Percentage of typical large project in mining, infrastructure and oil and gas construction that runs over budget
Source: McKinsey & Company<br>
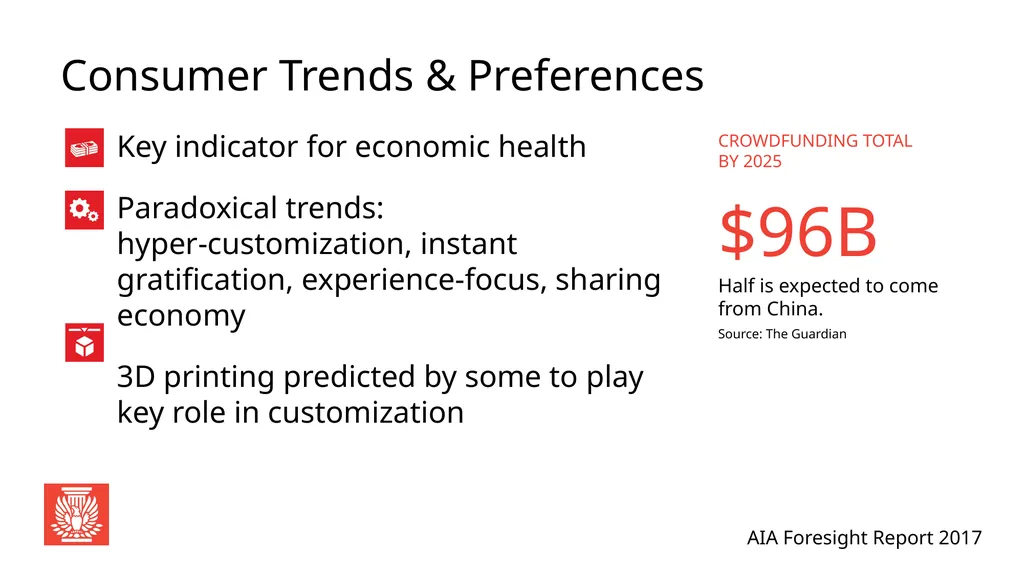
slide7. Consumer Trends & Preferences Key indicator for economic health
Paradoxical trends: hyper-customization, instant gratification, experience-focus, sharing economy
3D printing predicted by some to play key role in customization CROWDFUNDING TOTAL BY 2025
$96b
Half is expected to come from China.
Source: The Guardian<br>
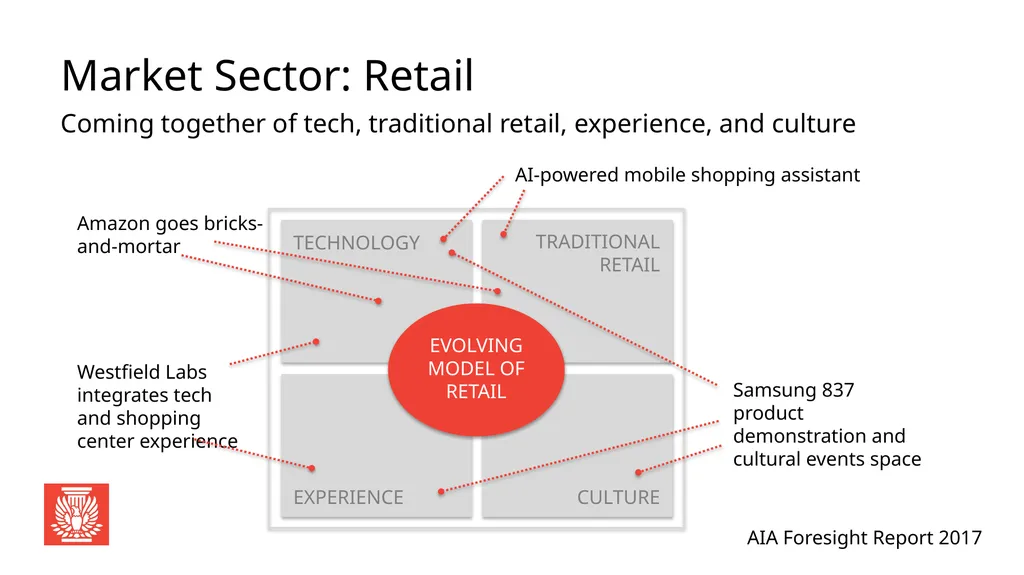
slide8. Market Sector: Retail Coming together of tech, traditional retail, experience, and culture<br>
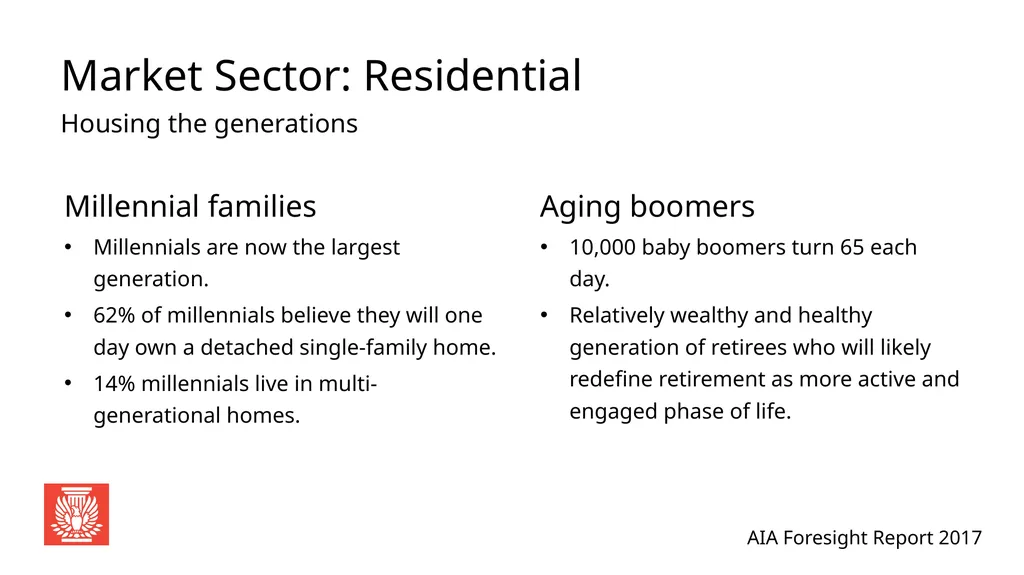
slide9. Market Sector: Residential Housing the generations Millennial families
Millennials are now the largest generation.
62% of millennials believe they will one day own a detached single-family home.
14% millennials live in multi- generational homes. Aging boomers
10,000 baby boomers turn 65 each day.
Relatively wealthy and healthy generation of retirees who will likely redefine retirement as more active and engaged phase of life.<br>
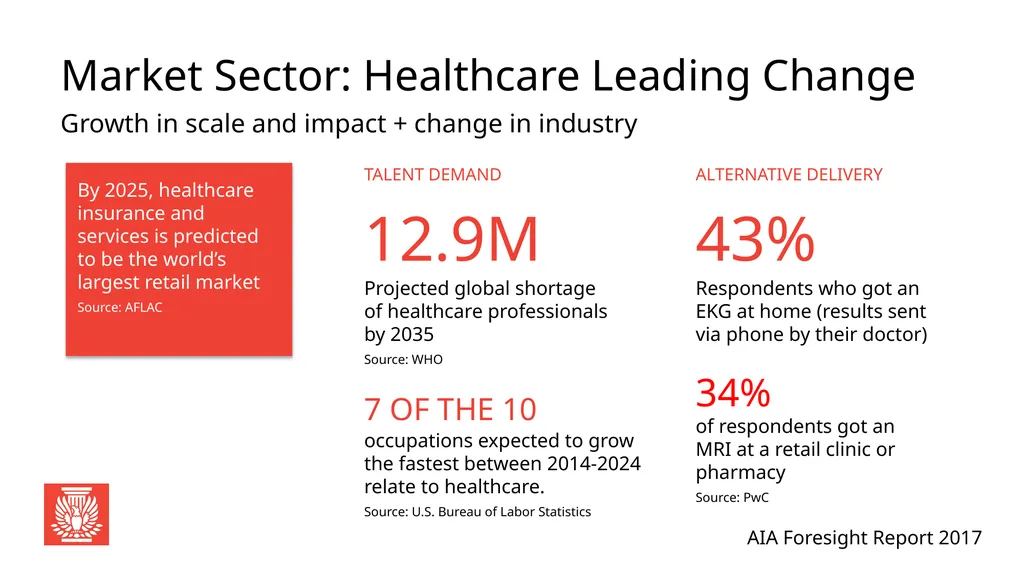
slide10. Market Sector: Healthcare Leading Change Growth in scale and impact + change in industry By 2025, healthcare insurance and services is predicted to be the world’s largest retail market
Source: AFLAC TALENT DEMAND
12.9m
Projected global shortage of healthcare professionals by 2035
Source: WHO
7 of the 10
occupations expected to grow the fastest between 2014-2024 relate to healthcare.
Source: U.S. Bureau of Labor Statistics ALTERNATIVE DELIVERY
43%
Respondents who got an EKG at home (results sent via phone by their doctor)
34%
of respondents got an MRI at a retail clinic or pharmacy
Source: PwC<br>
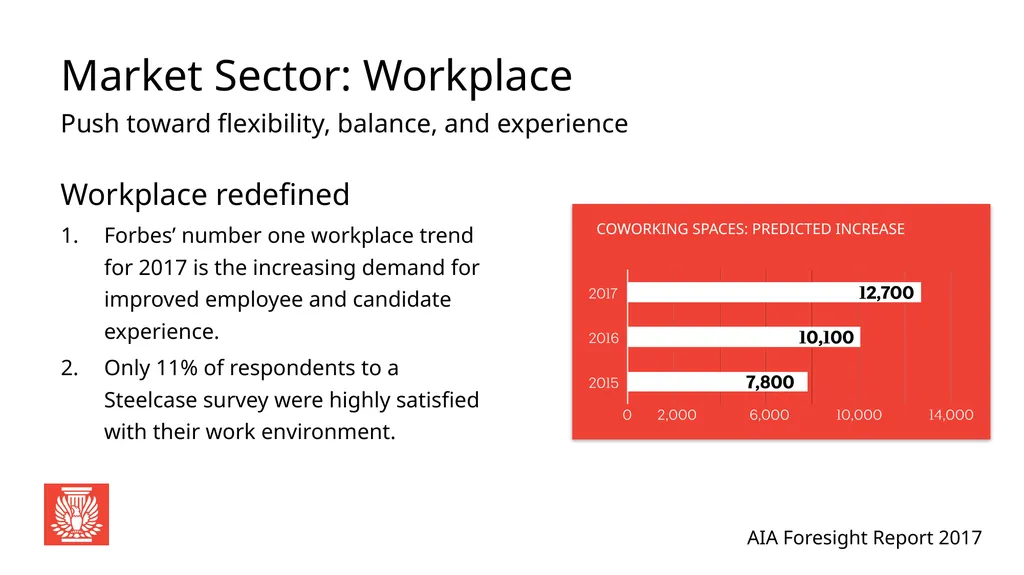
slide11. Market Sector: Workplace Push toward flexibility, balance, and experience Workplace redefined
Forbes’ number one workplace trend for 2017 is the increasing demand for improved employee and candidate experience.
Only 11% of respondents to a Steelcase survey were highly satisfied with their work environment. COWORKING SPACES: PREDICTED INCREASE<br>
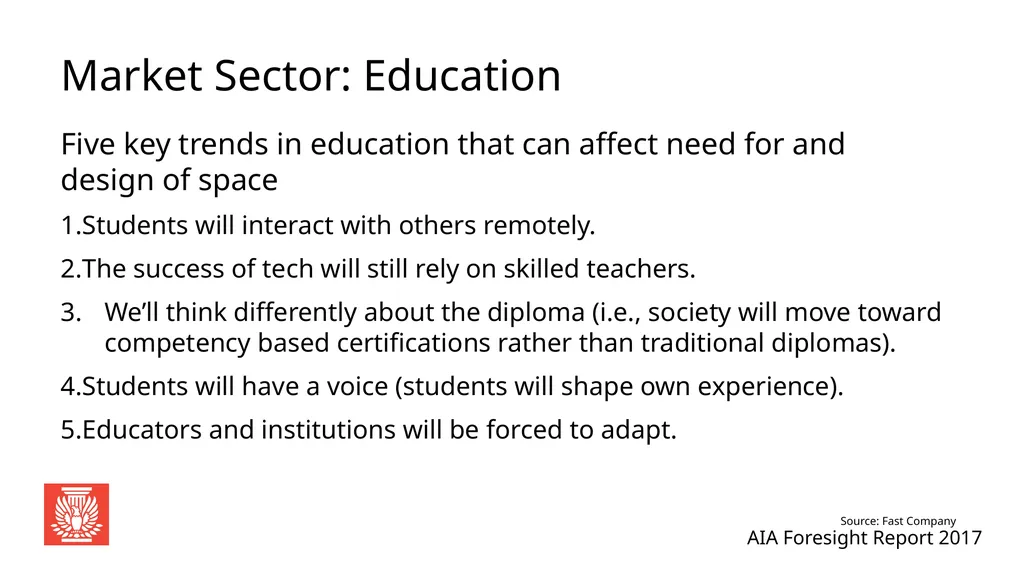
slide12. Market Sector: Education Five key trends in education that can affect need for and design of space
Students will interact with others remotely.
The success of tech will still rely on skilled teachers.
We’ll think differently about the diploma (i.e., society will move toward competency based certifications rather than traditional diplomas).
Students will have a voice (students will shape own experience).
Educators and institutions will be forced to adapt. Source: Fast Company<br>
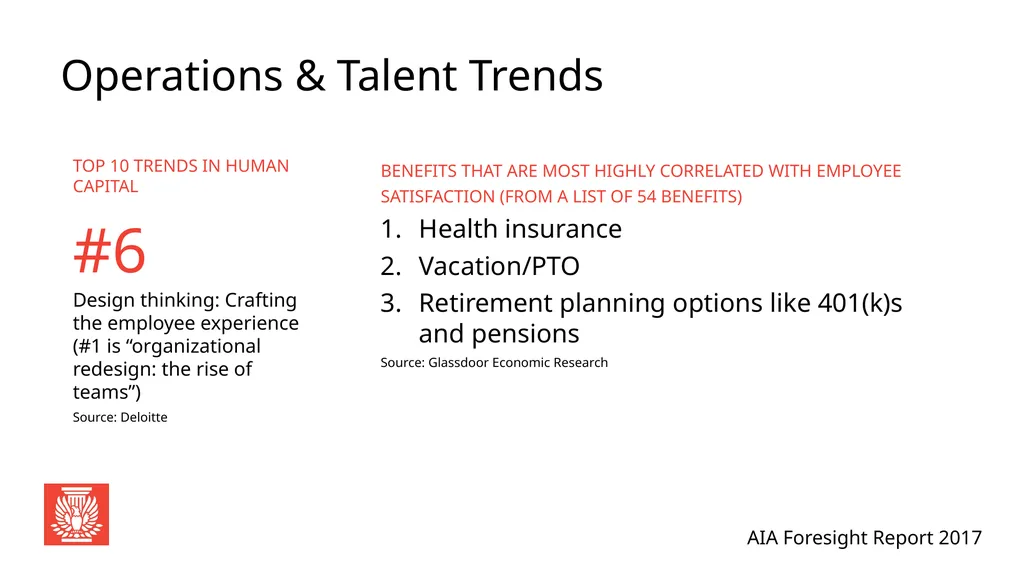
slide13. Operations & Talent Trends TOP 10 TRENDS IN HUMAN CAPITAL
#6
Design thinking: Crafting the employee experience
(#1 is “organizational redesign: the rise of teams”)
Source: Deloitte BENEFITS THAT ARE MOST HIGHLY CORRELATED WITH EMPLOYEE SATISFACTION (FROM A LIST OF 54 BENEFITS)
Health insurance
Vacation/PTO
Retirement planning options like 401(k)s and pensions
Source: Glassdoor Economic Research<br>
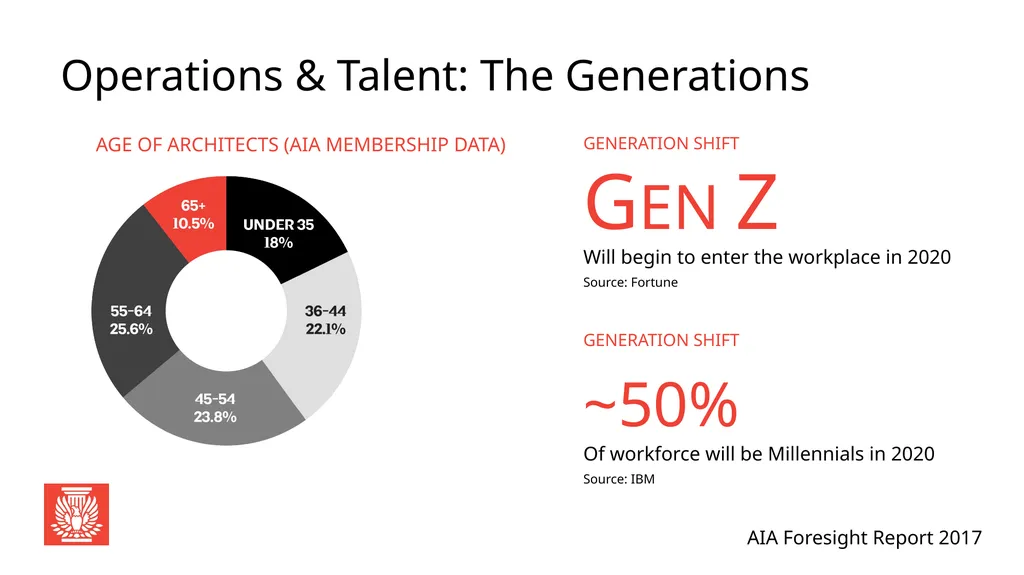
slide14. Operations & Talent: The Generations GENERATION SHIFT
Gen Z
Will begin to enter the workplace in 2020
Source: Fortune GENERATION SHIFT
~50%
Of workforce will be Millennials in 2020
Source: IBM<br>
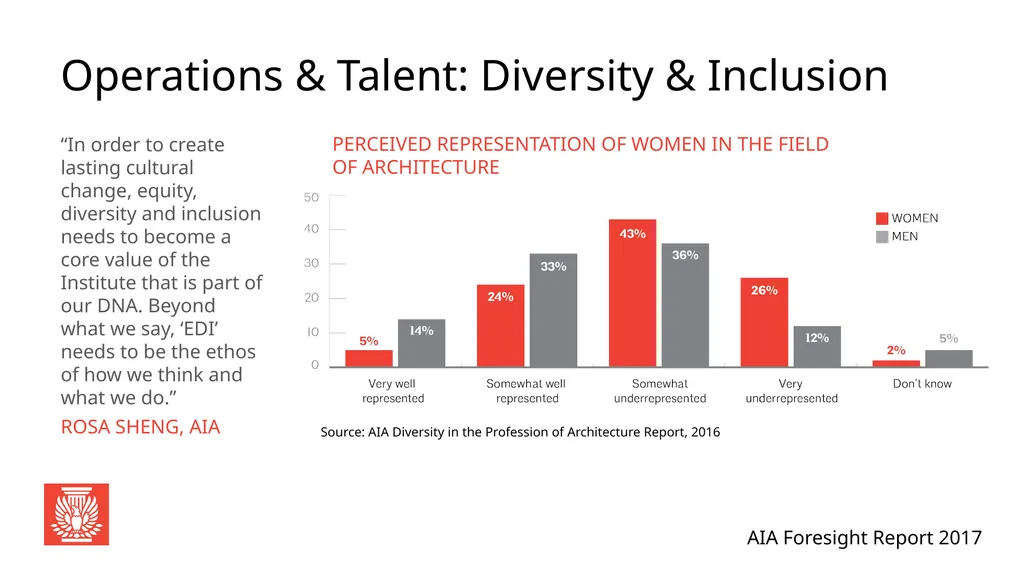
slide15. Operations & Talent: Diversity & Inclusion “In order to create lasting cultural change, equity, diversity and inclusion needs to become a core value of the Institute that is part of our DNA. Beyond what we say, ‘EDI’ needs to be the ethos of how we think and what we do.”
ROSA SHENG, AIA Source: AIA Diversity in the Profession of Architecture Report, 2016<br>
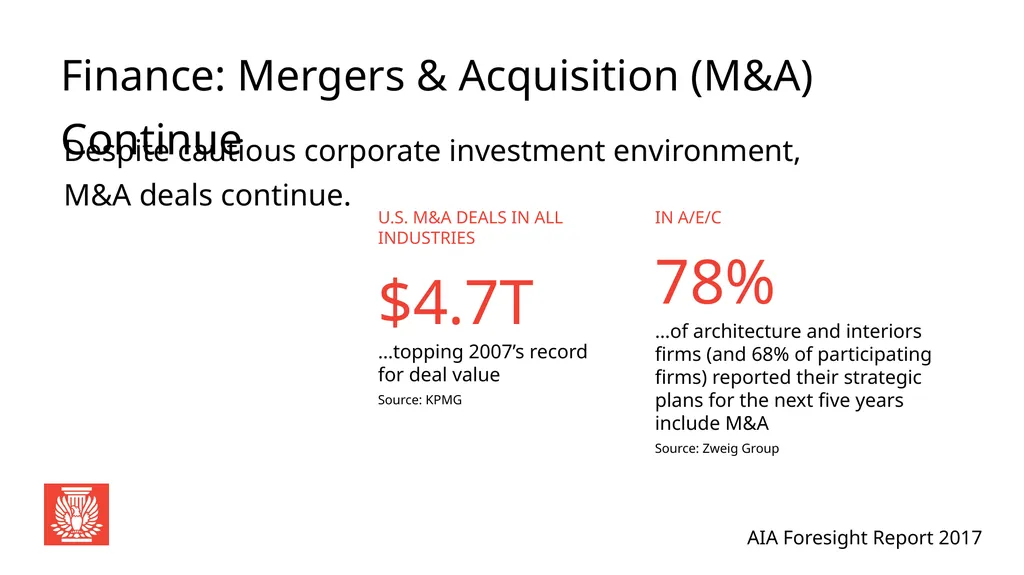
slide16. Finance: Mergers & Acquisition (M&A) Continue Despite cautious corporate investment environment, M&A deals continue. U.S. M&A DEALS IN ALL INDUSTRIES
$4.7t
…topping 2007’s record for deal value
Source: KPMG IN A/E/C
78%
…of architecture and interiors firms (and 68% of participating firms) reported their strategic plans for the next five years include M&A
Source: Zweig Group<br>
slide17. What’s Changed Since the Great Recession? More services for same fees during Great Recession “trains” clients to expect more
Change in scale of projects pursued by smaller and larger firms alike
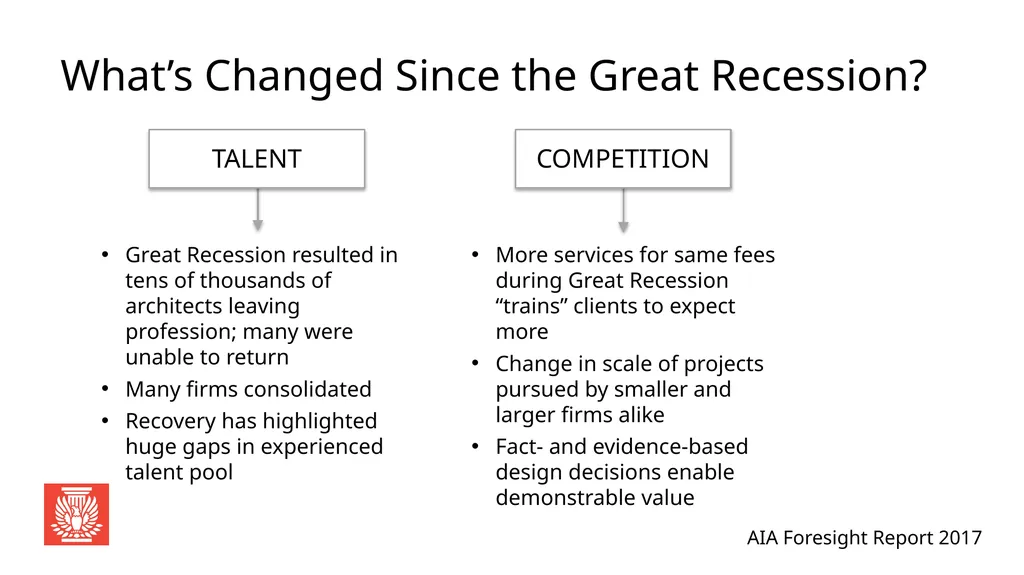
Fact- and evidence-based design decisions enable demonstrable value Great Recession resulted in tens of thousands of architects leaving profession; many were unable to return
Many firms consolidated
Recovery has highlighted huge gaps in experienced talent pool<br>
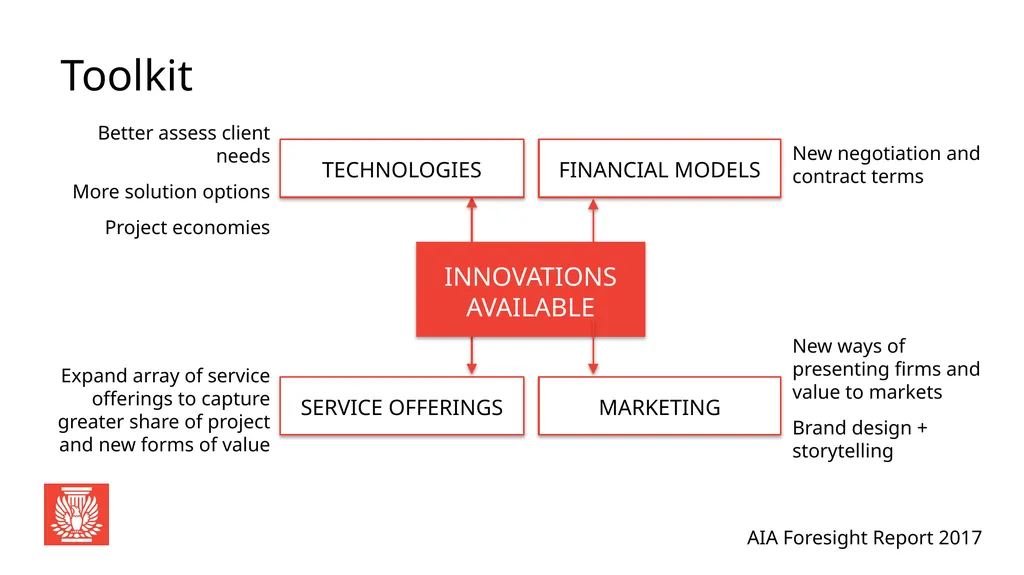
slide18. Toolkit Better assess client needs
More solution options
Project economies Expand array of service offerings to capture greater share of project and new forms of value New negotiation and contract terms New ways of presenting firms and value to markets
Brand design + storytelling<br>
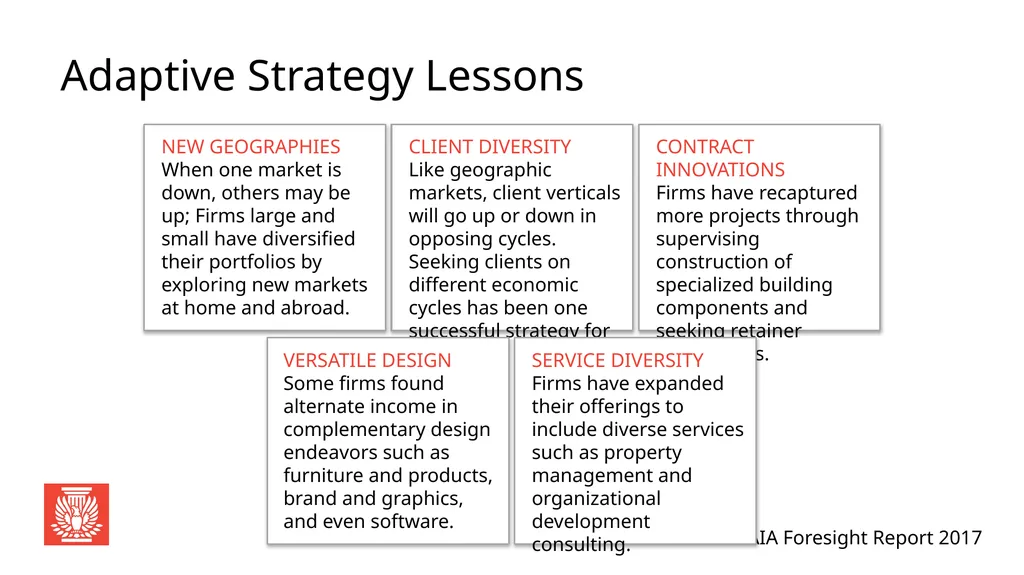
slide19. Adaptive Strategy Lessons<br>
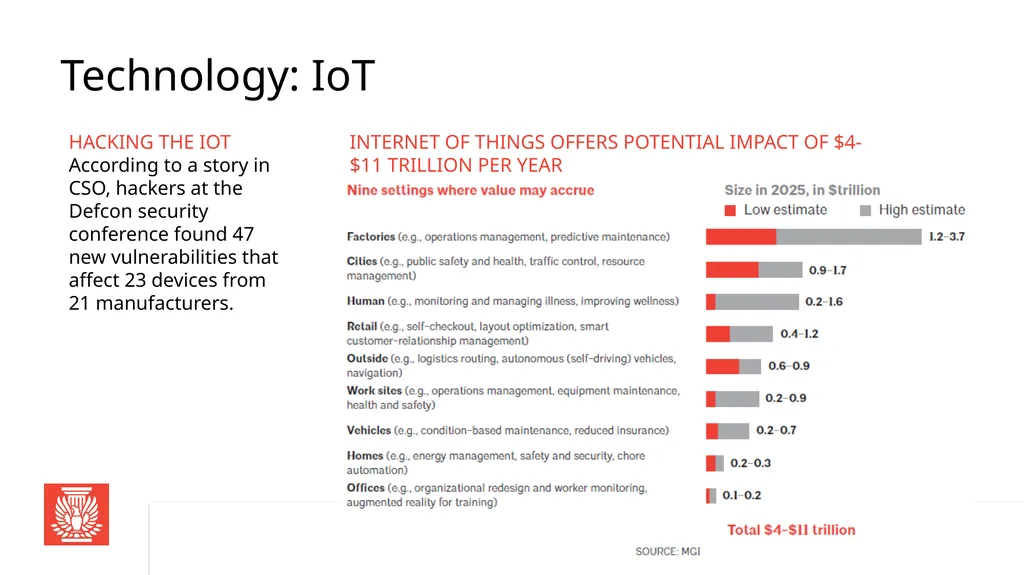
slide20. Technology: IoT HACKING THE IOT
According to a story in CSO, hackers at the
Defcon security conference found 47 new vulnerabilities that affect 23 devices from 21 manufacturers. INTERNET OF THINGS OFFERS POTENTIAL IMPACT OF $4-$11 TRILLION PER YEAR<br>
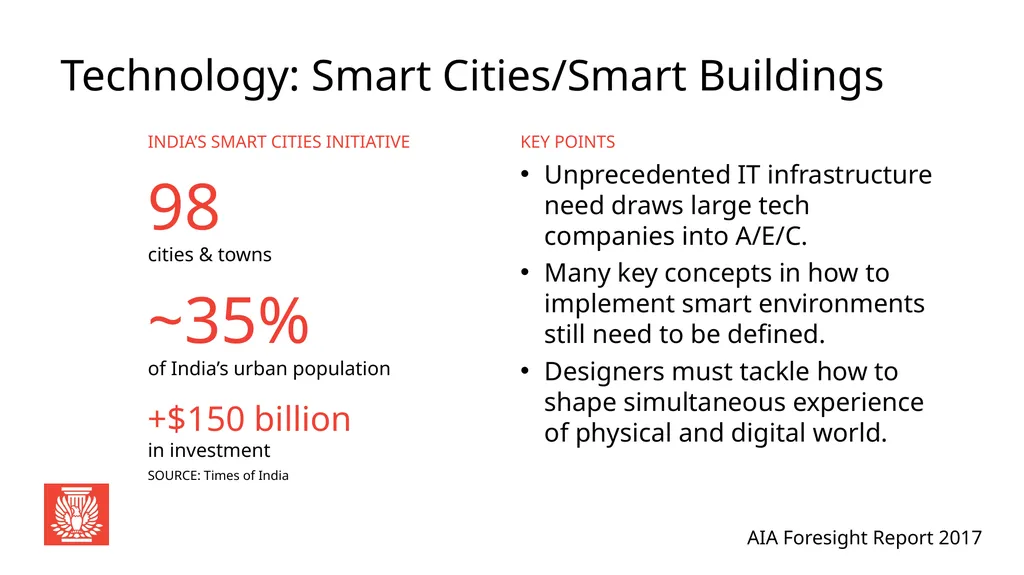
slide21. Technology: Smart Cities/Smart Buildings India’s smart cities Initiative
98
cities & towns
~35%
of India’s urban population
+$150 billion
in investment
SOURCE: Times of India KEY POINTS
Unprecedented IT infrastructure need draws large tech companies into A/E/C.
Many key concepts in how to implement smart environments still need to be defined.
Designers must tackle how to shape simultaneous experience of physical and digital world.<br>
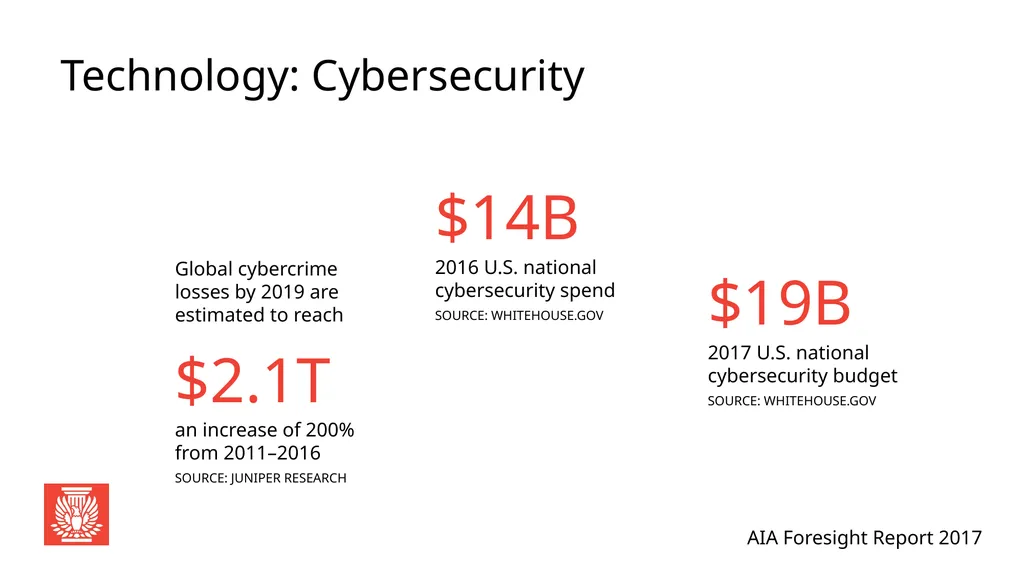
slide22. Technology: Cybersecurity Global cybercrime losses by 2019 are estimated to reach
$2.1t
an increase of 200%
from 2011–2016
SOURCE: JUNIPER RESEARCH $14b
2016 U.S. national cybersecurity spend
SOURCE: WHITEHOUSE.GOV $19b
2017 U.S. national cybersecurity budget
SOURCE: WHITEHOUSE.GOV<br>
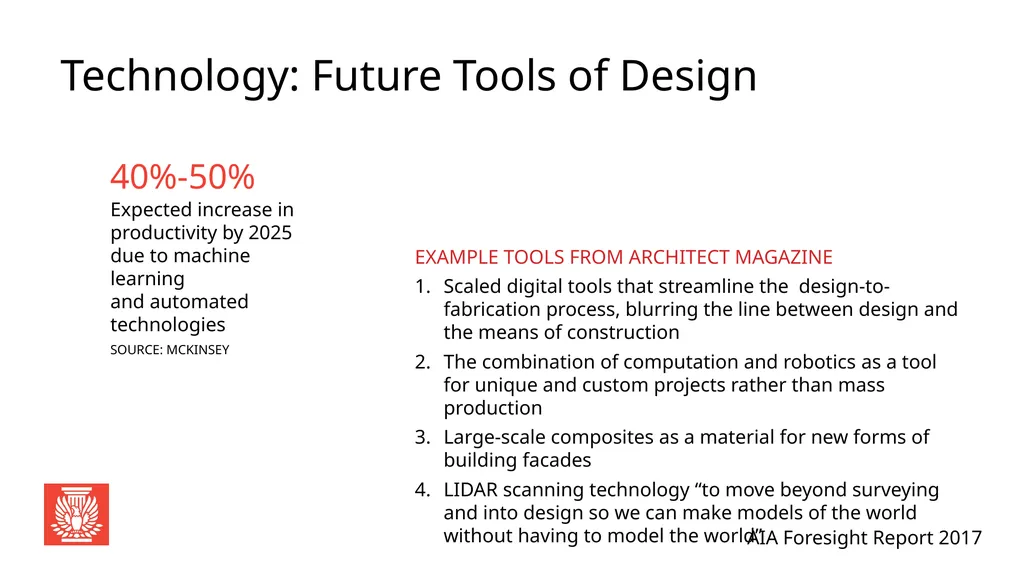
slide23. Technology: Future Tools of Design 40%-50%
Expected increase in productivity by 2025 due to machine learning
and automated technologies
SOURCE: MCKINSEY EXAMPLE TOOLS FROM ARCHITECT MAGAZINE
Scaled digital tools that streamline the design-to-fabrication process, blurring the line between design and the means of construction
The combination of computation and robotics as a tool for unique and custom projects rather than mass production
Large-scale composites as a material for new forms of building facades
LIDAR scanning technology “to move beyond surveying and into design so we can make models of the world without having to model the world”<br>
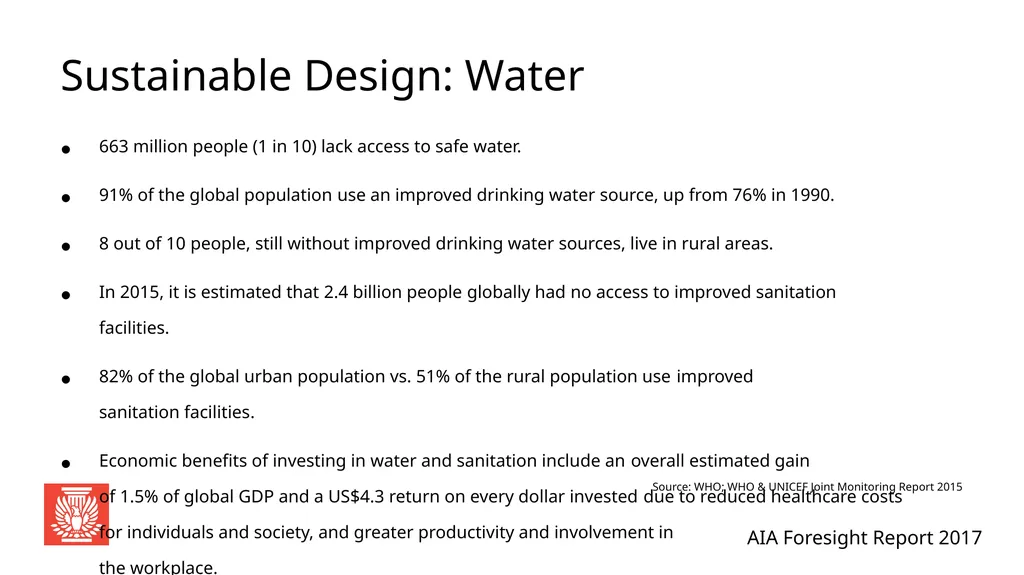
slide24. Sustainable Design: Water 663 million people (1 in 10) lack access to safe water.
91% of the global population use an improved drinking water source, up from 76% in 1990.
8 out of 10 people, still without improved drinking water sources, live in rural areas.
In 2015, it is estimated that 2.4 billion people globally had no access to improved sanitation facilities.
82% of the global urban population vs. 51% of the rural population use improved sanitation facilities.
Economic benefits of investing in water and sanitation include an overall estimated gain of 1.5% of global GDP and a US$4.3 return on every dollar invested due to reduced healthcare costs for individuals and society, and greater productivity and involvement in the workplace. Source: WHO; WHO & UNICEF Joint Monitoring Report 2015<br>
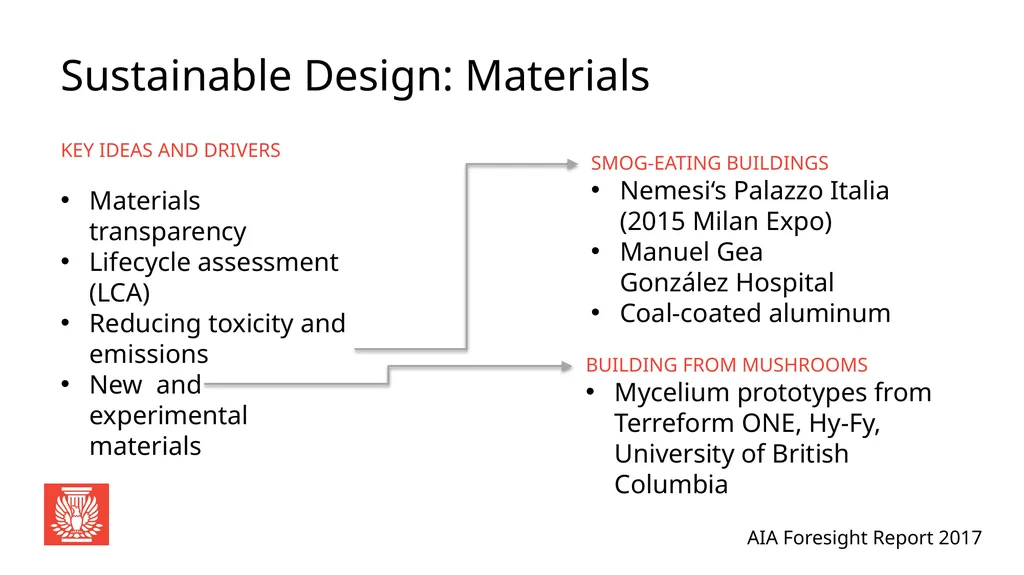
slide25. Sustainable Design: Materials Key ideas and drivers
Materials transparency
Lifecycle assessment (LCA)
Reducing toxicity and emissions
New and experimental materials Smog-eating buildings
Nemesi‘s Palazzo Italia (2015 Milan Expo)
Manuel Gea González Hospital
Coal-coated aluminum Building from mushrooms
Mycelium prototypes from Terreform ONE, Hy-Fy, University of British Columbia<br>
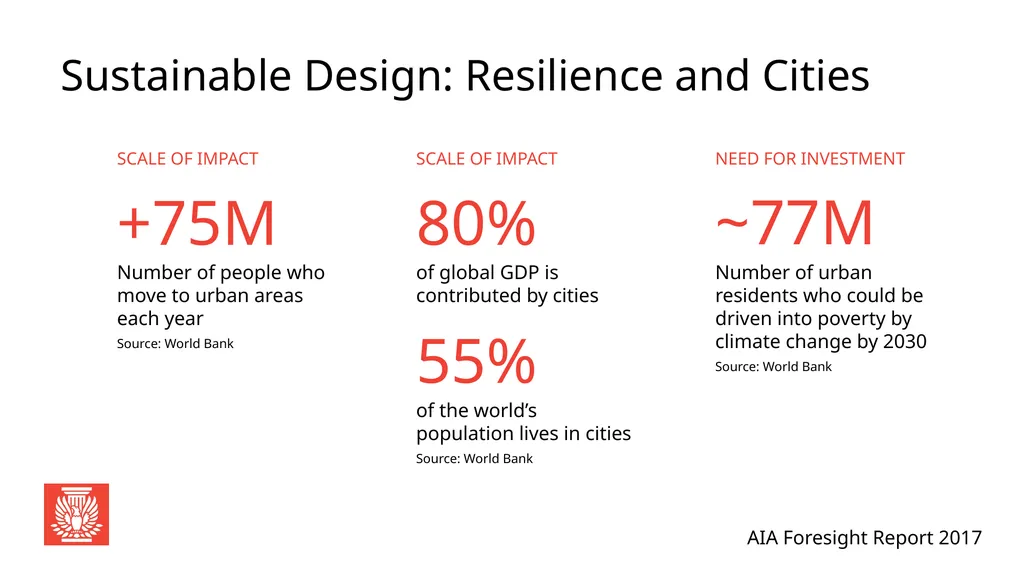
slide26. Sustainable Design: Resilience and Cities SCALE OF IMPACT
80%
of global GDP is contributed by cities
55%
of the world’s population lives in cities
Source: World Bank SCALE OF IMPACT
+75m
Number of people who move to urban areas each year
Source: World Bank NEED FOR INVESTMENT
~77m
Number of urban residents who could be driven into poverty by climate change by 2030
Source: World Bank<br>
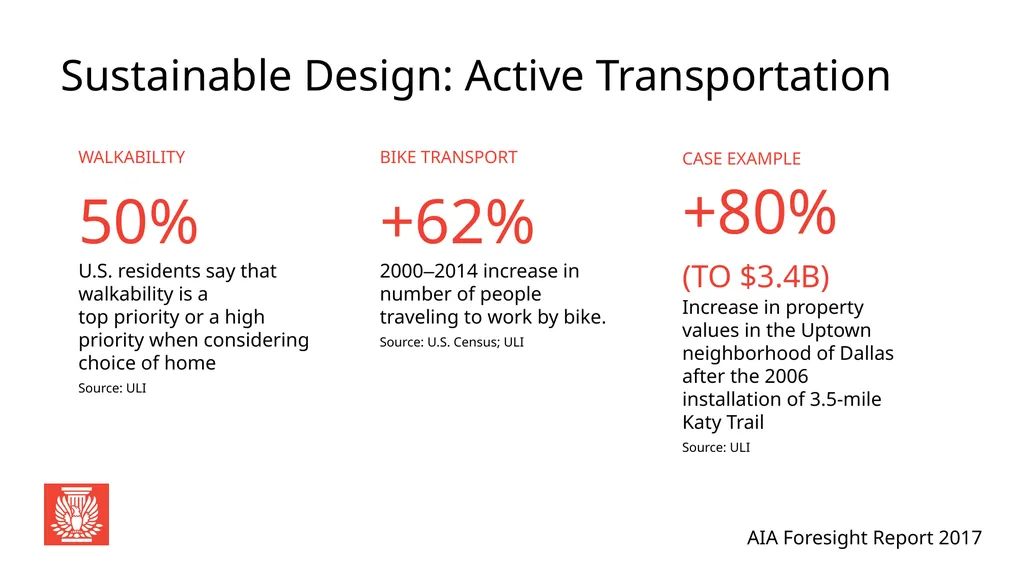
slide27. Sustainable Design: Active Transportation WALKABILITY
50%
U.S. residents say that walkability is a
top priority or a high priority when considering choice of home
Source: ULI BIKE TRANSPORT
+62%
2000–2014 increase in number of people traveling to work by bike.
Source: U.S. Census; ULI CASE EXAMPLE
+80%
(to $3.4b)
Increase in property values in the Uptown neighborhood of Dallas after the 2006 installation of 3.5-mile Katy Trail
Source: ULI<br>
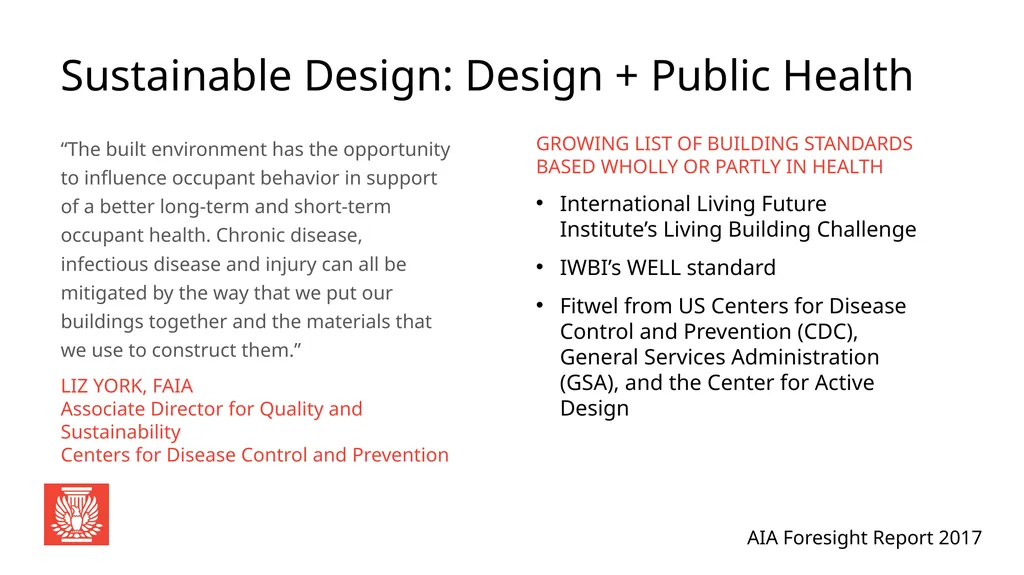
slide28. Sustainable Design: Design + Public Health GROWING LIST OF BUILDING STANDARDS BASED WHOLLY OR PARTLY IN HEALTH
International Living Future Institute’s Living Building Challenge
IWBI’s WELL standard
Fitwel from US Centers for Disease Control and Prevention (CDC), General Services Administration (GSA), and the Center for Active Design “The built environment has the opportunity to influence occupant behavior in support of a better long-term and short-term occupant health. Chronic disease, infectious disease and injury can all be mitigated by the way that we put our buildings together and the materials that we use to construct them.”
LIZ YORK, FAIA
Associate Director for Quality and Sustainability
Centers for Disease Control and Prevention<br>
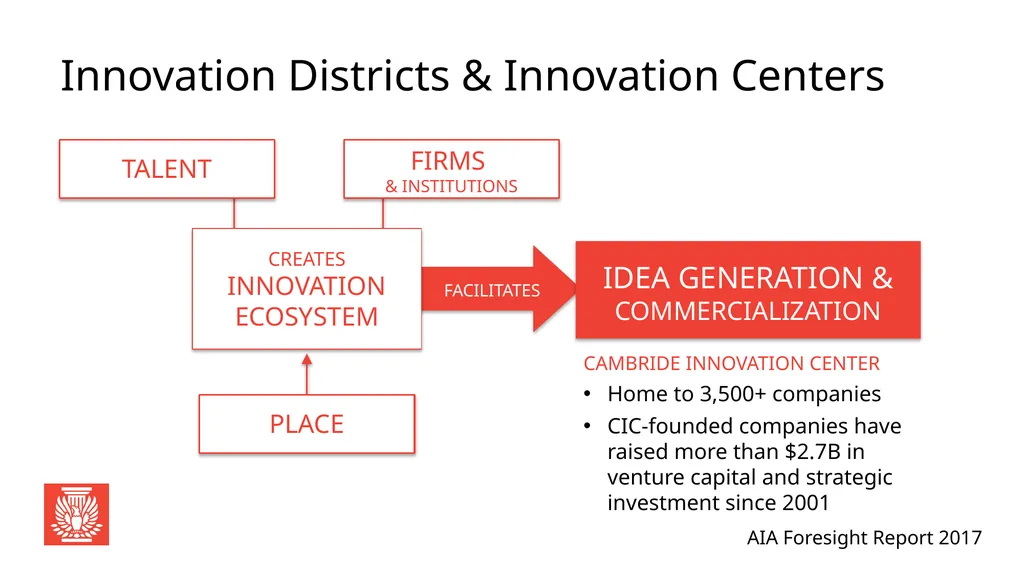
slide29. Innovation Districts & Innovation Centers Idea generation & commercialization Facilitates CAMBRIDE INNOVATION CENTER
Home to 3,500+ companies
CIC-founded companies have raised more than $2.7B in venture capital and strategic investment since 2001<br>
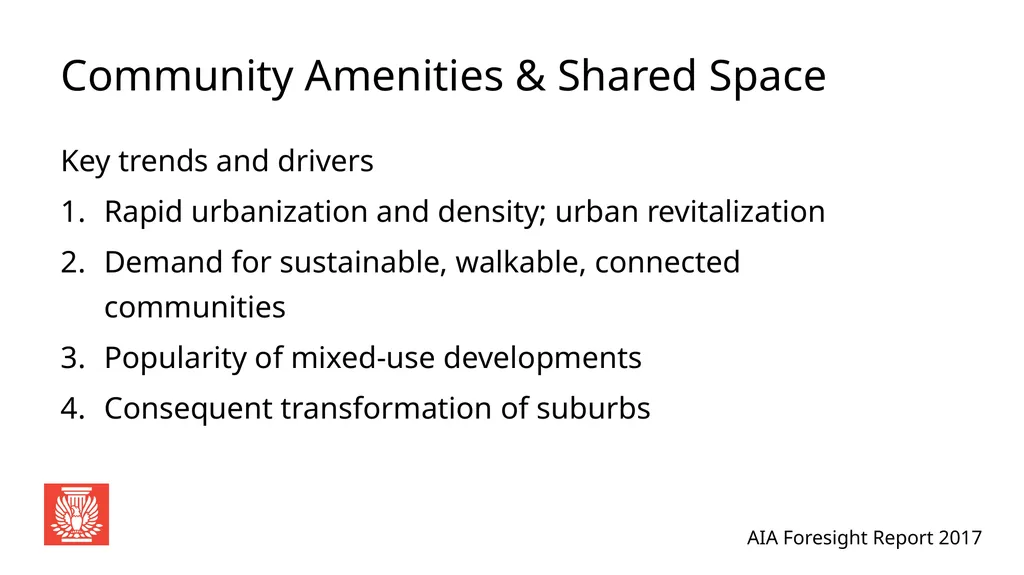
slide30. Community Amenities & Shared Space Key trends and drivers
Rapid urbanization and density; urban revitalization
Demand for sustainable, walkable, connected communities
Popularity of mixed-use developments
Consequent transformation of suburbs<br>
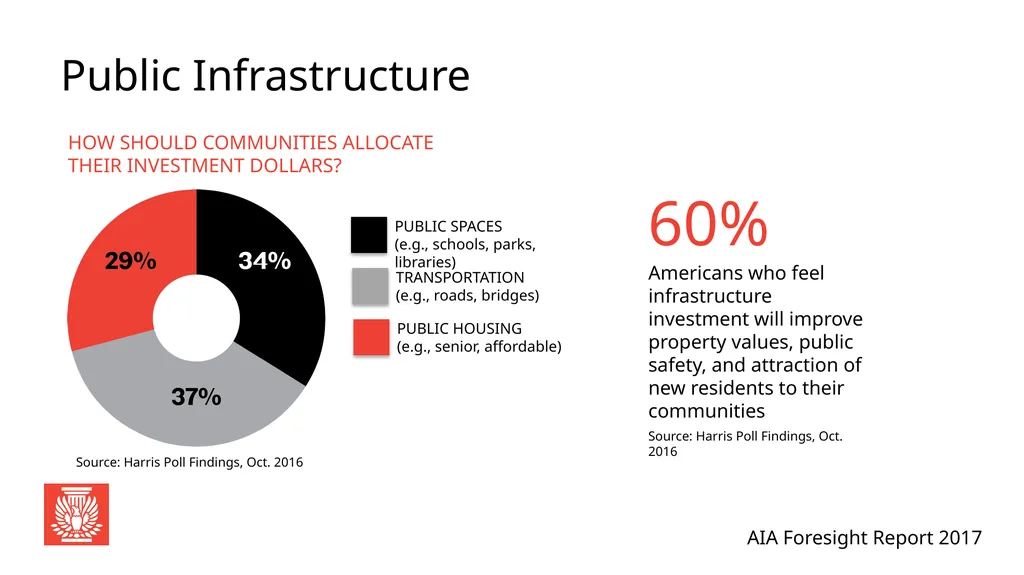
slide31. Public Infrastructure How should communities allocate their investment dollars? 60%
Americans who feel infrastructure investment will improve property values, public safety, and attraction of new residents to their communities
Source: Harris Poll Findings, Oct. 2016 Source: Harris Poll Findings, Oct. 2016<br>
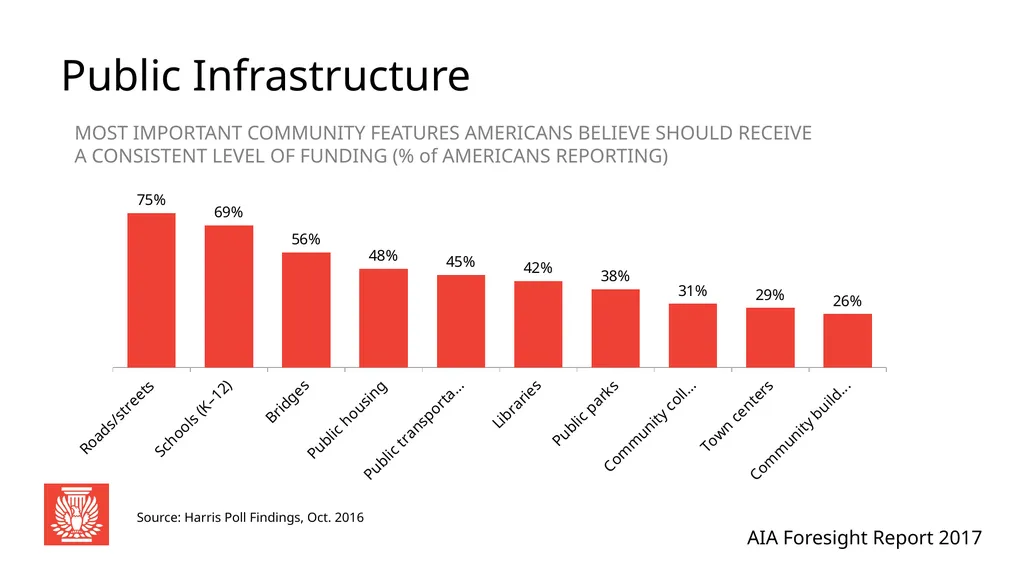
slide32. Public Infrastructure MOST IMPORTANT COMMUNITY FEATURES AMERICANS BELIEVE SHOULD RECEIVE A CONSISTENT LEVEL OF FUNDING (% of AMERICANS REPORTING) Source: Harris Poll Findings, Oct. 2016<br>
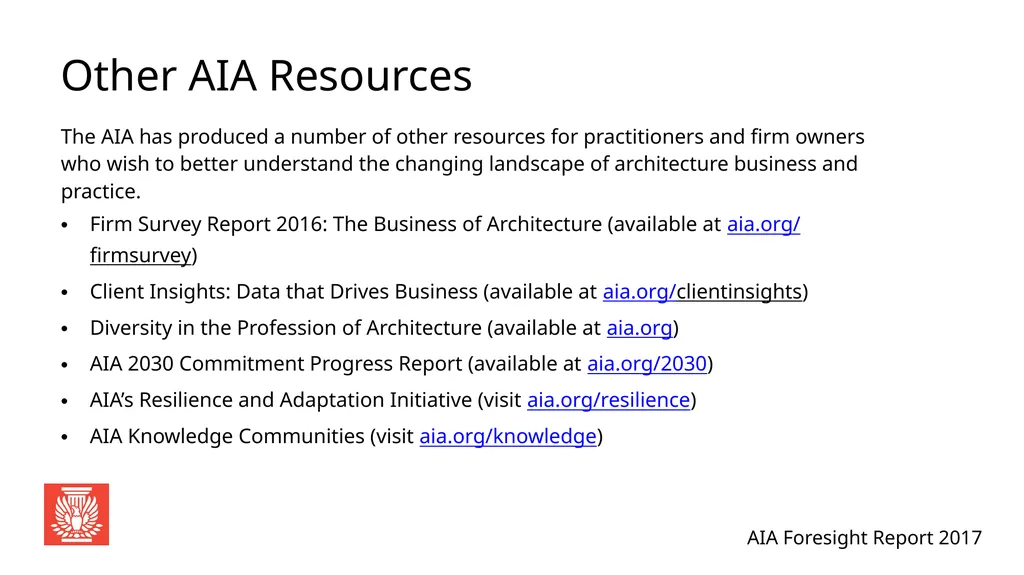
slide33. Other AIA Resources The AIA has produced a number of other resources for practitioners and firm owners who wish to better understand the changing landscape of architecture business and practice.
Firm Survey Report 2016: The Business of Architecture (available at aia.org/firmsurvey)
Client Insights: Data that Drives Business (available at aia.org/clientinsights)
Diversity in the Profession of Architecture (available at aia.org)
AIA 2030 Commitment Progress Report (available at aia.org/2030)
AIA’s Resilience and Adaptation Initiative (visit aia.org/resilience)
AIA Knowledge Communities (visit aia.org/knowledge)<br>
slide2. Global Perspective: Challenge and Change GEOPOLITICAL SHIFTS
121
Countries changed heads of state or senior-most leaders between 2015 and 2016
Source: U.S. State Department SECURITY & MILITARY
$1.76t
Global national security spending (2015)
Source: Stockholm International Peace Research Institute POPULATION FLOWS
244m
Number of international migrants worldwide in 2015
(3.3% of global population)
Source: United Nations<br>
slide3. According to the World Economic Forum, the U.S. is the third most competitive global economy behind Switzerland and Singapore.
Source: World Economic Forum Despite sluggish performance in recent years, seven of the 10 most competitive global economies are located in Europe.
Source: World Economic Forum Eight of the top 10 container ports, as measured by throughput of twenty-foot equivalent units (TEUs), are in China
Source: CIA India is the world’s fourth largest IT start-up hub with more than 3,100 tech startups in 2015 alone.
Source: Forbes By 2050, the working age population (ages 15–64) in sub-Saharan Africa is projected to reach 1.25 billion, which is triple its current amount.
Source: IMF The top three growth economies (projected 2014– 2018) are:
Peru (5.4%)
Columbia (4.7%)
Chile (4.0%)
Source: Brookings Institution, FocusData Global Perspective: Overview<br>
slide4. United States: Social & Demographic Change Two-parent households declined from 87% in 1960 to 69% in 2016.
Roughly 17% of kids in the U.S. currently live in blended families.
By 2055, the U.S. will not have a single racial or ethnic majority.
59 million immigrants have come to the country since the middle 1960s.<br>
slide5. Health of A/E/C<br>
slide6. The Big Picture: Collaboration COLLABORATIVE CONTRACTS?
5%
Percentage of billings earned through providing IPD services (2015 responses)*
Source: 2016 AIA Firm Survey Report NEED FOR COLLABORATION
20%
Percentage of typical large project in mining, infrastructure and oil and gas construction that runs over schedule
Source: McKinsey & Company NEED FOR COLLABORATION
80%
Percentage of typical large project in mining, infrastructure and oil and gas construction that runs over budget
Source: McKinsey & Company<br>
slide7. Consumer Trends & Preferences Key indicator for economic health
Paradoxical trends: hyper-customization, instant gratification, experience-focus, sharing economy
3D printing predicted by some to play key role in customization CROWDFUNDING TOTAL BY 2025
$96b
Half is expected to come from China.
Source: The Guardian<br>
slide8. Market Sector: Retail Coming together of tech, traditional retail, experience, and culture<br>
slide9. Market Sector: Residential Housing the generations Millennial families
Millennials are now the largest generation.
62% of millennials believe they will one day own a detached single-family home.
14% millennials live in multi- generational homes. Aging boomers
10,000 baby boomers turn 65 each day.
Relatively wealthy and healthy generation of retirees who will likely redefine retirement as more active and engaged phase of life.<br>
slide10. Market Sector: Healthcare Leading Change Growth in scale and impact + change in industry By 2025, healthcare insurance and services is predicted to be the world’s largest retail market
Source: AFLAC TALENT DEMAND
12.9m
Projected global shortage of healthcare professionals by 2035
Source: WHO
7 of the 10
occupations expected to grow the fastest between 2014-2024 relate to healthcare.
Source: U.S. Bureau of Labor Statistics ALTERNATIVE DELIVERY
43%
Respondents who got an EKG at home (results sent via phone by their doctor)
34%
of respondents got an MRI at a retail clinic or pharmacy
Source: PwC<br>
slide11. Market Sector: Workplace Push toward flexibility, balance, and experience Workplace redefined
Forbes’ number one workplace trend for 2017 is the increasing demand for improved employee and candidate experience.
Only 11% of respondents to a Steelcase survey were highly satisfied with their work environment. COWORKING SPACES: PREDICTED INCREASE<br>
slide12. Market Sector: Education Five key trends in education that can affect need for and design of space
Students will interact with others remotely.
The success of tech will still rely on skilled teachers.
We’ll think differently about the diploma (i.e., society will move toward competency based certifications rather than traditional diplomas).
Students will have a voice (students will shape own experience).
Educators and institutions will be forced to adapt. Source: Fast Company<br>
slide13. Operations & Talent Trends TOP 10 TRENDS IN HUMAN CAPITAL
#6
Design thinking: Crafting the employee experience
(#1 is “organizational redesign: the rise of teams”)
Source: Deloitte BENEFITS THAT ARE MOST HIGHLY CORRELATED WITH EMPLOYEE SATISFACTION (FROM A LIST OF 54 BENEFITS)
Health insurance
Vacation/PTO
Retirement planning options like 401(k)s and pensions
Source: Glassdoor Economic Research<br>
slide14. Operations & Talent: The Generations GENERATION SHIFT
Gen Z
Will begin to enter the workplace in 2020
Source: Fortune GENERATION SHIFT
~50%
Of workforce will be Millennials in 2020
Source: IBM<br>
slide15. Operations & Talent: Diversity & Inclusion “In order to create lasting cultural change, equity, diversity and inclusion needs to become a core value of the Institute that is part of our DNA. Beyond what we say, ‘EDI’ needs to be the ethos of how we think and what we do.”
ROSA SHENG, AIA Source: AIA Diversity in the Profession of Architecture Report, 2016<br>
slide16. Finance: Mergers & Acquisition (M&A) Continue Despite cautious corporate investment environment, M&A deals continue. U.S. M&A DEALS IN ALL INDUSTRIES
$4.7t
…topping 2007’s record for deal value
Source: KPMG IN A/E/C
78%
…of architecture and interiors firms (and 68% of participating firms) reported their strategic plans for the next five years include M&A
Source: Zweig Group<br>
slide17. What’s Changed Since the Great Recession? More services for same fees during Great Recession “trains” clients to expect more
Change in scale of projects pursued by smaller and larger firms alike
Fact- and evidence-based design decisions enable demonstrable value Great Recession resulted in tens of thousands of architects leaving profession; many were unable to return
Many firms consolidated
Recovery has highlighted huge gaps in experienced talent pool<br>
slide18. Toolkit Better assess client needs
More solution options
Project economies Expand array of service offerings to capture greater share of project and new forms of value New negotiation and contract terms New ways of presenting firms and value to markets
Brand design + storytelling<br>
slide19. Adaptive Strategy Lessons<br>
slide20. Technology: IoT HACKING THE IOT
According to a story in CSO, hackers at the
Defcon security conference found 47 new vulnerabilities that affect 23 devices from 21 manufacturers. INTERNET OF THINGS OFFERS POTENTIAL IMPACT OF $4-$11 TRILLION PER YEAR<br>
slide21. Technology: Smart Cities/Smart Buildings India’s smart cities Initiative
98
cities & towns
~35%
of India’s urban population
+$150 billion
in investment
SOURCE: Times of India KEY POINTS
Unprecedented IT infrastructure need draws large tech companies into A/E/C.
Many key concepts in how to implement smart environments still need to be defined.
Designers must tackle how to shape simultaneous experience of physical and digital world.<br>
slide22. Technology: Cybersecurity Global cybercrime losses by 2019 are estimated to reach
$2.1t
an increase of 200%
from 2011–2016
SOURCE: JUNIPER RESEARCH $14b
2016 U.S. national cybersecurity spend
SOURCE: WHITEHOUSE.GOV $19b
2017 U.S. national cybersecurity budget
SOURCE: WHITEHOUSE.GOV<br>
slide23. Technology: Future Tools of Design 40%-50%
Expected increase in productivity by 2025 due to machine learning
and automated technologies
SOURCE: MCKINSEY EXAMPLE TOOLS FROM ARCHITECT MAGAZINE
Scaled digital tools that streamline the design-to-fabrication process, blurring the line between design and the means of construction
The combination of computation and robotics as a tool for unique and custom projects rather than mass production
Large-scale composites as a material for new forms of building facades
LIDAR scanning technology “to move beyond surveying and into design so we can make models of the world without having to model the world”<br>
slide24. Sustainable Design: Water 663 million people (1 in 10) lack access to safe water.
91% of the global population use an improved drinking water source, up from 76% in 1990.
8 out of 10 people, still without improved drinking water sources, live in rural areas.
In 2015, it is estimated that 2.4 billion people globally had no access to improved sanitation facilities.
82% of the global urban population vs. 51% of the rural population use improved sanitation facilities.
Economic benefits of investing in water and sanitation include an overall estimated gain of 1.5% of global GDP and a US$4.3 return on every dollar invested due to reduced healthcare costs for individuals and society, and greater productivity and involvement in the workplace. Source: WHO; WHO & UNICEF Joint Monitoring Report 2015<br>
slide25. Sustainable Design: Materials Key ideas and drivers
Materials transparency
Lifecycle assessment (LCA)
Reducing toxicity and emissions
New and experimental materials Smog-eating buildings
Nemesi‘s Palazzo Italia (2015 Milan Expo)
Manuel Gea González Hospital
Coal-coated aluminum Building from mushrooms
Mycelium prototypes from Terreform ONE, Hy-Fy, University of British Columbia<br>
slide26. Sustainable Design: Resilience and Cities SCALE OF IMPACT
80%
of global GDP is contributed by cities
55%
of the world’s population lives in cities
Source: World Bank SCALE OF IMPACT
+75m
Number of people who move to urban areas each year
Source: World Bank NEED FOR INVESTMENT
~77m
Number of urban residents who could be driven into poverty by climate change by 2030
Source: World Bank<br>
slide27. Sustainable Design: Active Transportation WALKABILITY
50%
U.S. residents say that walkability is a
top priority or a high priority when considering choice of home
Source: ULI BIKE TRANSPORT
+62%
2000–2014 increase in number of people traveling to work by bike.
Source: U.S. Census; ULI CASE EXAMPLE
+80%
(to $3.4b)
Increase in property values in the Uptown neighborhood of Dallas after the 2006 installation of 3.5-mile Katy Trail
Source: ULI<br>
slide28. Sustainable Design: Design + Public Health GROWING LIST OF BUILDING STANDARDS BASED WHOLLY OR PARTLY IN HEALTH
International Living Future Institute’s Living Building Challenge
IWBI’s WELL standard
Fitwel from US Centers for Disease Control and Prevention (CDC), General Services Administration (GSA), and the Center for Active Design “The built environment has the opportunity to influence occupant behavior in support of a better long-term and short-term occupant health. Chronic disease, infectious disease and injury can all be mitigated by the way that we put our buildings together and the materials that we use to construct them.”
LIZ YORK, FAIA
Associate Director for Quality and Sustainability
Centers for Disease Control and Prevention<br>
slide29. Innovation Districts & Innovation Centers Idea generation & commercialization Facilitates CAMBRIDE INNOVATION CENTER
Home to 3,500+ companies
CIC-founded companies have raised more than $2.7B in venture capital and strategic investment since 2001<br>
slide30. Community Amenities & Shared Space Key trends and drivers
Rapid urbanization and density; urban revitalization
Demand for sustainable, walkable, connected communities
Popularity of mixed-use developments
Consequent transformation of suburbs<br>
slide31. Public Infrastructure How should communities allocate their investment dollars? 60%
Americans who feel infrastructure investment will improve property values, public safety, and attraction of new residents to their communities
Source: Harris Poll Findings, Oct. 2016 Source: Harris Poll Findings, Oct. 2016<br>
slide32. Public Infrastructure MOST IMPORTANT COMMUNITY FEATURES AMERICANS BELIEVE SHOULD RECEIVE A CONSISTENT LEVEL OF FUNDING (% of AMERICANS REPORTING) Source: Harris Poll Findings, Oct. 2016<br>
slide33. Other AIA Resources The AIA has produced a number of other resources for practitioners and firm owners who wish to better understand the changing landscape of architecture business and practice.
Firm Survey Report 2016: The Business of Architecture (available at aia.org/firmsurvey)
Client Insights: Data that Drives Business (available at aia.org/clientinsights)
Diversity in the Profession of Architecture (available at aia.org)
AIA 2030 Commitment Progress Report (available at aia.org/2030)
AIA’s Resilience and Adaptation Initiative (visit aia.org/resilience)
AIA Knowledge Communities (visit aia.org/knowledge)<br>