Analyzing Data Office of Assessment and Planning for SEES November 2018 The next step in the process of data assessment is to analyze. Its time to manipulate your data and find out what improvements to student learning can be made. I
"Analyzing Data Office of Assessment and Planning" is the property of its rightful owner. Permission is granted to
download and print the materials on this website for personal, non-commercial use only, and to display it
on your personal computer provided you do not modify the materials and that you retain all copyright
notices contained in the materials. By downloading content from our website, you accept the terms of this
agreement.
Presentation Transcript
01
Analyzing Data Office of Assessment and Planning for SEES November 2018<br>
02
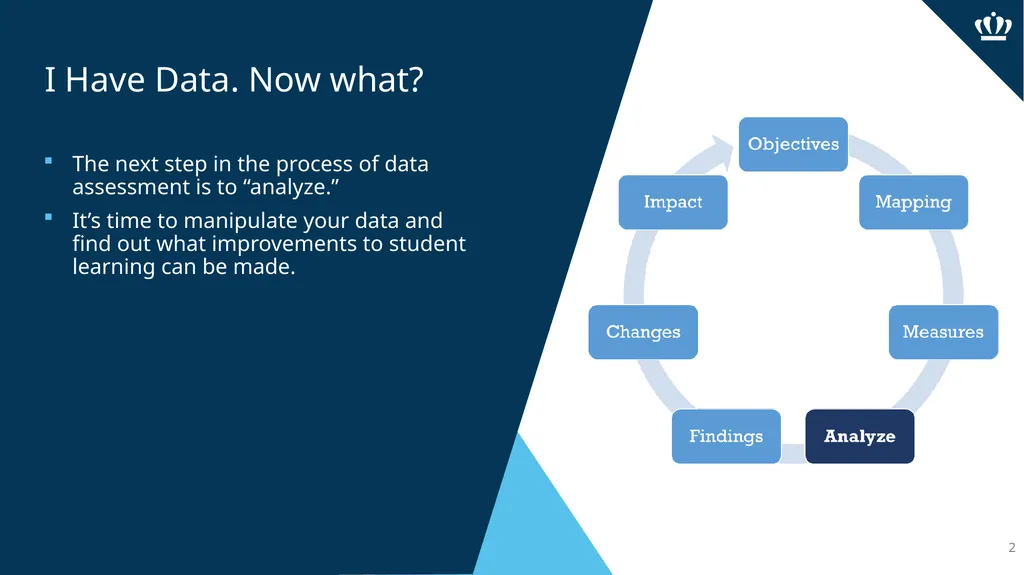
The next step in the process of data assessment is to “analyze.”
It’s time to manipulate your data and find out what improvements to student learning can be made. I Have Data. Now what? 2<br>
03
SCRUB!
Find, change, or remove any data that is incorrect, duplicated, incomplete, or redundant.
Look for typos, missing data, and inconsistencies
Remember, your computer is not a human. It can only analyze the information you give it, so protect your data’s integrity by reviewing it thoroughly. What is data integrity?
Maintaining the accuracy, trustworthiness, and consistency of data over its entire life cycle.
Why is it important?
You use data to make decisions. Ensuring your data are accurate allows you to make an informed decision. Before You Do Anything…SCRUB! 3<br>
04
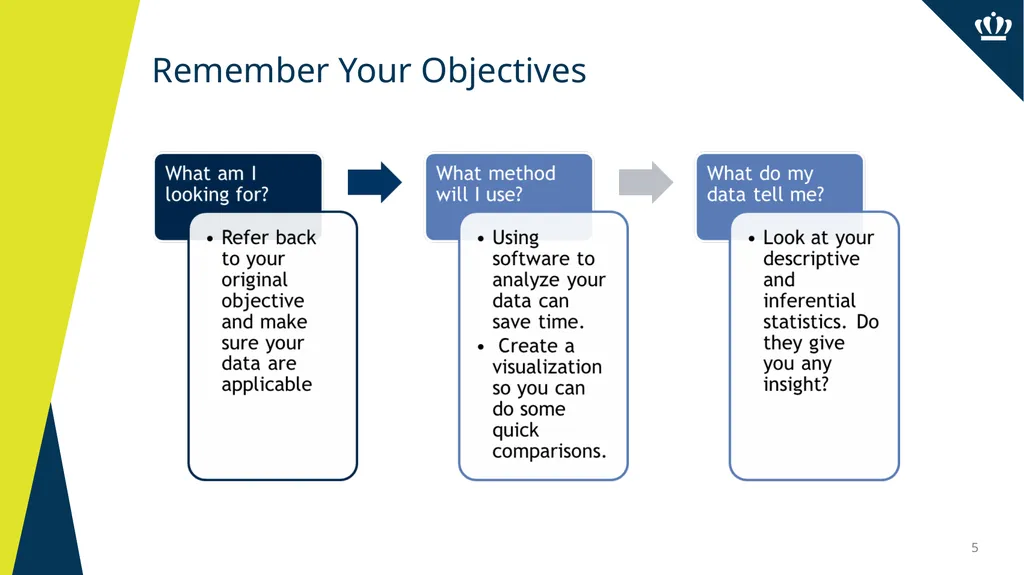
Remember Your Objectives When analyzing data, it is important to keep in mind your original research question or objective.
Data analysis is the most labor intensive part of the entire assessment process
Ensure the software or method that you plan to use to analyze your data is appropriate. 4<br>
05
5 Remember Your Objectives<br>
06
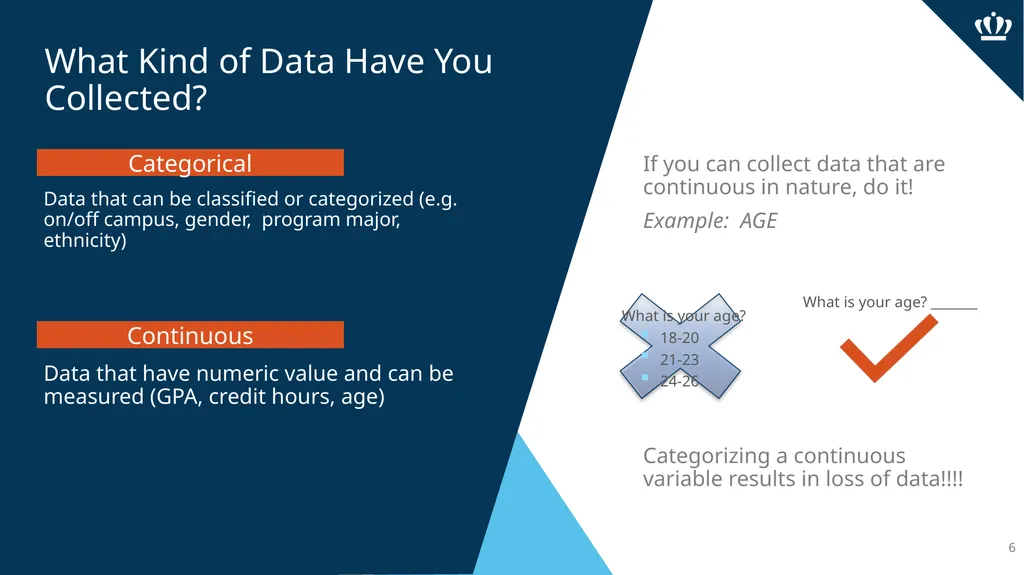
If you can collect data that are continuous in nature, do it!
Example: AGE
Categorizing a continuous variable results in loss of data!!!! Data that can be classified or categorized (e.g. on/off campus, gender, program major, ethnicity)
Data that have numeric value and can be measured (GPA, credit hours, age) What Kind of Data Have You Collected? 6 Categorical Continuous What is your age?
18-20
21-23
24-26 What is your age? _______<br>
07
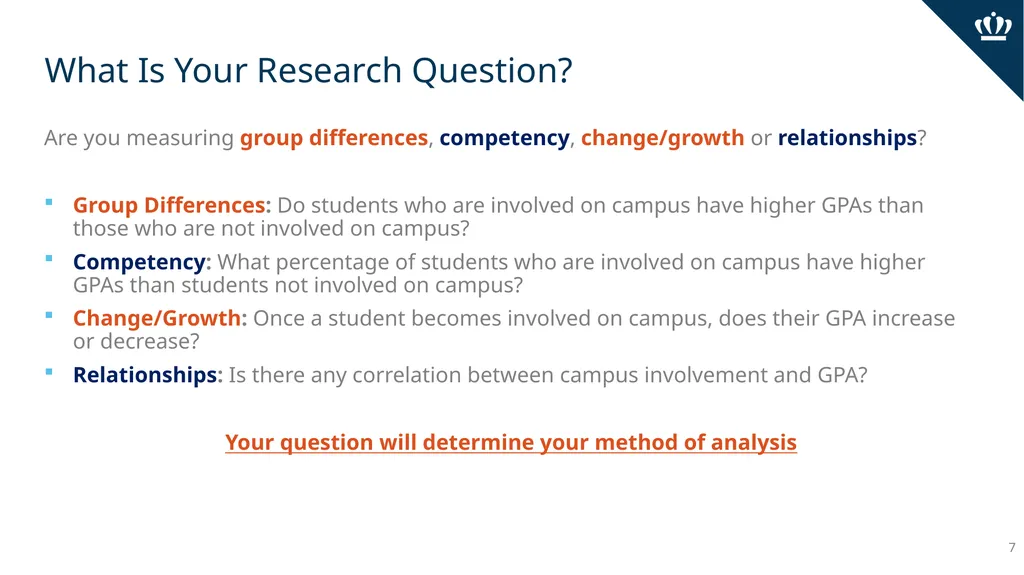
What Is Your Research Question? Are you measuring group differences, competency, change/growth or relationships?
Group Differences: Do students who are involved on campus have higher GPAs than those who are not involved on campus?
Competency: What percentage of students who are involved on campus have higher GPAs than students not involved on campus?
Change/Growth: Once a student becomes involved on campus, does their GPA increase or decrease?
Relationships: Is there any correlation between campus involvement and GPA?
Your question will determine your method of analysis 7<br>
08
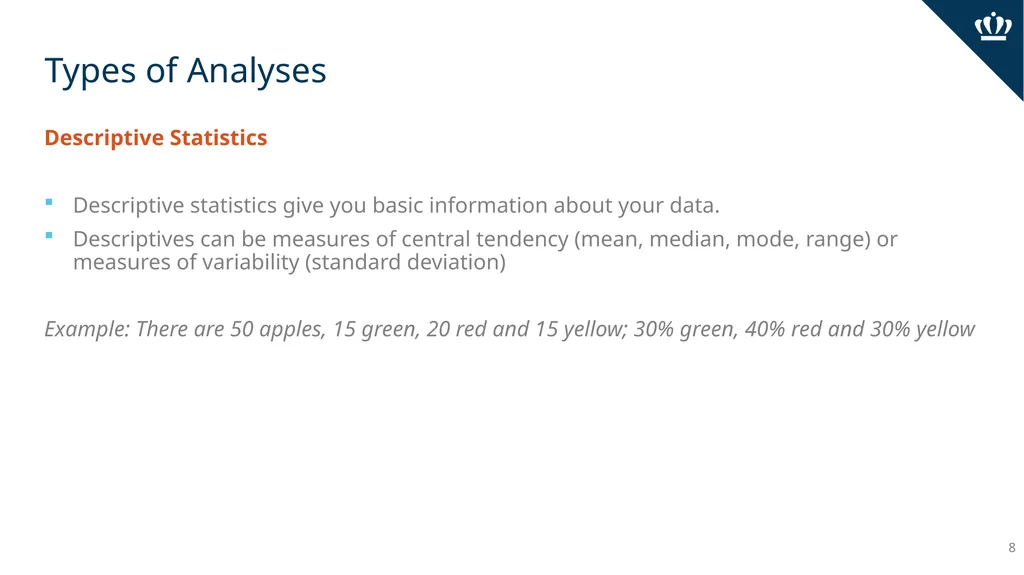
Types of Analyses Descriptive Statistics
Descriptive statistics give you basic information about your data.
Descriptives can be measures of central tendency (mean, median, mode, range) or measures of variability (standard deviation)
Example: There are 50 apples, 15 green, 20 red and 15 yellow; 30% green, 40% red and 30% yellow 8<br>
09
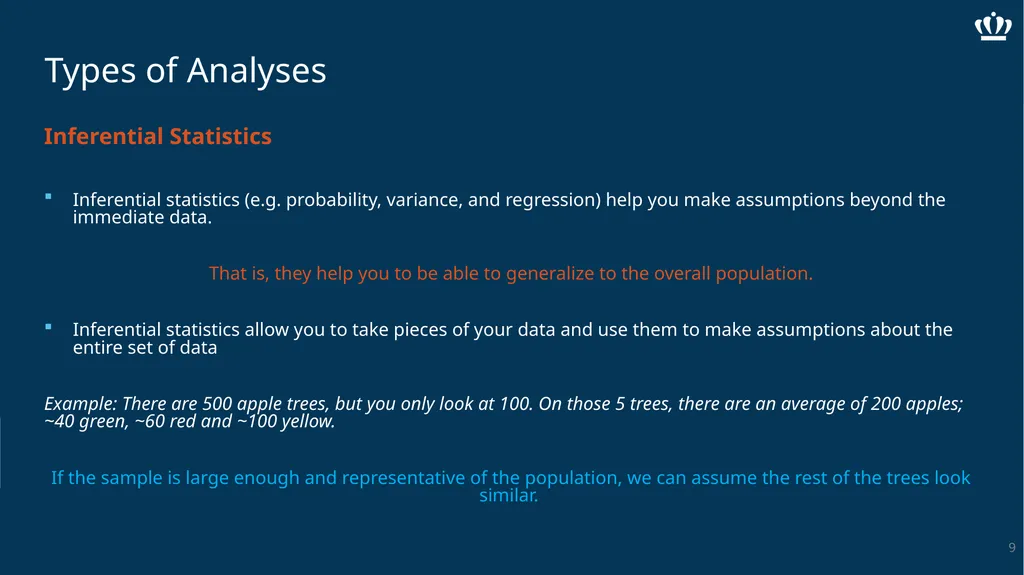
Types of Analyses Inferential Statistics
Inferential statistics (e.g. probability, variance, and regression) help you make assumptions beyond the immediate data.
That is, they help you to be able to generalize to the overall population.
Inferential statistics allow you to take pieces of your data and use them to make assumptions about the entire set of data
Example: There are 500 apple trees, but you only look at 100. On those 5 trees, there are an average of 200 apples; ~40 green, ~60 red and ~100 yellow.
If the sample is large enough and representative of the population, we can assume the rest of the trees look similar. 9<br>
10
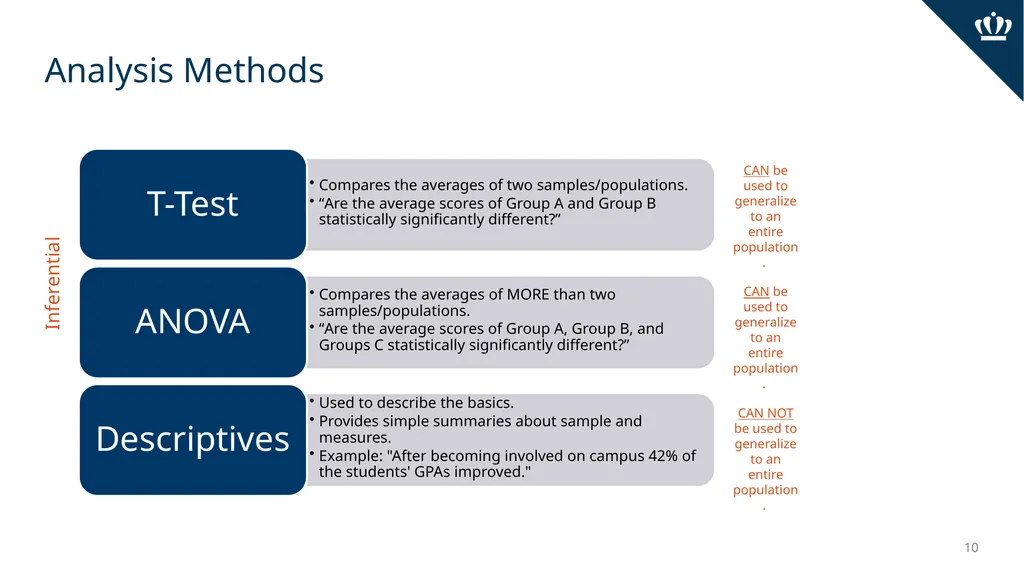
Analysis Methods 10 CAN be used to generalize to an entire population. CAN be used to generalize to an entire population. CAN NOT be used to generalize to an entire population. Inferential<br>
11
References Biola University. (2018). Learning assessment for student success and program effectiveness. Retrieved from https://www.biola.edu/learning-assessment/the- building-blocks
George Washington University. (2018). The assessment cycle. Retrieved from https://assessment.gwu.edu/assessment-cycle
James Madison University. (2018). Data collection & analysis. Retrieved from https://www.jmu.edu/assessment/sass/step%205- 6%20Data%20Collection%20and%20Analysis.shtml
Statistics Solutions. (2013). ANOVA [WWW Document]. Retrieved from http://www.statisticssolutions.com/academic-solutions/resources/directory-of- statistical-analyses/anova/
Statwing. (2018). Statistical significance (t-test). Retrieved from http://docs.statwing.com/examples-and-definitions/t-test/statistical- significance/
Trochim, W.M.K. (2006). Descriptive statistics. Retrieved from https://www.socialresearchmethods.net/kb/statdesc.htm 11<br>