Annual Financial and Non-Financial Performance Information for the 201819 Financial Year Ms Phindile Mkwanazi Acting Principal: National School of Government 09 October 2019 Outline of Presentation 2 Introduction Summary of Audit Outcomes
"Annual Financial and Non-Financial Performance" is the property of its rightful owner. Permission is granted to
download and print the materials on this website for personal, non-commercial use only, and to display it
on your personal computer provided you do not modify the materials and that you retain all copyright
notices contained in the materials. By downloading content from our website, you accept the terms of this
agreement.
Presentation Transcript
01
Annual Financial and Non-Financial Performance Information for the 2018/19 Financial Year Ms Phindile Mkwanazi
Acting Principal: National School of Government
09 October 2019<br>
02
Outline of Presentation 2 Introduction
Summary of Audit Outcomes
Annual Performance Plan 2018/19
Highlights of Annual Performance
3 Years Trend of the APP Performance
Annual Performance for Programme 1: Administration
Annual Performance for Programme 2: Public Sector Organisational & Staff Development
Responses to the recommendations of the Portfolio Committee<br>
03
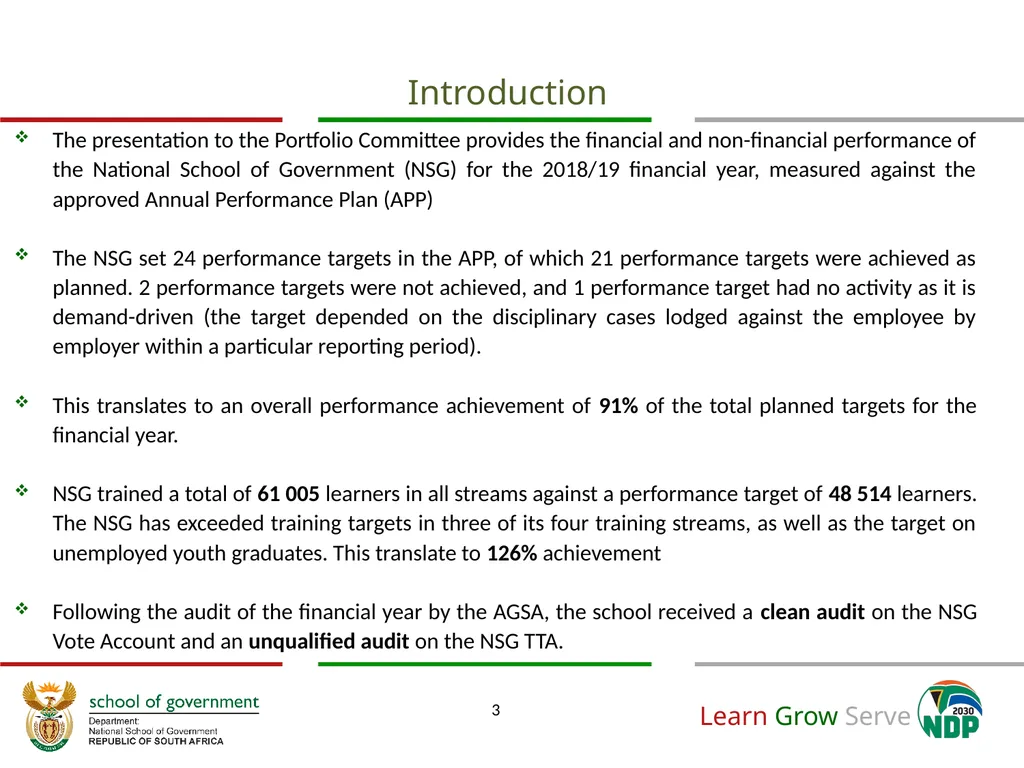
Introduction The presentation to the Portfolio Committee provides the financial and non-financial performance of the National School of Government (NSG) for the 2018/19 financial year, measured against the approved Annual Performance Plan (APP)
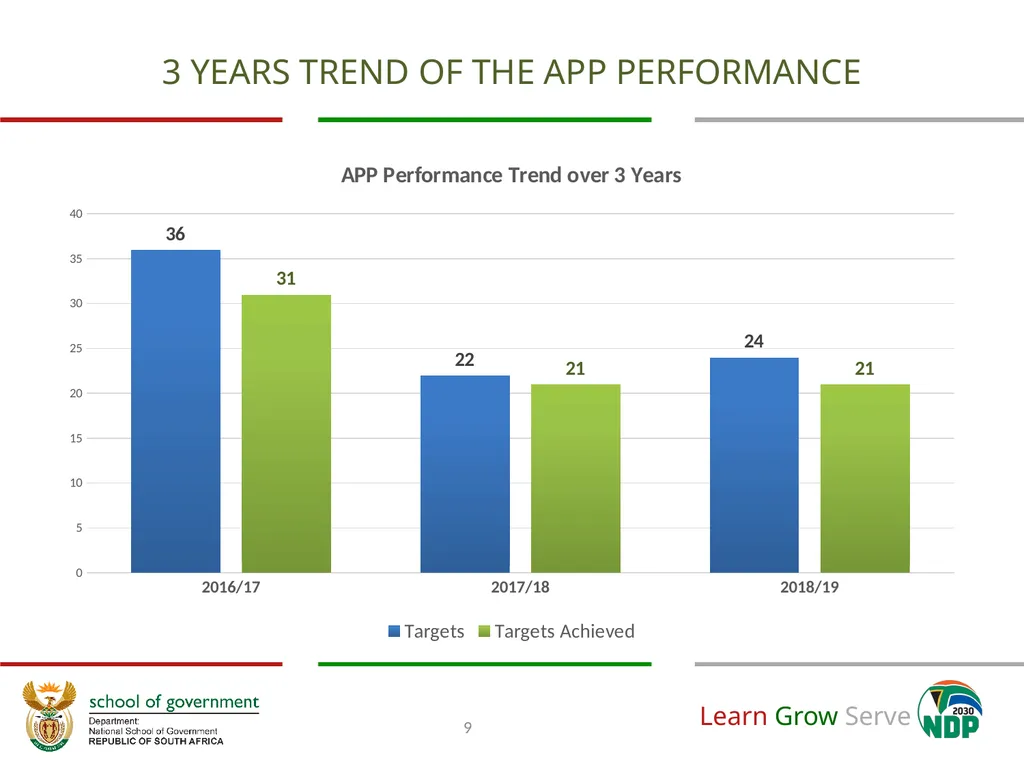
The NSG set 24 performance targets in the APP, of which 21 performance targets were achieved as planned. 2 performance targets were not achieved, and 1 performance target had no activity as it is demand-driven (the target depended on the disciplinary cases lodged against the employee by employer within a particular reporting period).
This translates to an overall performance achievement of 91% of the total planned targets for the financial year.
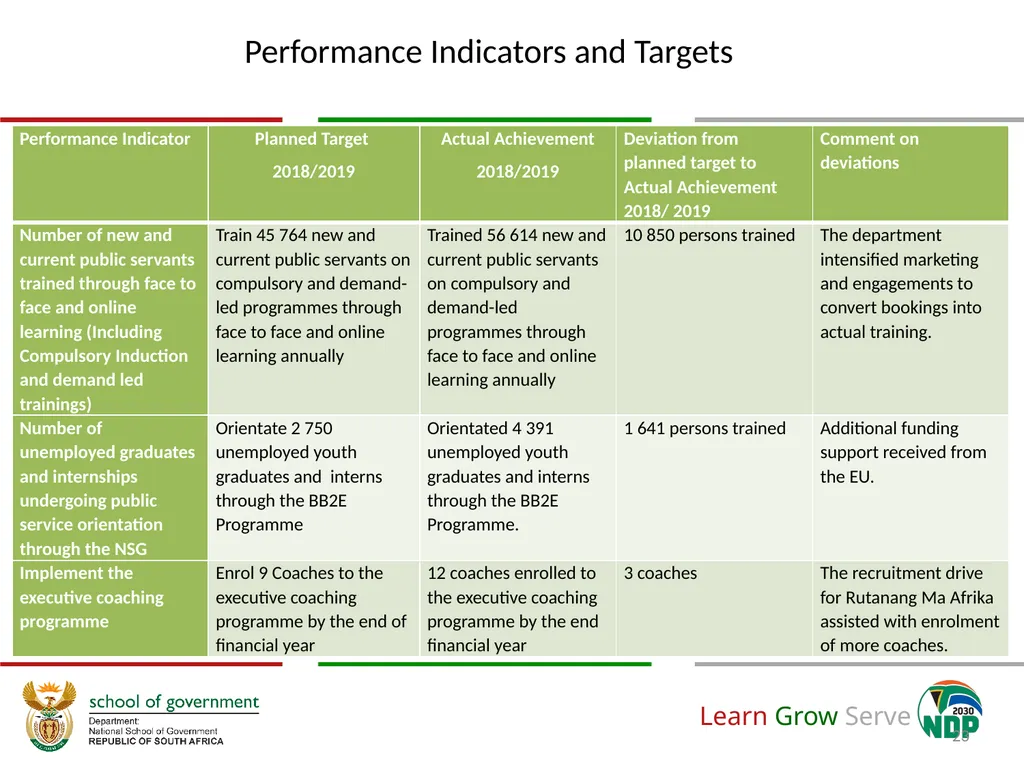
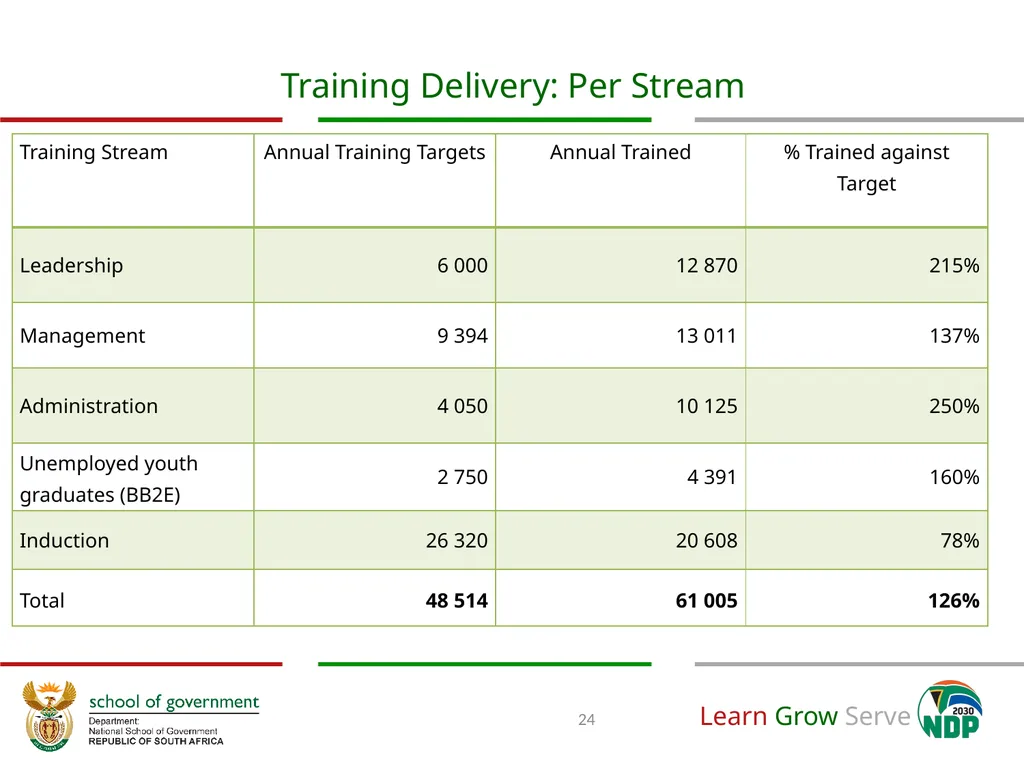
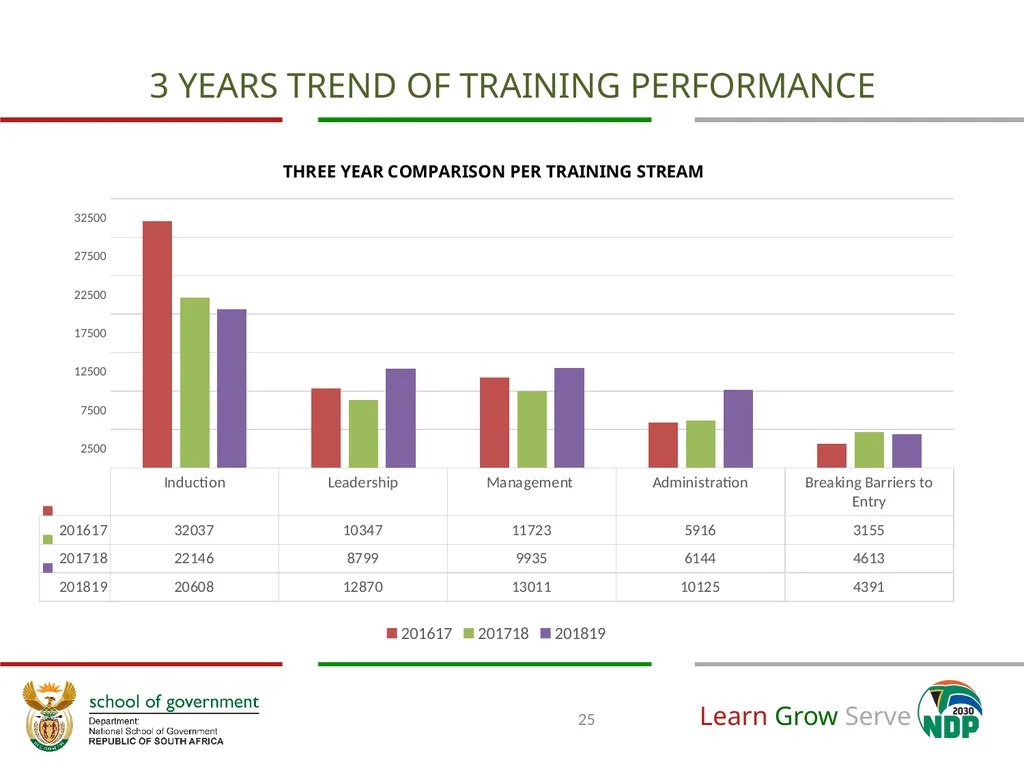
NSG trained a total of 61 005 learners in all streams against a performance target of 48 514 learners. The NSG has exceeded training targets in three of its four training streams, as well as the target on unemployed youth graduates. This translate to 126% achievement
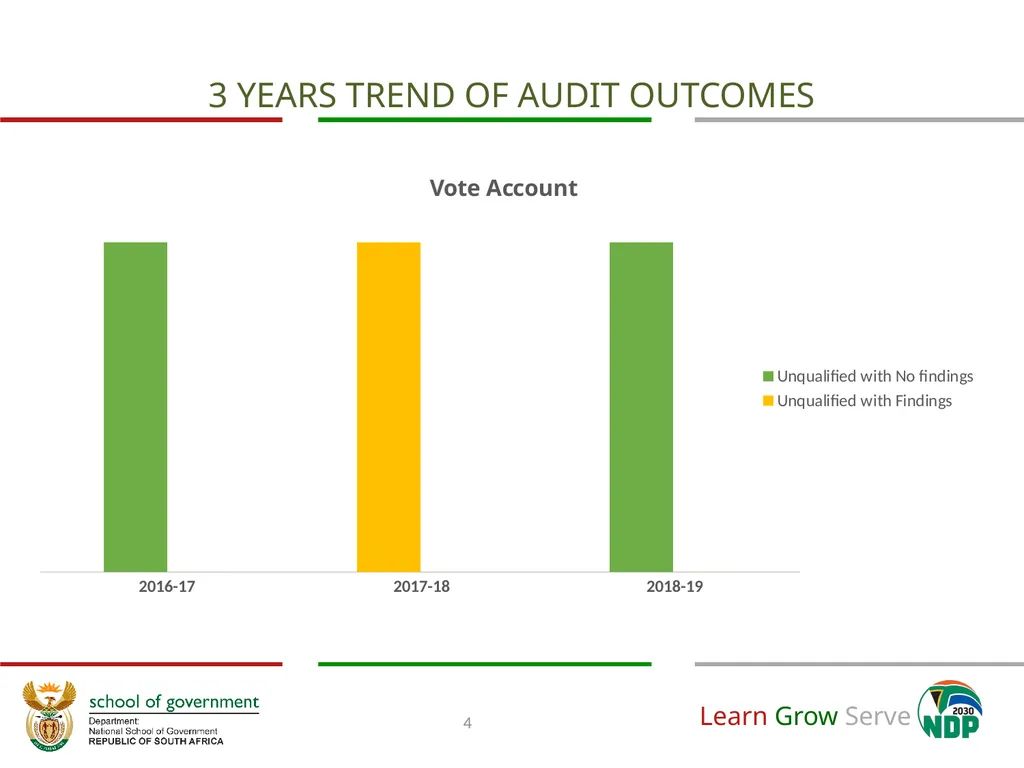
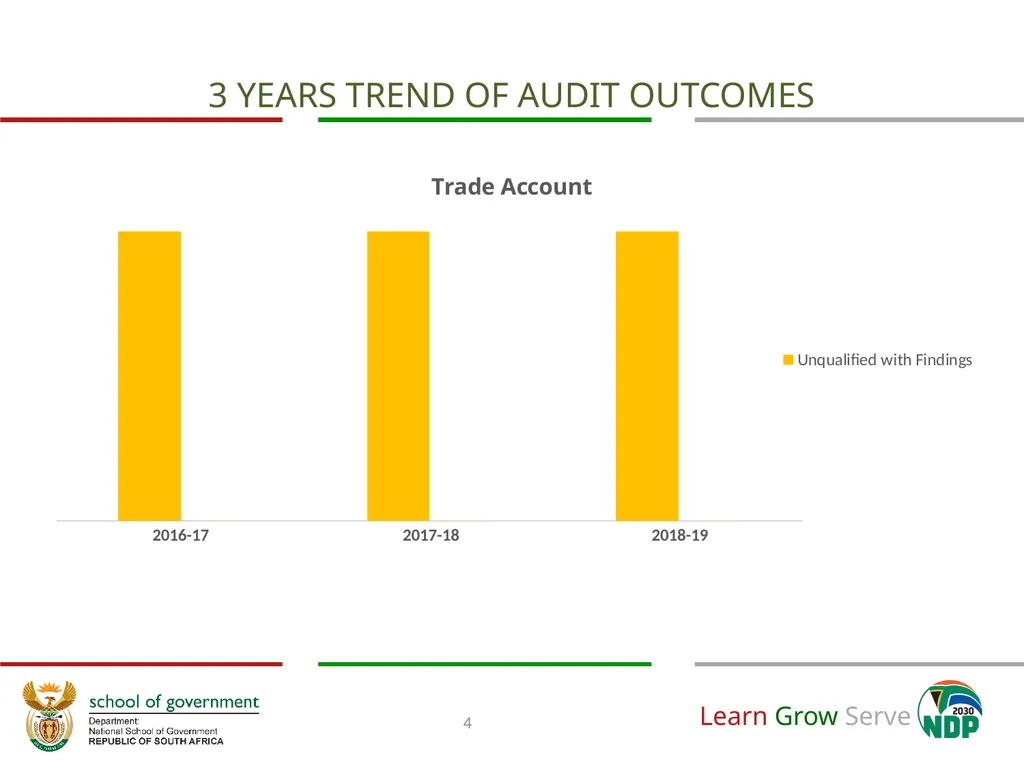
Following the audit of the financial year by the AGSA, the school received a clean audit on the NSG Vote Account and an unqualified audit on the NSG TTA. 3<br>
04
SUMMARY OF AUDIT OUTCOMES The NSG has two sets of Financials which were audited by the AG namely:
NSG Vote Account (Programme 1)
NSG Trading Training Account (Programme 2)
Audit outcome
The NSG Vote Account received a clean audit opinion
The NSG Trading Training Account an unqualified audit opinion with findings 4<br>
05
3 YEARS TREND OF AUDIT OUTCOMES 4<br>
06
3 YEARS TREND OF AUDIT OUTCOMES 4<br>
07
Highlights of Annual Performance The NSG trained 130 participants (including rangers, hospitality personnel and managers from various business units) of SANParks on the Emerging Management Development Programme in partnership with a higher education institution.
The NSG successfully completed the innovative development and internal approval of the SMS Pre-Entry Programme: Nyukela. This is a new compulsory programme intended to standardize access to the senior management echelon.
The NSG convened workshops as part of building capacity, on topics such as Community Participation and Leadership in a Changing Society (in partnership with Community Chest and the Western Cape Department of Local Government) and Live the legacy: Towards a socio-economically empowered youth seminar (in collaboration with the National Youth Development Agency).
The Department prioritized the implementation of courses relevant to the discourse such as ethics that allows managers in Public Service to recognize ethical dilemmas and apply their knowledge and expertise within the prescripts of governance already in the system. 7<br>
08
Highlights of Annual Performance More government employees were trained on quality and service oriented courses to ensure government provision of service is not compromised. Courses such as Khaedu, Customer Service Excellence and Performance Management continue to be prominent in the shaping of Public Service calibre relevant to executing the mandate of the state.
Moreover, over 2 500 employees have been trained on planning, monitoring and evaluation, to ensure that the impact of the services provided by government is evaluated.
The NSG has also reviewed or updated a number of its courses in order to meet regulatory changes, and the needs of certain levels within the Public Service.
During this financial year, the NSG focused on courses aligned to the improvement of service such as Citizen Centered Service Delivery and Evidence-Based Policy-Making and Implementation.
To build capacity, the NSG will continue to use current and retired public servants in the form of Rutanang Ma Afrika to provide an opportunity to impart knowledge and skills to the other public servants. 8<br>
09
9 3 YEARS TREND OF THE APP PERFORMANCE<br>
10
Annual Performance for Programme 1 (Administration)<br>
11
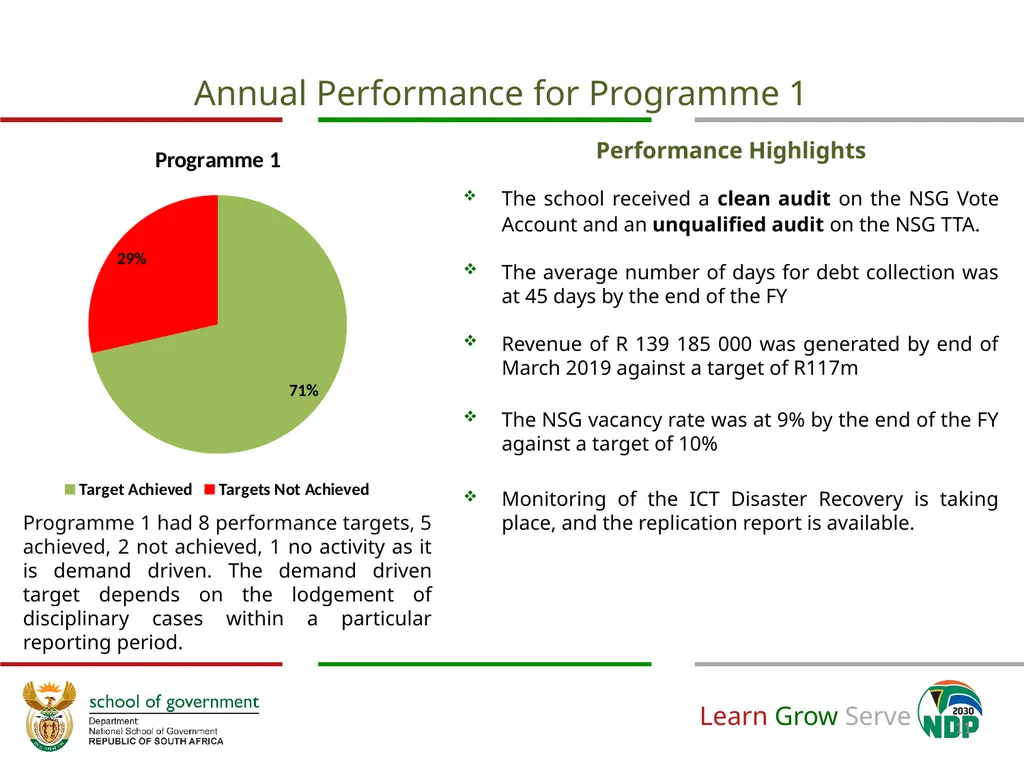
Annual Performance for Programme 1 11 Performance Highlights
The school received a clean audit on the NSG Vote Account and an unqualified audit on the NSG TTA.
The average number of days for debt collection was at 45 days by the end of the FY
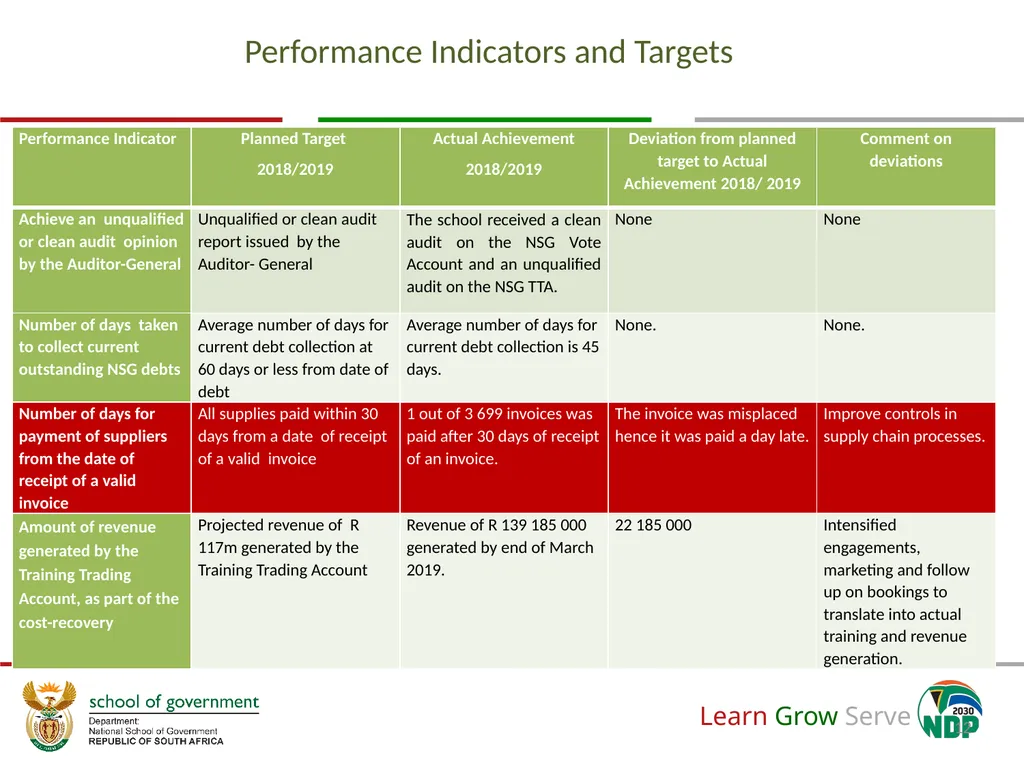
Revenue of R 139 185 000 was generated by end of March 2019 against a target of R117m
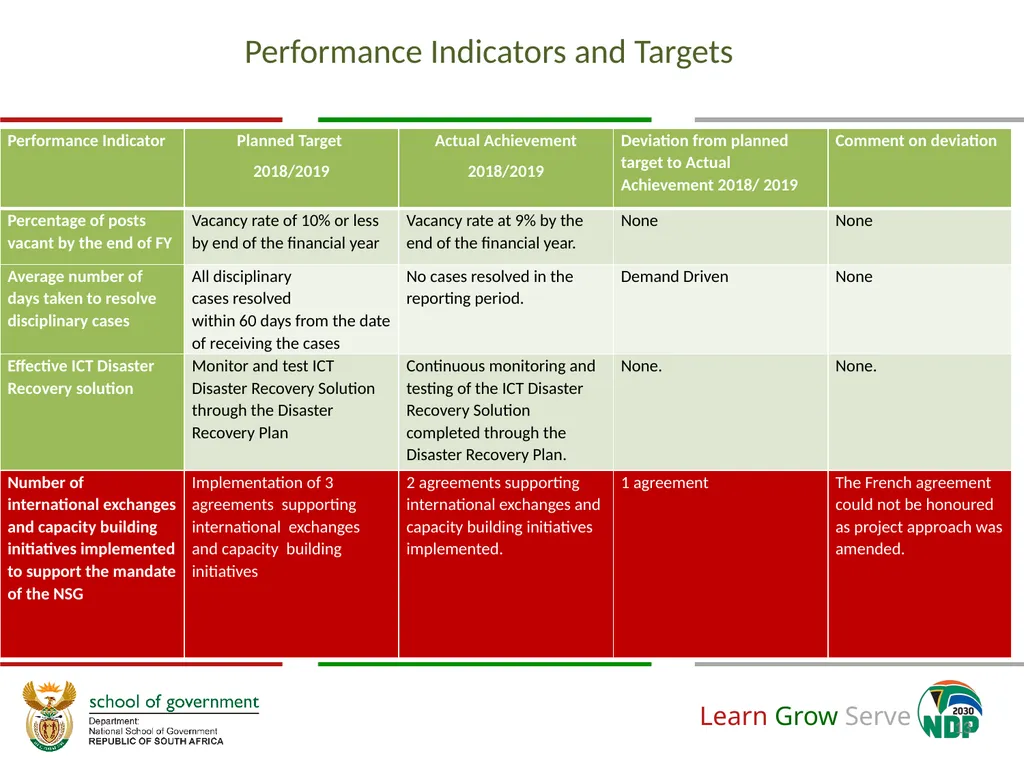
The NSG vacancy rate was at 9% by the end of the FY against a target of 10%
Monitoring of the ICT Disaster Recovery is taking place, and the replication report is available. Programme 1 had 8 performance targets, 5 achieved, 2 not achieved, 1 no activity as it is demand driven. The demand driven target depends on the lodgement of disciplinary cases within a particular reporting period.<br>
12
12 Performance Indicators and Targets<br>
13
13 Performance Indicators and Targets<br>
14
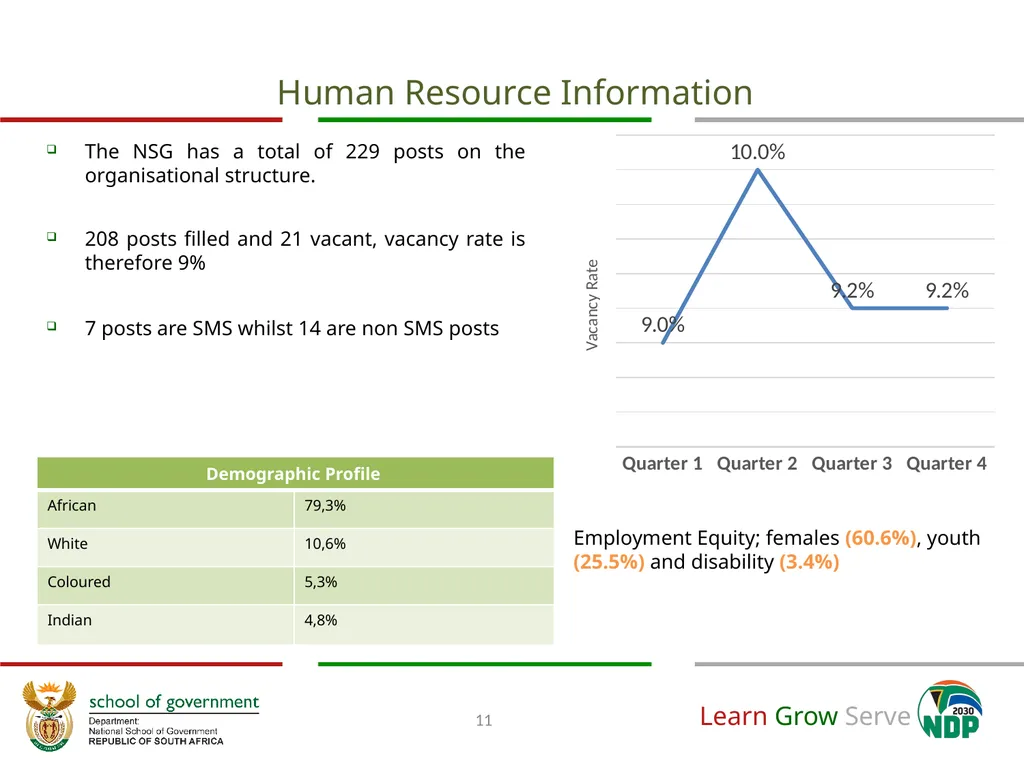
The NSG has a total of 229 posts on the organisational structure.
208 posts filled and 21 vacant, vacancy rate is therefore 9%
7 posts are SMS whilst 14 are non SMS posts Human Resource Information Employment Equity; females (60.6%), youth (25.5%) and disability (3.4%) 11<br>
15
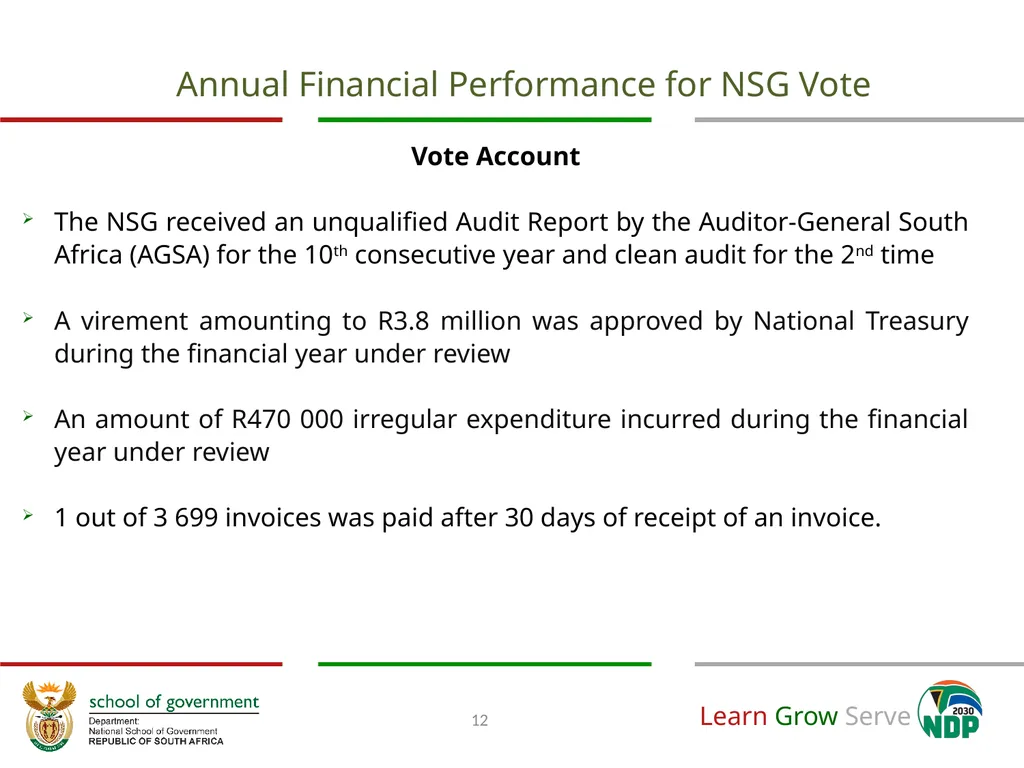
Annual Financial Performance for NSG Vote 12 The NSG received an unqualified Audit Report by the Auditor-General South Africa (AGSA) for the 10th consecutive year and clean audit for the 2nd time
A virement amounting to R3.8 million was approved by National Treasury during the financial year under review
An amount of R470 000 irregular expenditure incurred during the financial year under review
1 out of 3 699 invoices was paid after 30 days of receipt of an invoice. Vote Account<br>
16
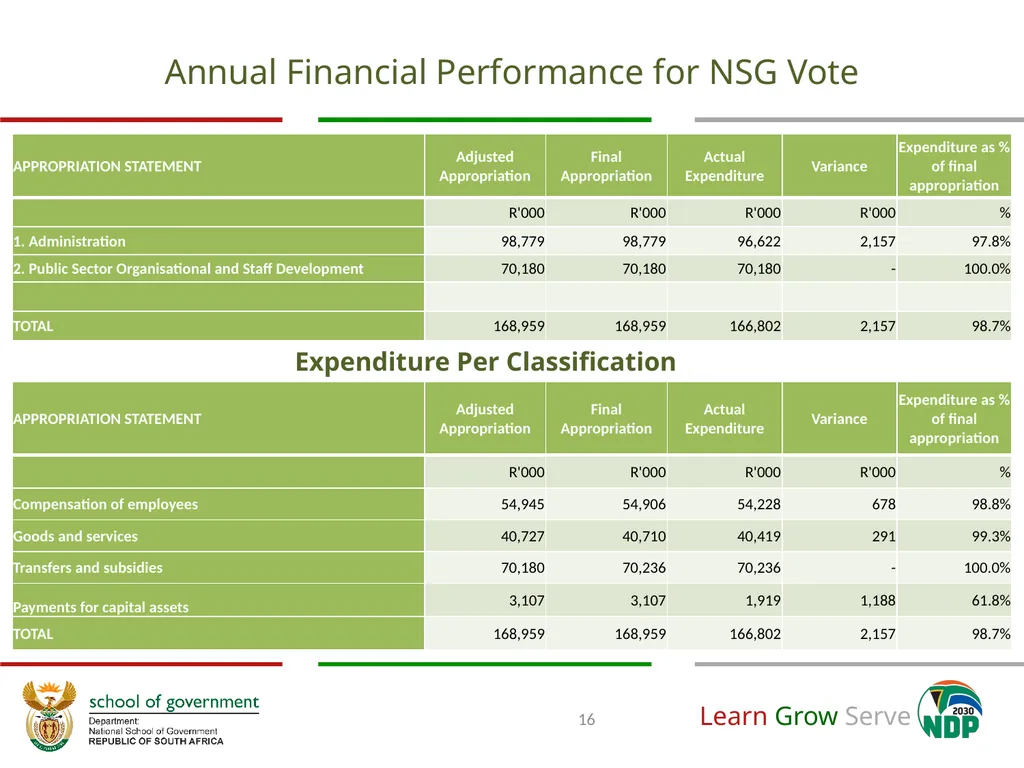
Annual Financial Performance for NSG Vote 16 Expenditure Per Classification<br>
17
Annual Performance for Programme 2 (Public Sector Organisational and Staff Development)<br>
18
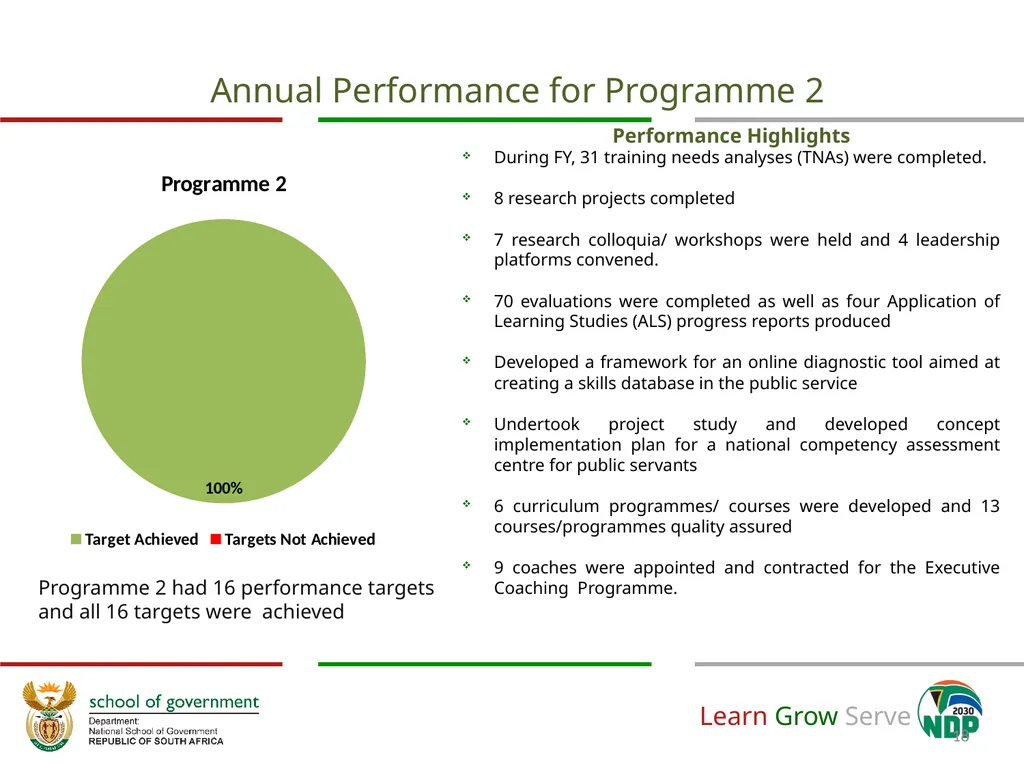
Annual Performance for Programme 2 18 Performance Highlights
During FY, 31 training needs analyses (TNAs) were completed.
8 research projects completed
7 research colloquia/ workshops were held and 4 leadership platforms convened.
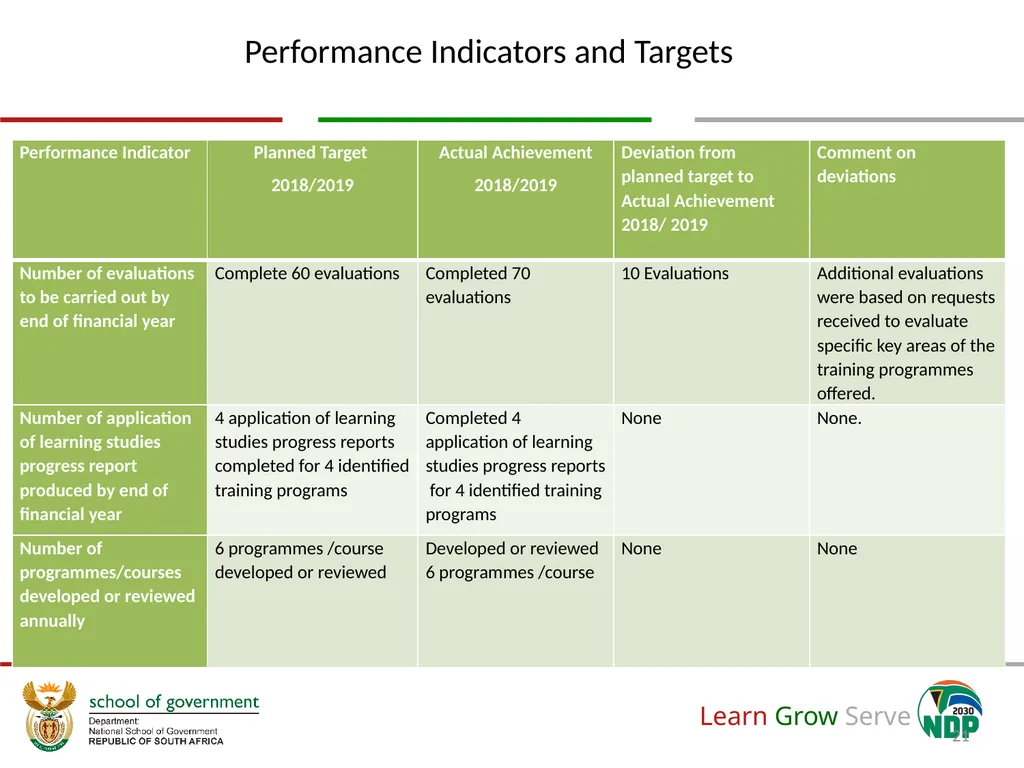
70 evaluations were completed as well as four Application of Learning Studies (ALS) progress reports produced
Developed a framework for an online diagnostic tool aimed at creating a skills database in the public service
Undertook project study and developed concept implementation plan for a national competency assessment centre for public servants
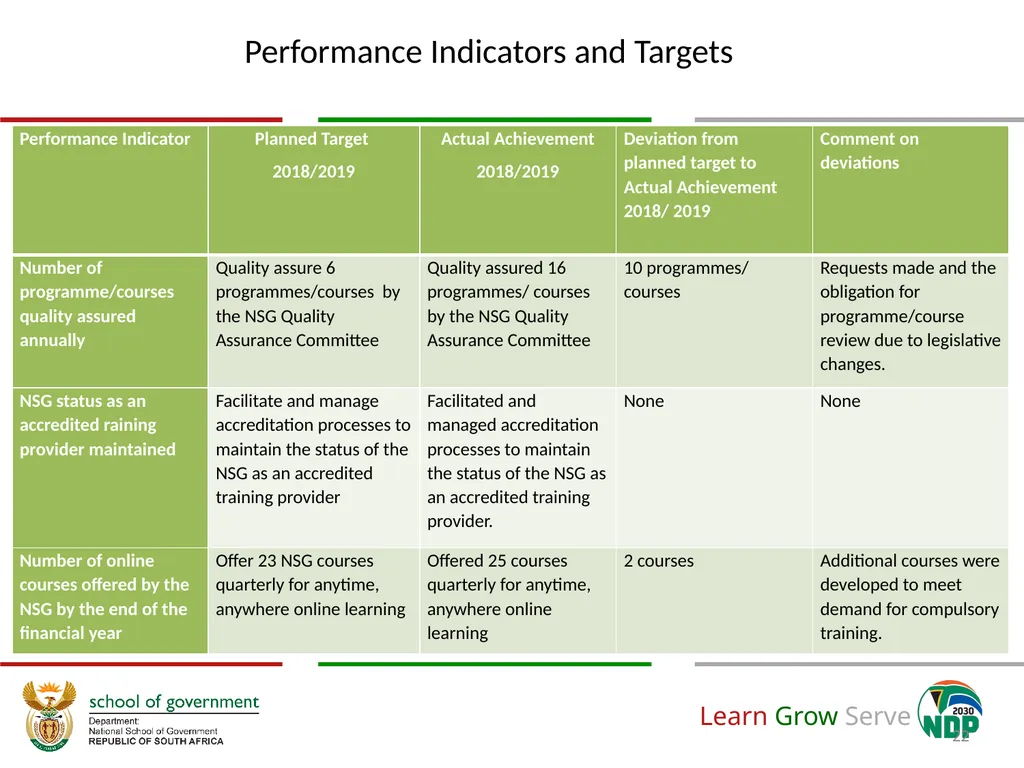
6 curriculum programmes/ courses were developed and 13 courses/programmes quality assured
9 coaches were appointed and contracted for the Executive Coaching Programme. Programme 2 had 16 performance targets and all 16 targets were achieved<br>
19
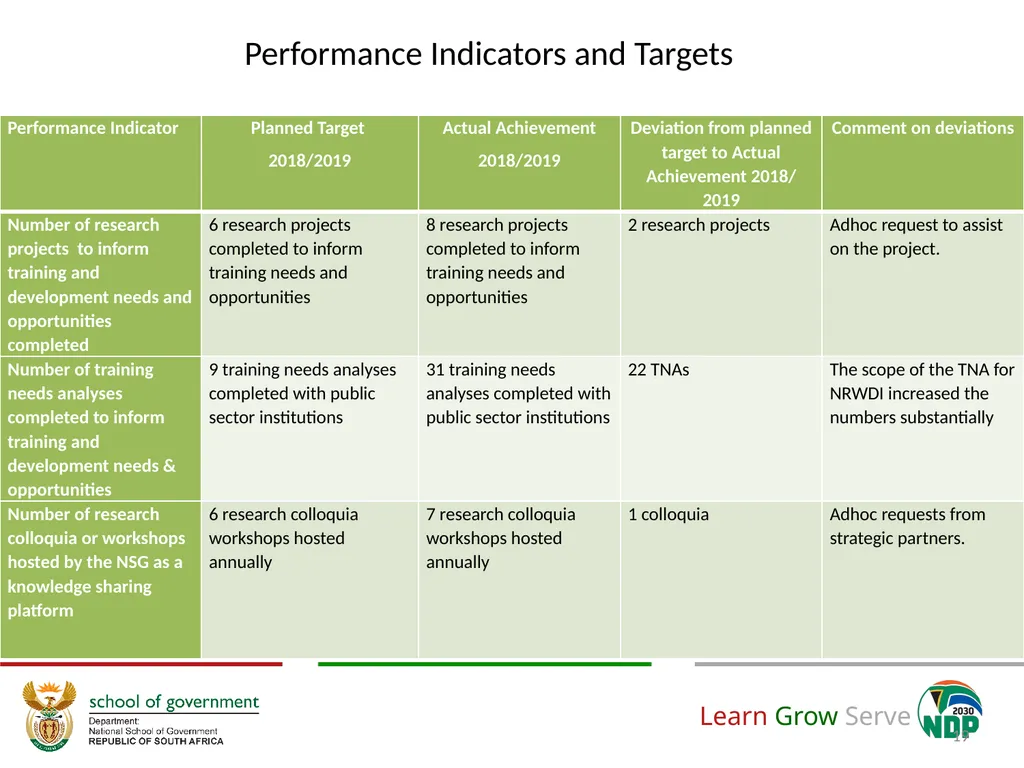
Performance Indicators and Targets 19<br>
20
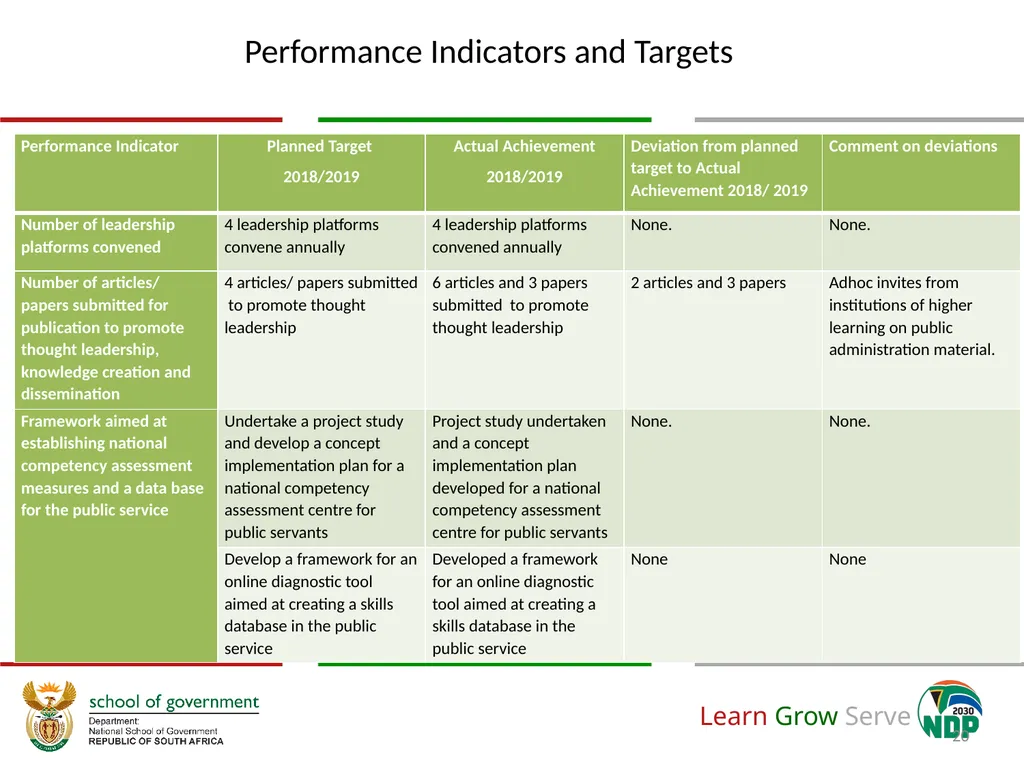
20 Performance Indicators and Targets<br>
21
21 Performance Indicators and Targets<br>
22
22 Performance Indicators and Targets<br>
23
23 Performance Indicators and Targets<br>
24
Training Delivery: Per Stream 24<br>
25
3 YEARS TREND OF TRAINING PERFORMANCE 25<br>
26
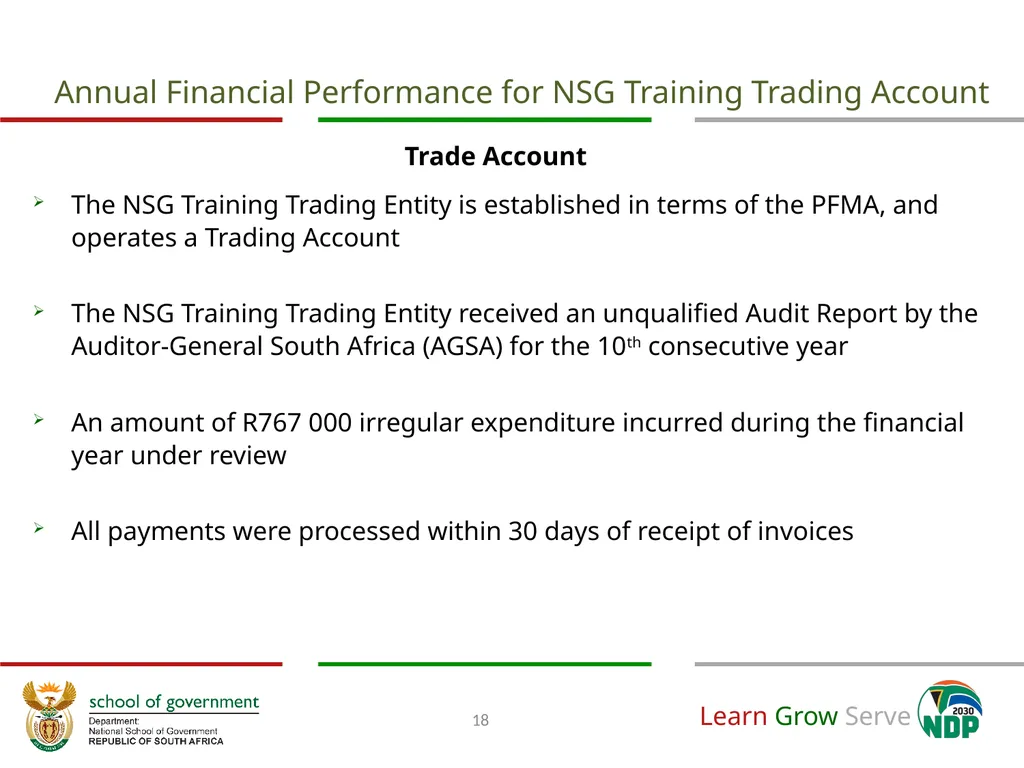
Annual Financial Performance for NSG Training Trading Account 18 The NSG Training Trading Entity is established in terms of the PFMA, and operates a Trading Account
The NSG Training Trading Entity received an unqualified Audit Report by the Auditor-General South Africa (AGSA) for the 10th consecutive year
An amount of R767 000 irregular expenditure incurred during the financial year under review
All payments were processed within 30 days of receipt of invoices Trade Account<br>
27
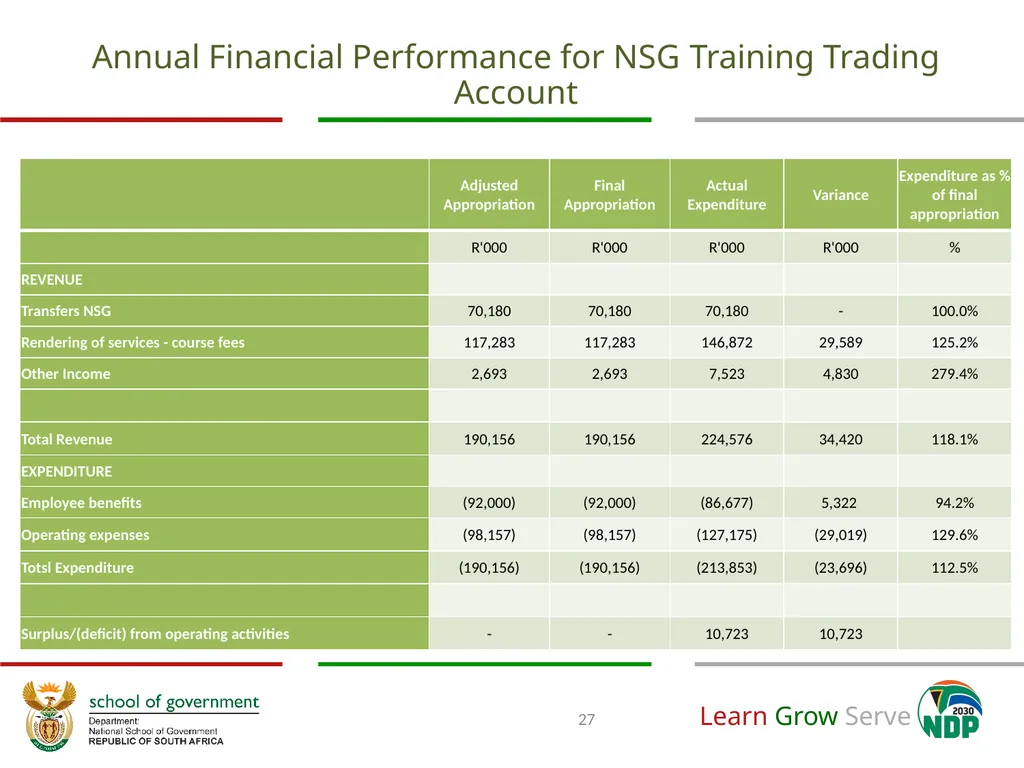
Annual Financial Performance for NSG Training Trading Account 27<br>
28
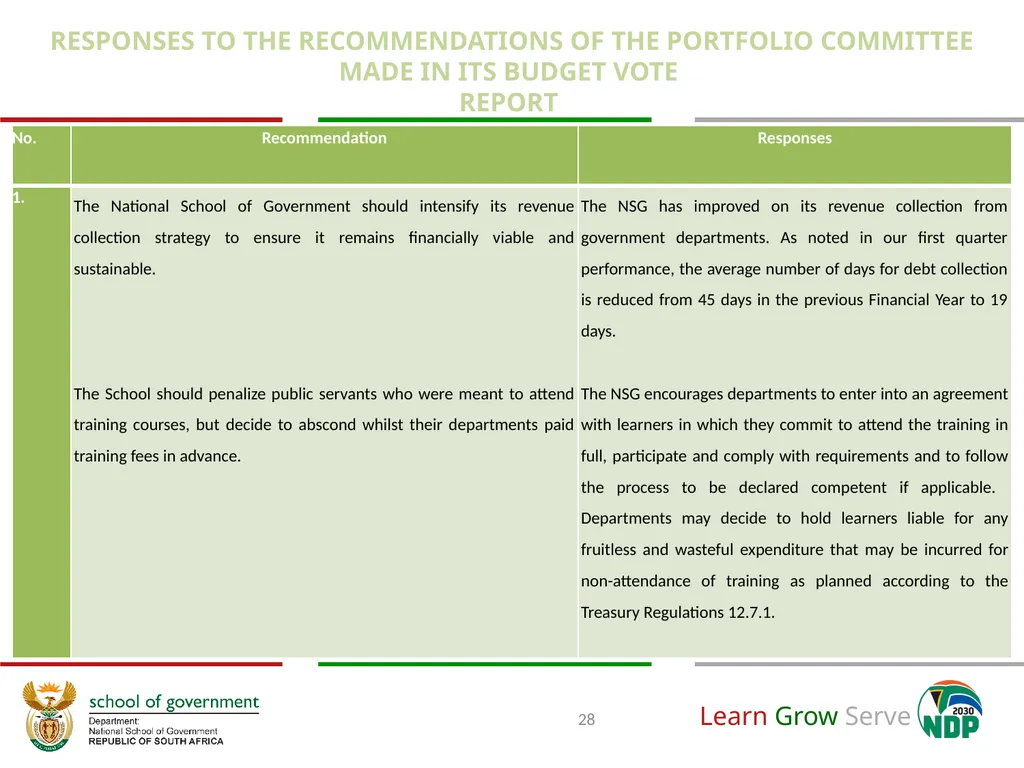
RESPONSES TO THE RECOMMENDATIONS OF THE PORTFOLIO COMMITTEE MADE IN ITS BUDGET VOTE REPORT 28<br>
29
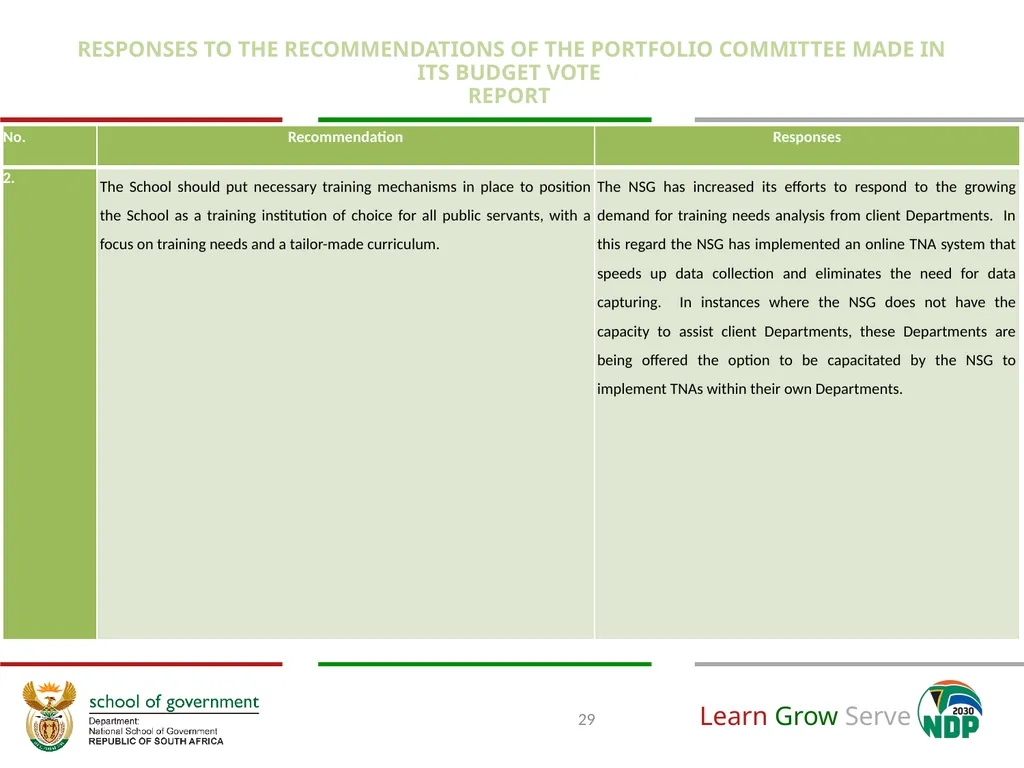
RESPONSES TO THE RECOMMENDATIONS OF THE PORTFOLIO COMMITTEE MADE IN ITS BUDGET VOTE REPORT 29<br>
30
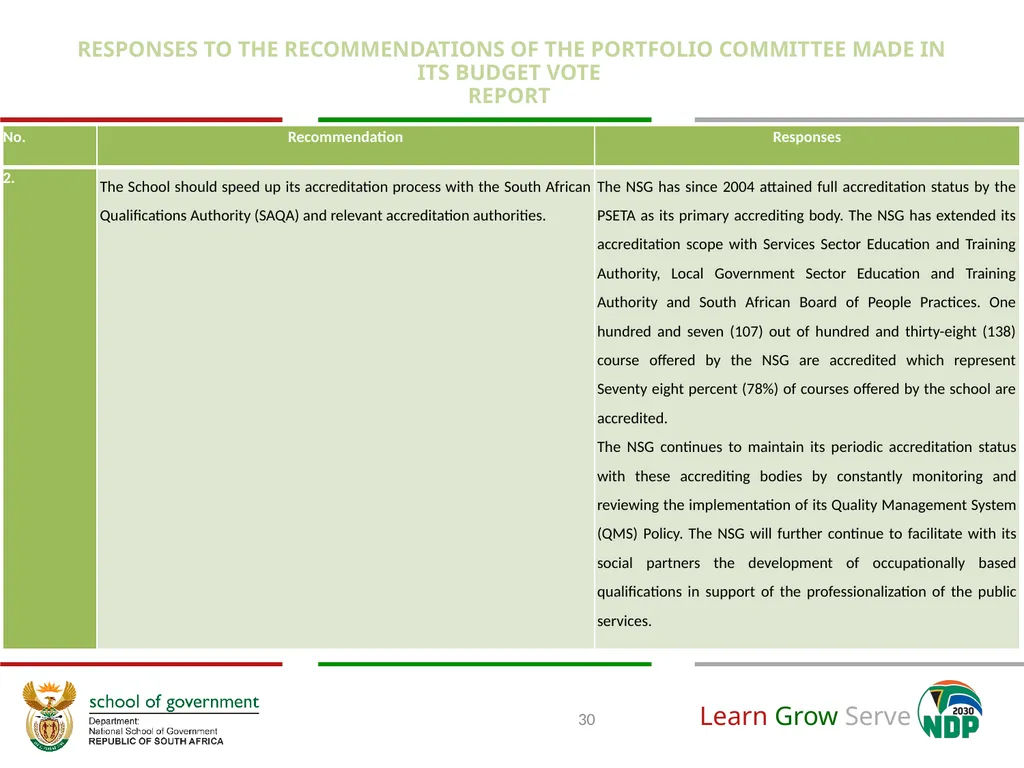
RESPONSES TO THE RECOMMENDATIONS OF THE PORTFOLIO COMMITTEE MADE IN ITS BUDGET VOTE REPORT 30<br>
31
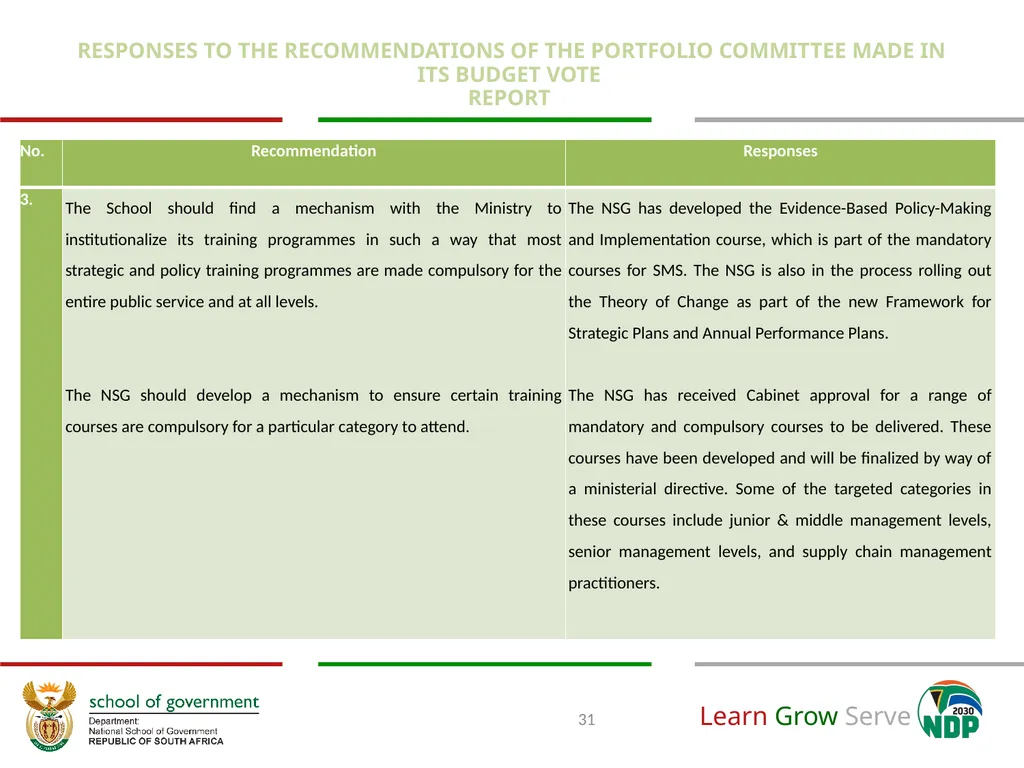
31 RESPONSES TO THE RECOMMENDATIONS OF THE PORTFOLIO COMMITTEE MADE IN ITS BUDGET VOTE REPORT<br>