03
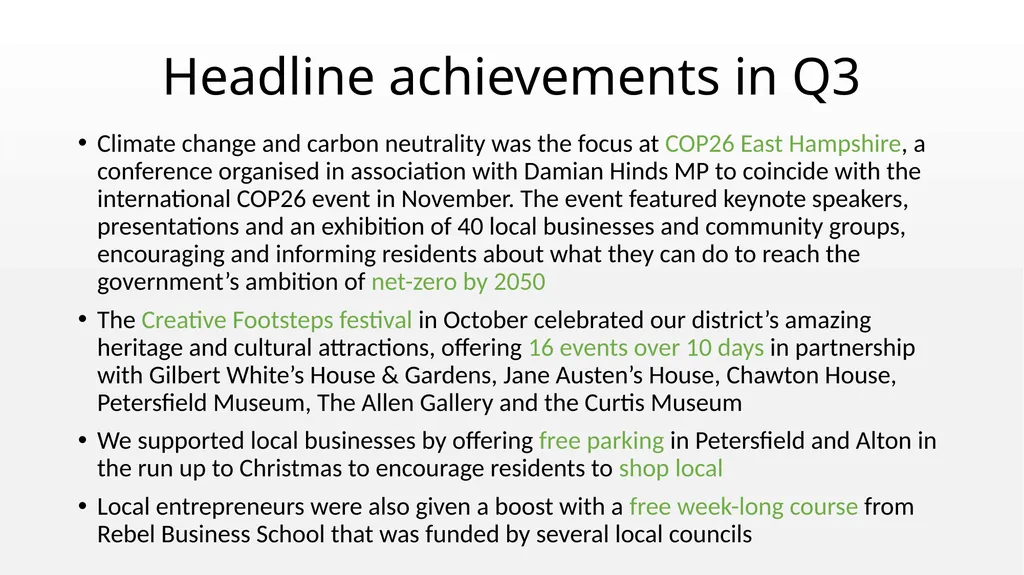
Headline achievements in Q3 Climate change and carbon neutrality was the focus at COP26 East Hampshire, a conference organised in association with Damian Hinds MP to coincide with the international COP26 event in November. The event featured keynote speakers, presentations and an exhibition of 40 local businesses and community groups, encouraging and informing residents about what they can do to reach the government’s ambition of net-zero by 2050
The Creative Footsteps festival in October celebrated our district’s amazing heritage and cultural attractions, offering 16 events over 10 days in partnership with Gilbert White’s House & Gardens, Jane Austen’s House, Chawton House, Petersfield Museum, The Allen Gallery and the Curtis Museum
We supported local businesses by offering free parking in Petersfield and Alton in the run up to Christmas to encourage residents to shop local
Local entrepreneurs were also given a boost with a free week-long course from Rebel Business School that was funded by several local councils<br>
04
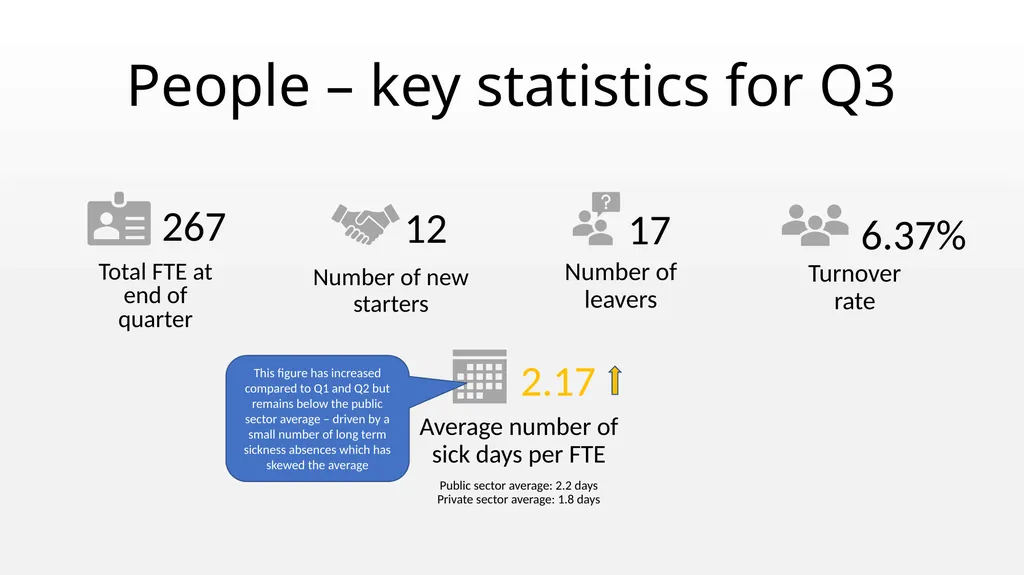
People – key statistics for Q3 Number of new starters Total FTE at end of quarter Average number of sick days per FTE
Public sector average: 2.2 days�Private sector average: 1.8 days Number of leavers Turnover rate 2.17 267 12 17 6.37% This figure has increased compared to Q1 and Q2 but remains below the public sector average – driven by a small number of long term sickness absences which has skewed the average<br>
05
Finance – revenue budget outturn in Q3<br>
06
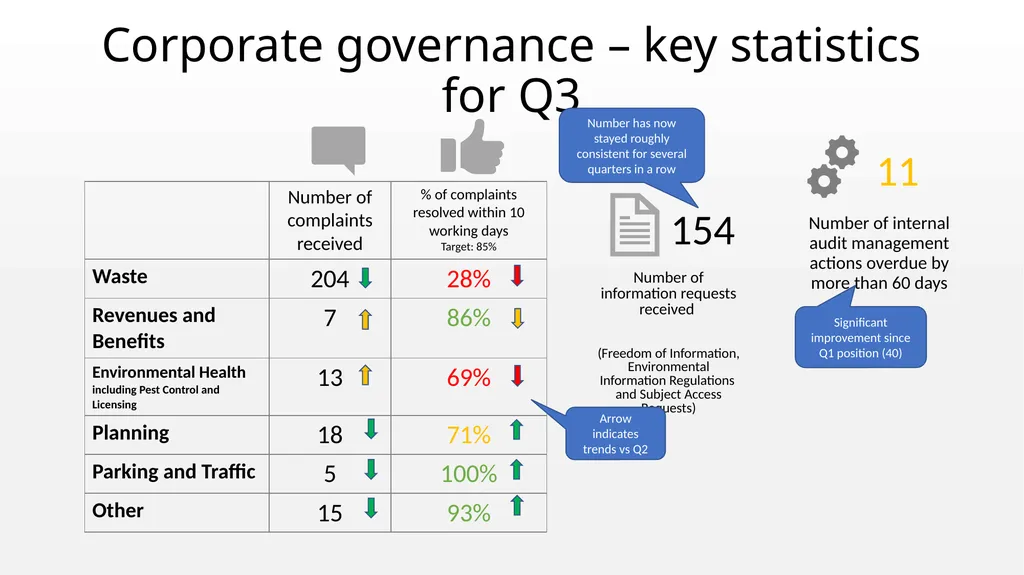
Corporate governance – key statistics for Q3 Number of information requests received �
(Freedom of Information, Environmental Information Regulations and Subject Access Requests) 154 Number of internal audit management actions overdue by more than 60 days 11 Significant improvement since Q1 position (40) Number has now stayed roughly consistent for several quarters in a row Arrow indicates trends vs Q2<br>
07
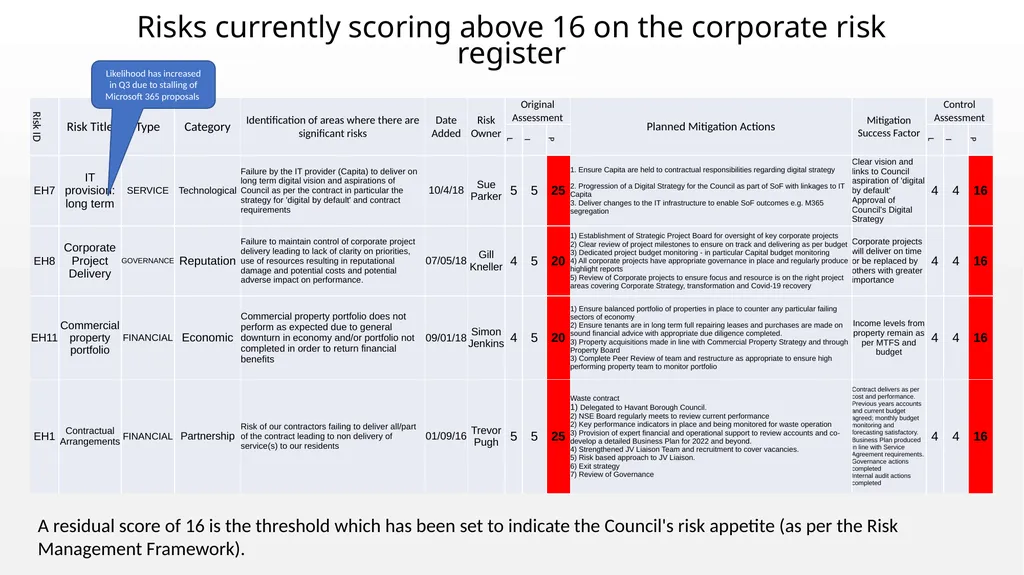
Risks currently scoring above 16 on the corporate risk register A residual score of 16 is the threshold which has been set to indicate the Council's risk appetite (as per the Risk Management Framework). Likelihood has increased in Q3 due to stalling of Microsoft 365 proposals<br>
08
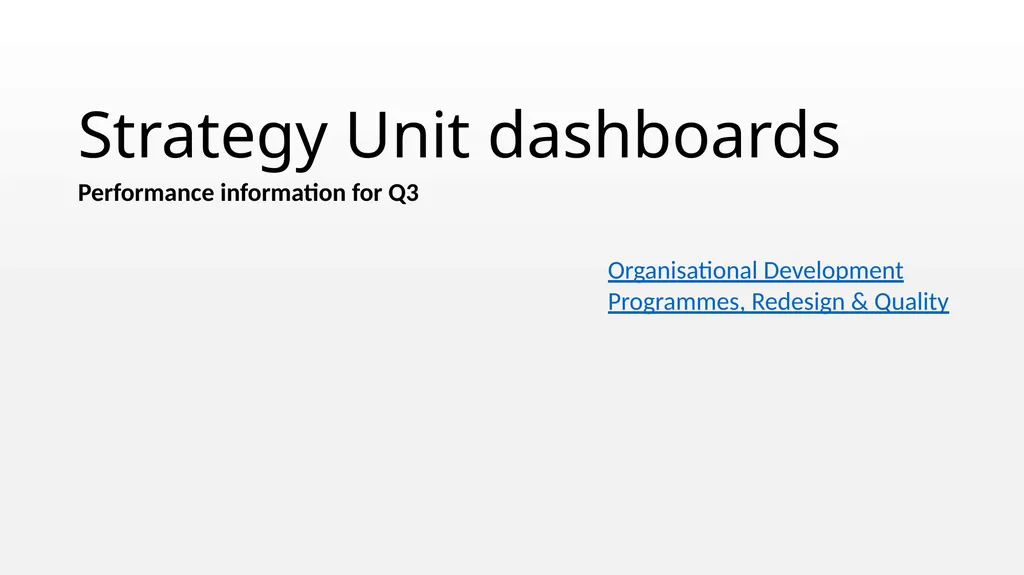
Strategy Unit dashboards Performance information for Q3 Organisational Development
Programmes, Redesign & Quality<br>
09
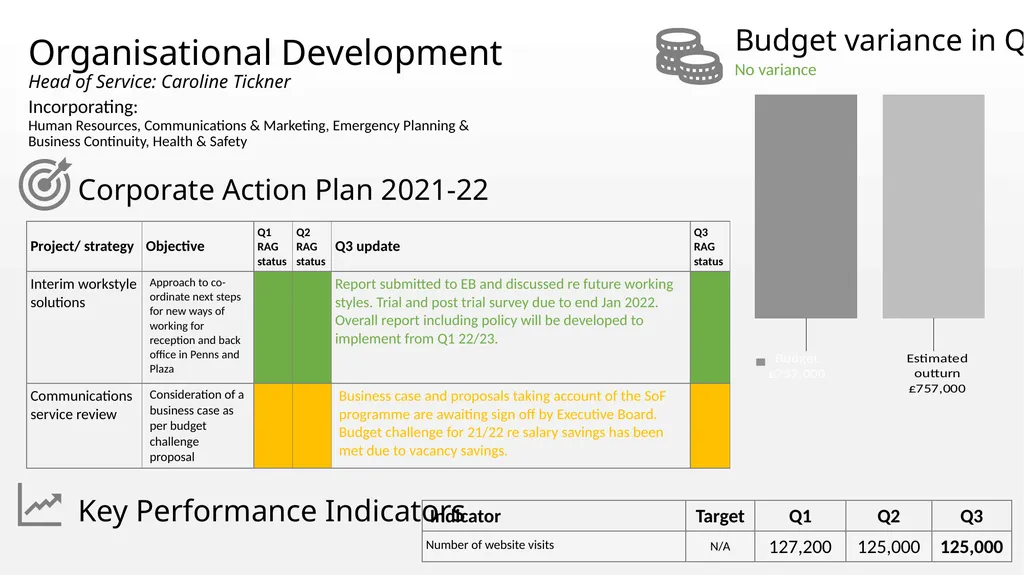
Organisational Development�Head of Service: Caroline Tickner Incorporating:�Human Resources, Communications & Marketing, Emergency Planning & Business Continuity, Health & Safety No variance Budget variance in Q3 Corporate Action Plan 2021-22 Key Performance Indicators<br>
10
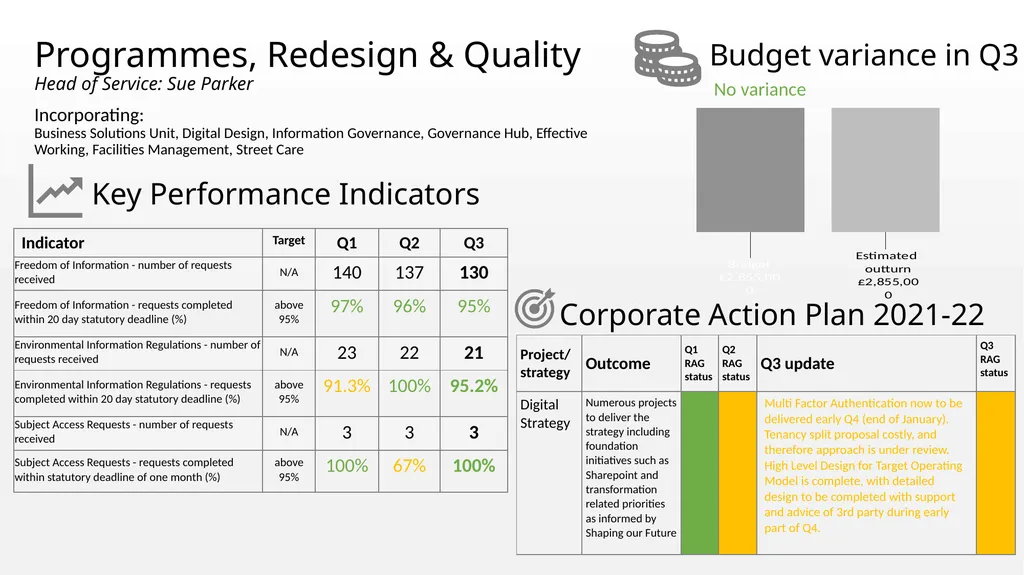
Programmes, Redesign & Quality�Head of Service: Sue Parker Incorporating:�Business Solutions Unit, Digital Design, Information Governance, Governance Hub, Effective Working, Facilities Management, Street Care Key Performance Indicators No variance Budget variance in Q3 Corporate Action Plan 2021-22<br>
11
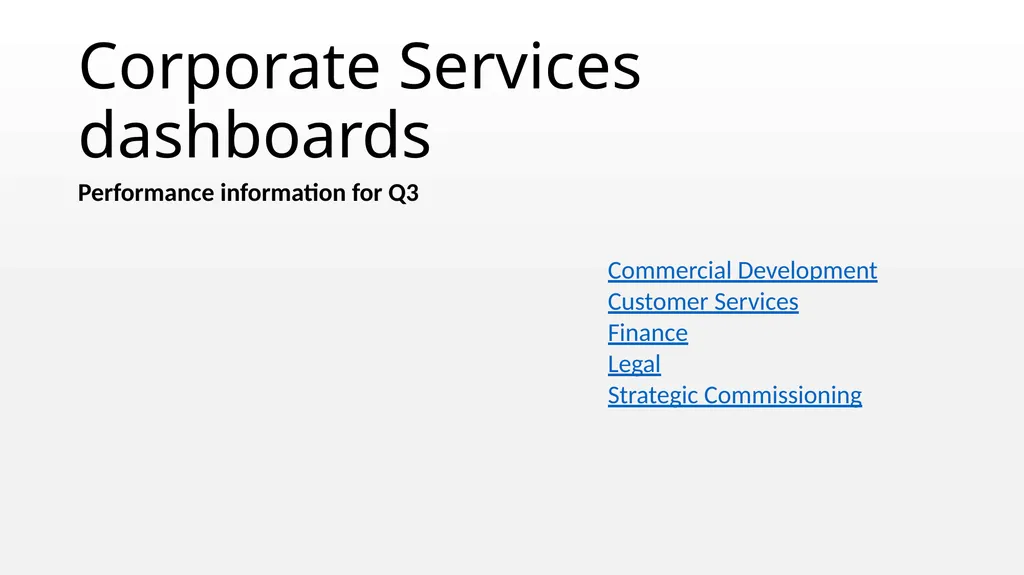
Corporate Services dashboards Performance information for Q3 Commercial Development
Customer Services
Finance
Legal
Strategic Commissioning<br>
12
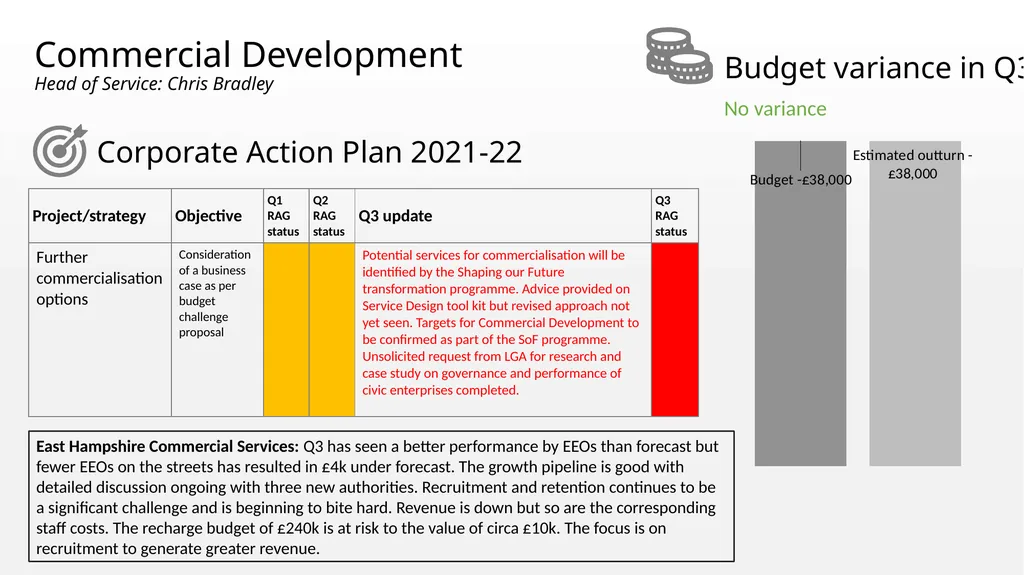
Commercial Development�Head of Service: Chris Bradley Corporate Action Plan 2021-22 Budget variance in Q3 No variance East Hampshire Commercial Services: Q3 has seen a better performance by EEOs than forecast but fewer EEOs on the streets has resulted in £4k under forecast. The growth pipeline is good with detailed discussion ongoing with three new authorities. Recruitment and retention continues to be a significant challenge and is beginning to bite hard. Revenue is down but so are the corresponding staff costs. The recharge budget of £240k is at risk to the value of circa £10k. The focus is on recruitment to generate greater revenue.<br>
13
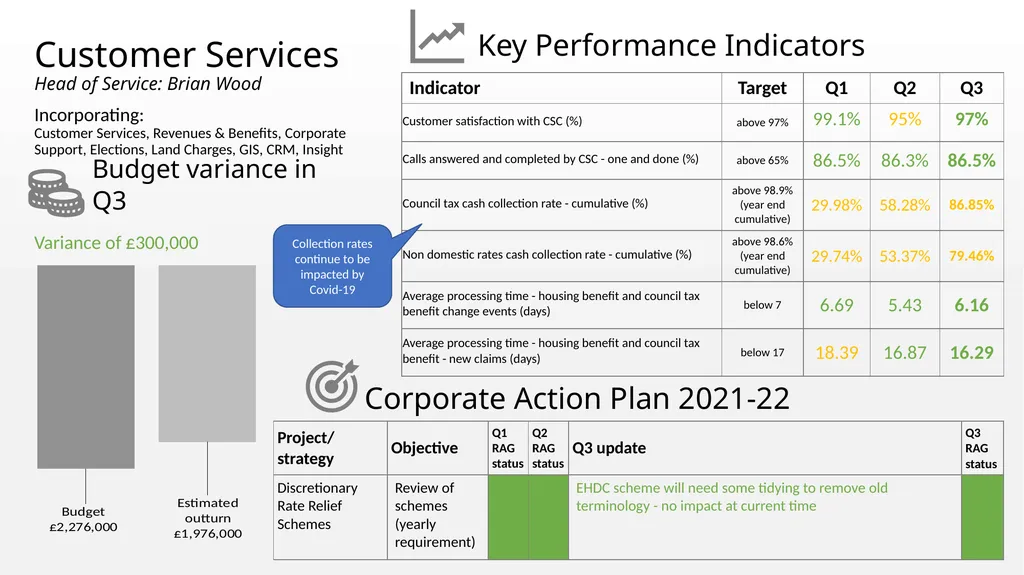
Customer Services�Head of Service: Brian Wood Incorporating:�Customer Services, Revenues & Benefits, Corporate Support, Elections, Land Charges, GIS, CRM, Insight Key Performance Indicators Budget variance in Q3 Variance of £300,000 Collection rates continue to be impacted by Covid-19 Corporate Action Plan 2021-22<br>
14
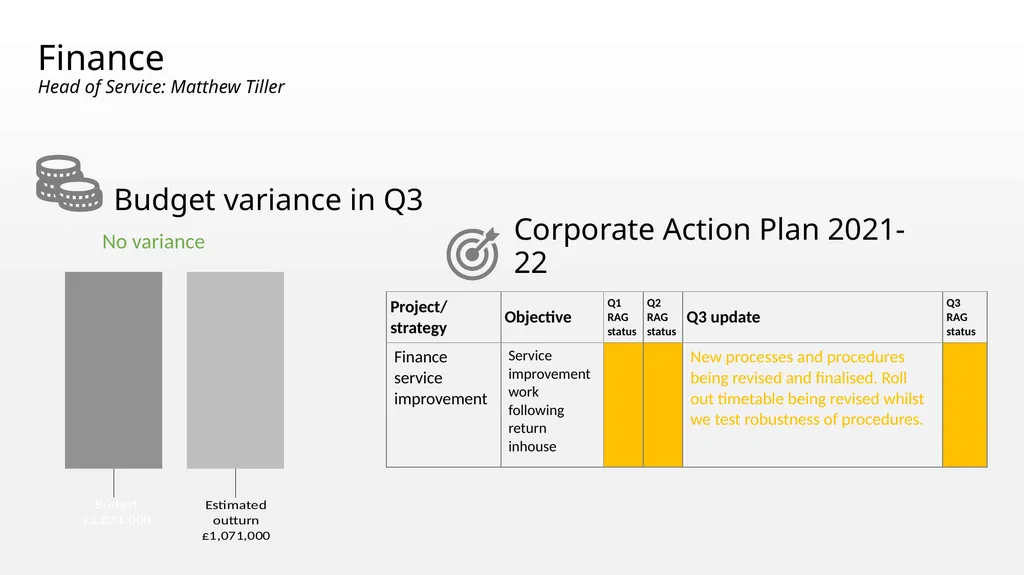
Finance�Head of Service: Matthew Tiller Budget variance in Q3 Corporate Action Plan 2021-22 No variance<br>
15
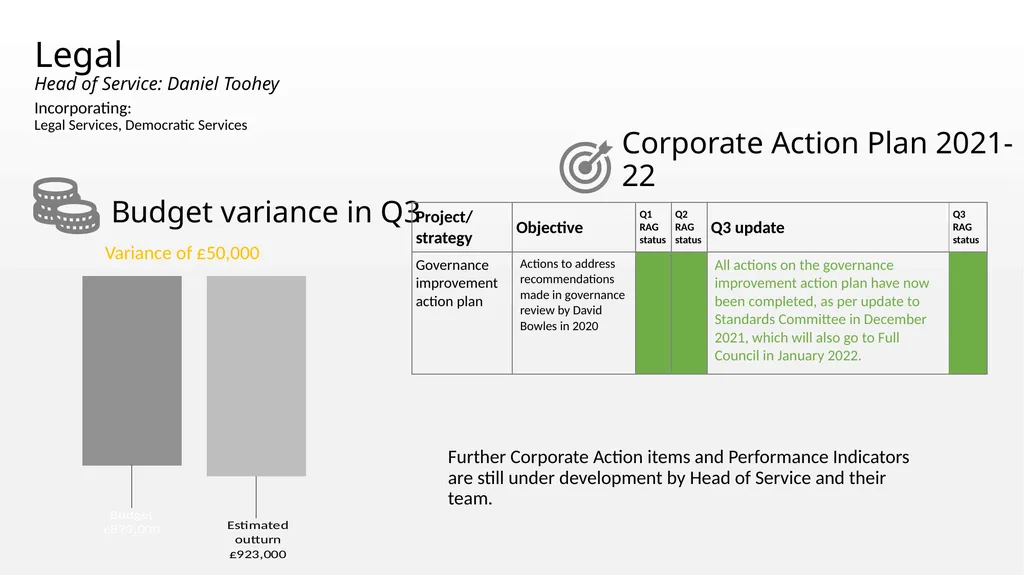
Legal�Head of Service: Daniel Toohey Budget variance in Q3 Corporate Action Plan 2021-22 Incorporating:�Legal Services, Democratic Services Variance of £50,000 Further Corporate Action items and Performance Indicators are still under development by Head of Service and their team.<br>
16
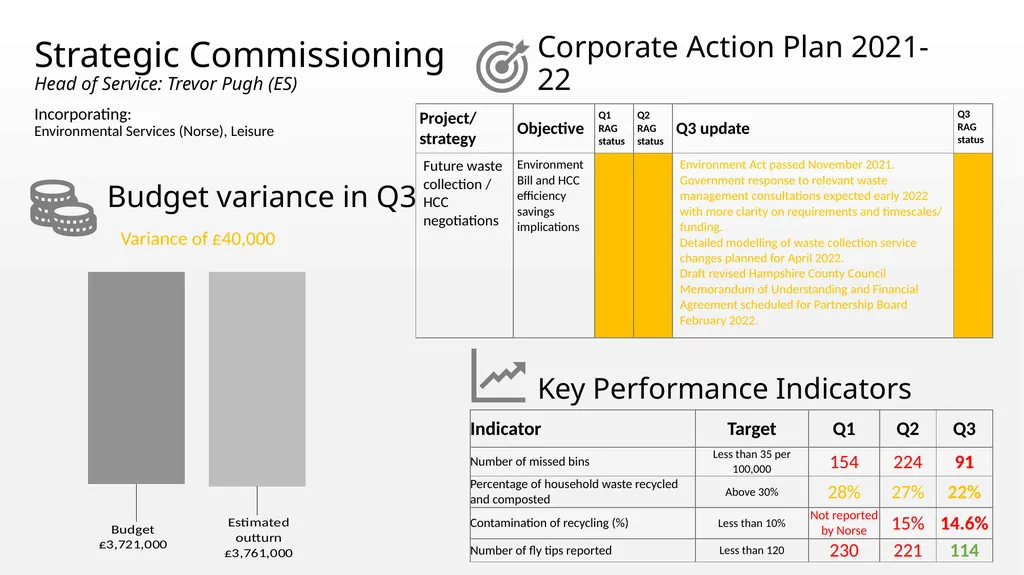
Strategic Commissioning�Head of Service: Trevor Pugh (ES) Key Performance Indicators Corporate Action Plan 2021-22 Incorporating:�Environmental Services (Norse), Leisure Budget variance in Q3 Variance of £40,000<br>
17
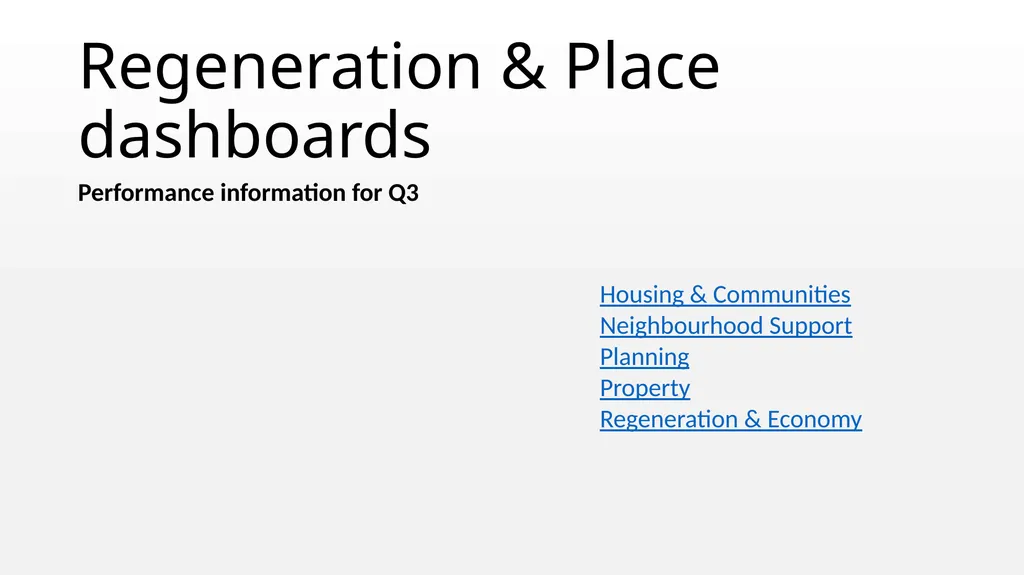
Regeneration & Place dashboards Performance information for Q3 Housing & Communities
Neighbourhood Support
Planning
Property
Regeneration & Economy<br>
18
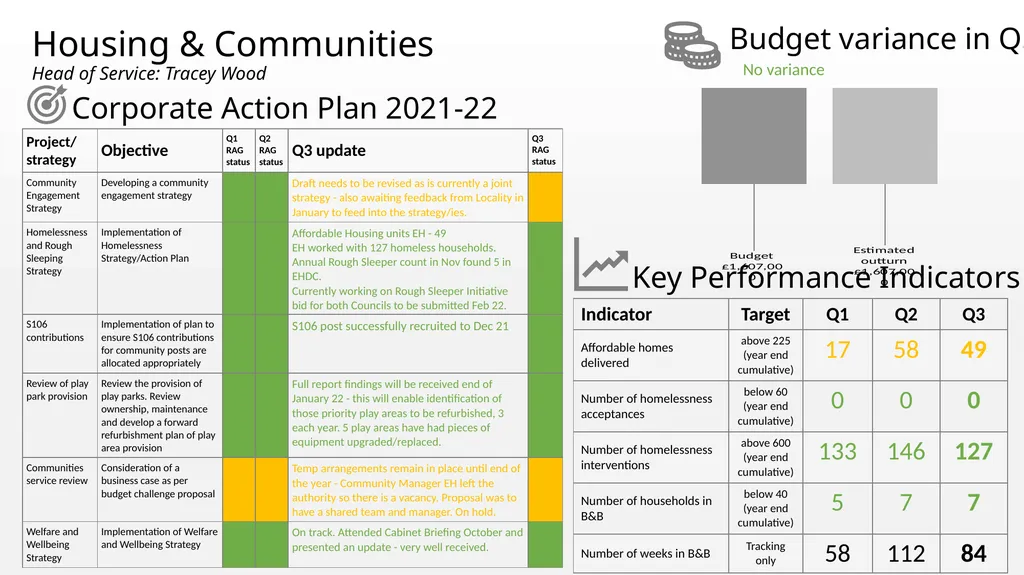
Housing & Communities�Head of Service: Tracey Wood Budget variance in Q3 No variance Key Performance Indicators Corporate Action Plan 2021-22<br>
19
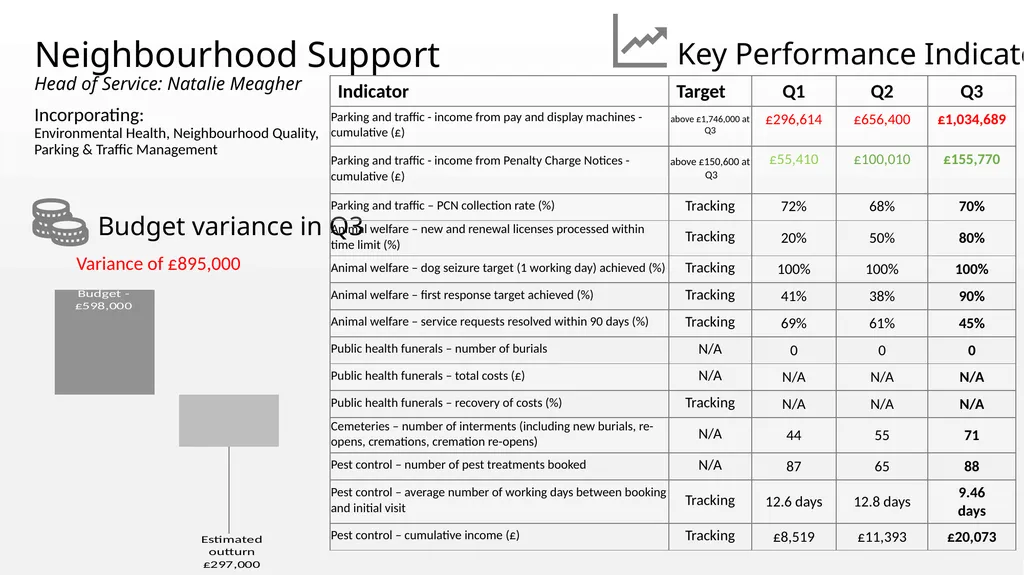
Neighbourhood Support�Head of Service: Natalie Meagher Incorporating:�Environmental Health, Neighbourhood Quality, Parking & Traffic Management Key Performance Indicators Budget variance in Q3 Variance of £895,000<br>
20
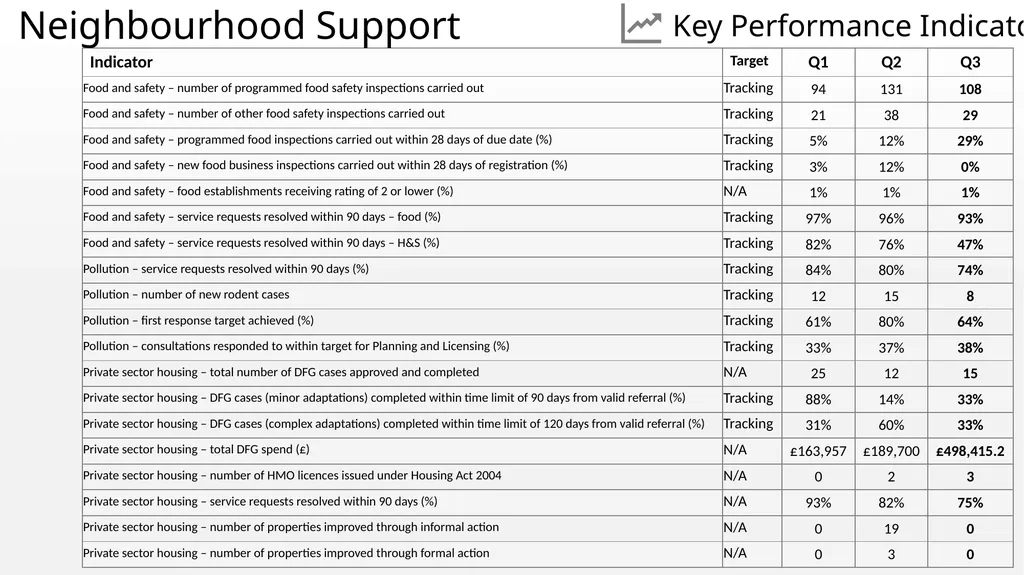
Neighbourhood Support Key Performance Indicators<br>
21
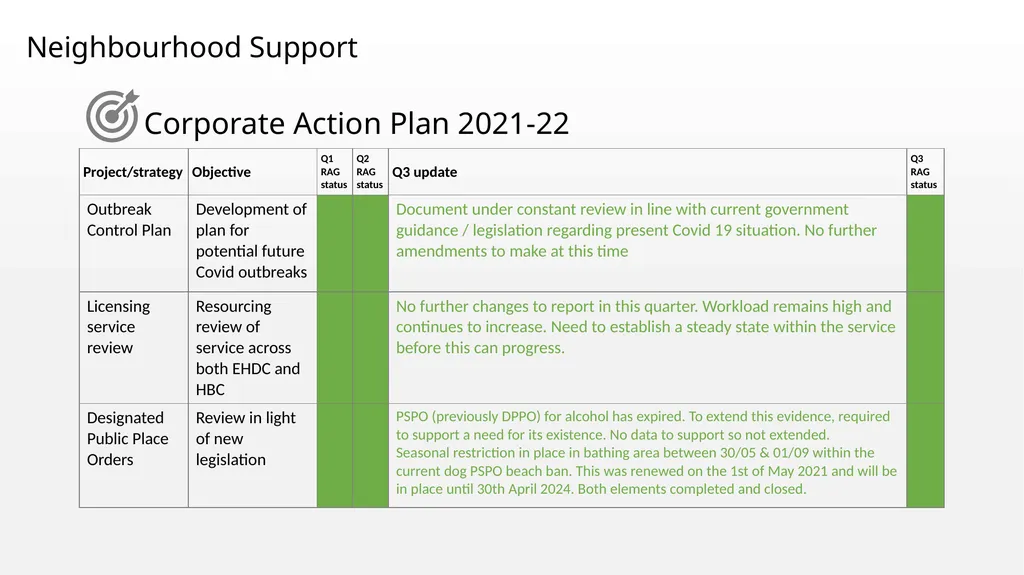
Neighbourhood Support Corporate Action Plan 2021-22<br>
22
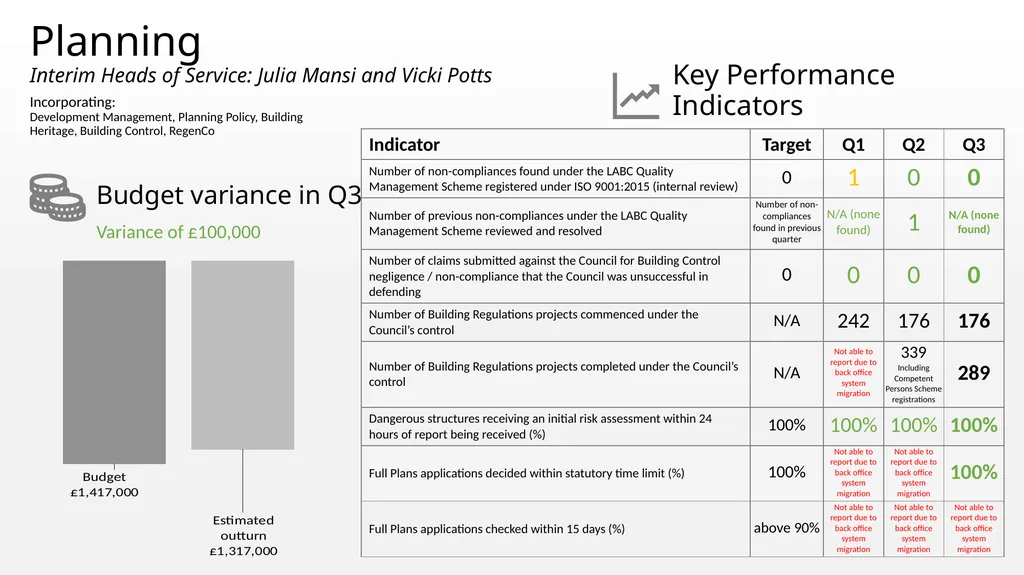
Planning�Interim Heads of Service: Julia Mansi and Vicki Potts Incorporating:�Development Management, Planning Policy, Building Heritage, Building Control, RegenCo Key Performance Indicators Budget variance in Q3 Variance of £100,000<br>
23
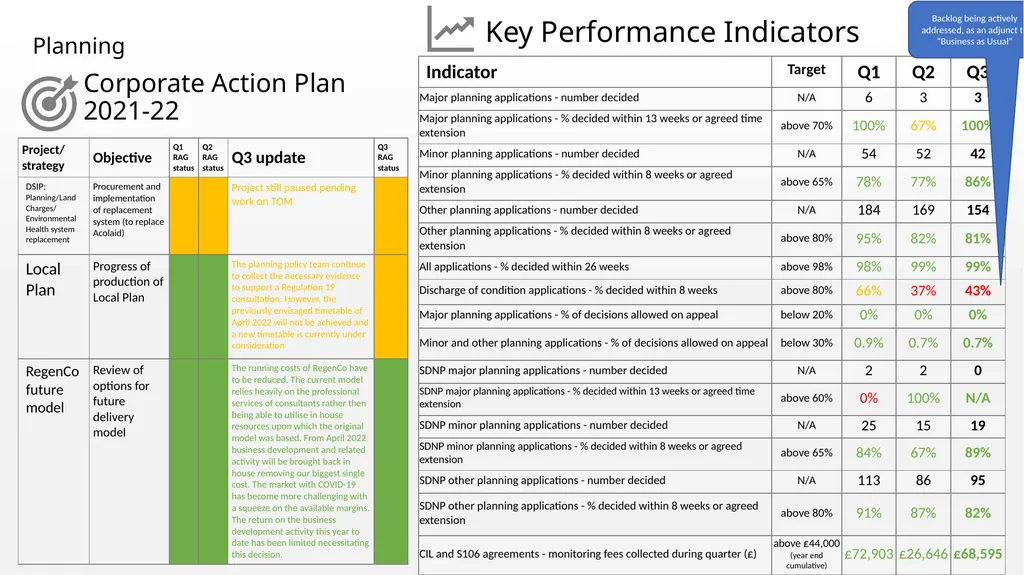
Backlog being actively addressed, as an adjunct to “Business as Usual” Key Performance Indicators Planning Corporate Action Plan 2021-22<br>
24
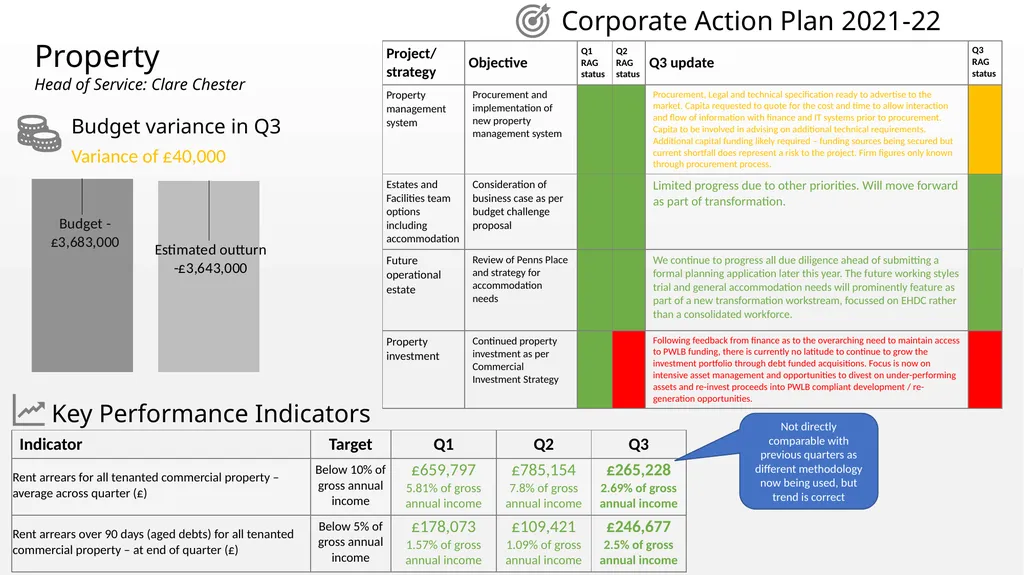
Property�Head of Service: Clare Chester Key Performance Indicators Corporate Action Plan 2021-22 Budget variance in Q3 Variance of £40,000 Not directly comparable with previous quarters as different methodology now being used, but trend is correct<br>
25
Regeneration & Economy�Head of Service: Clare Chester Corporate Action Plan 2021-22 Incorporating:�Regeneration & Placemaking, Economic Development No variance Budget variance in Q3<br>