Calculating for an Adequate System Tool (CAST) Tori Algee Rebecca Knight 1 Background CAST was developed by an interdisciplinary group of researchers at the Substance Abuse and Mental Health Services Administration (SAMHSA) Center for
"Calculating for an Adequate System Tool (CAST)" is the property of its rightful owner. Permission is granted to
download and print the materials on this website for personal, non-commercial use only, and to display it
on your personal computer provided you do not modify the materials and that you retain all copyright
notices contained in the materials. By downloading content from our website, you accept the terms of this
agreement.
Presentation Transcript
01
Calculating for an Adequate System Tool (CAST) Tori Algee & Rebecca Knight 1<br>
02
Background CAST was developed by an interdisciplinary group of researchers at the Substance Abuse and Mental Health Services Administration (SAMHSA) Center for Behavioral Health Statistics and Quality (CBHSQ) 2<br>
03
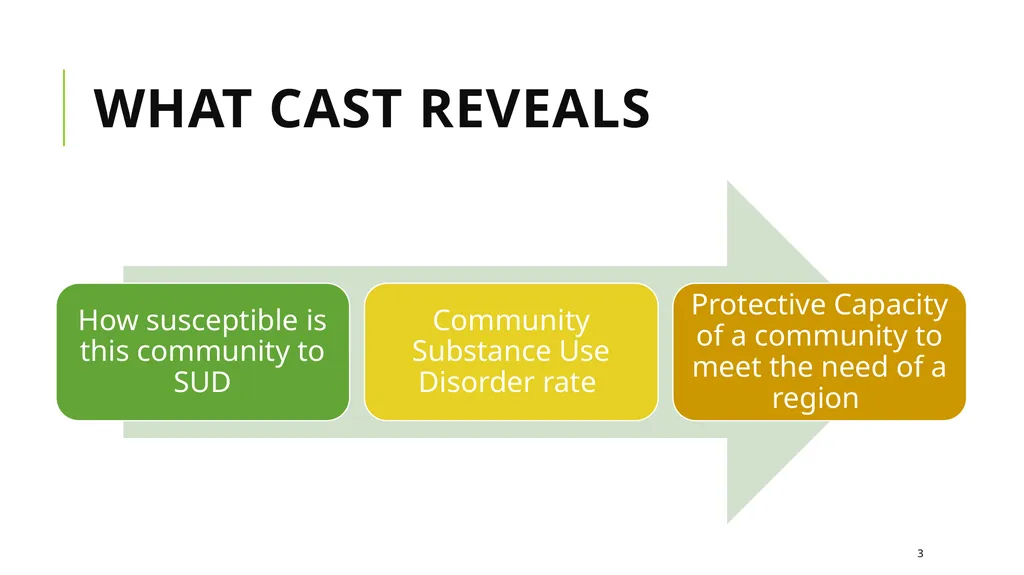
What CAST Reveals 3<br>
04
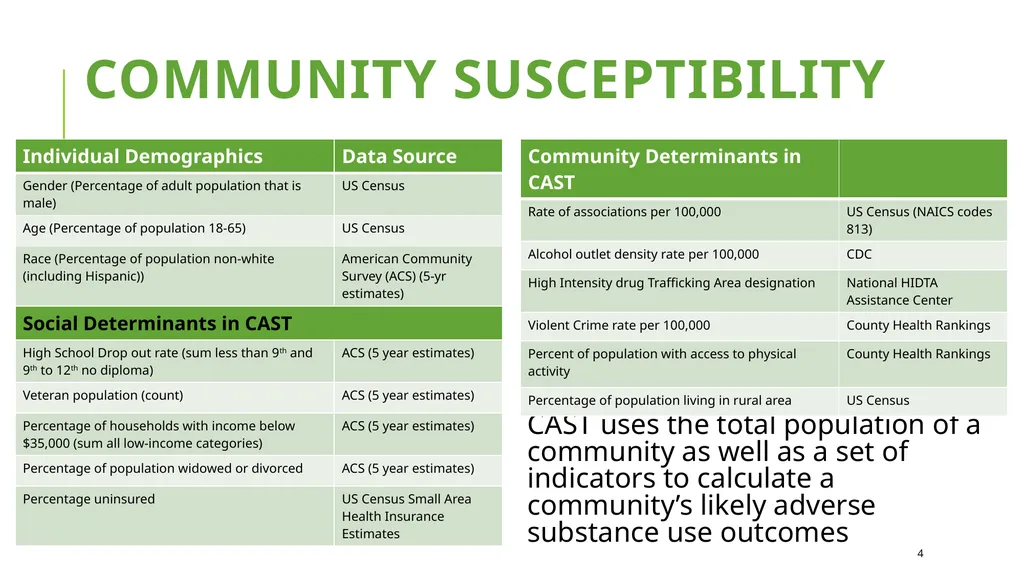
Community Susceptibility CAST uses the total population of a community as well as a set of indicators to calculate a community’s likely adverse substance use outcomes 4<br>
05
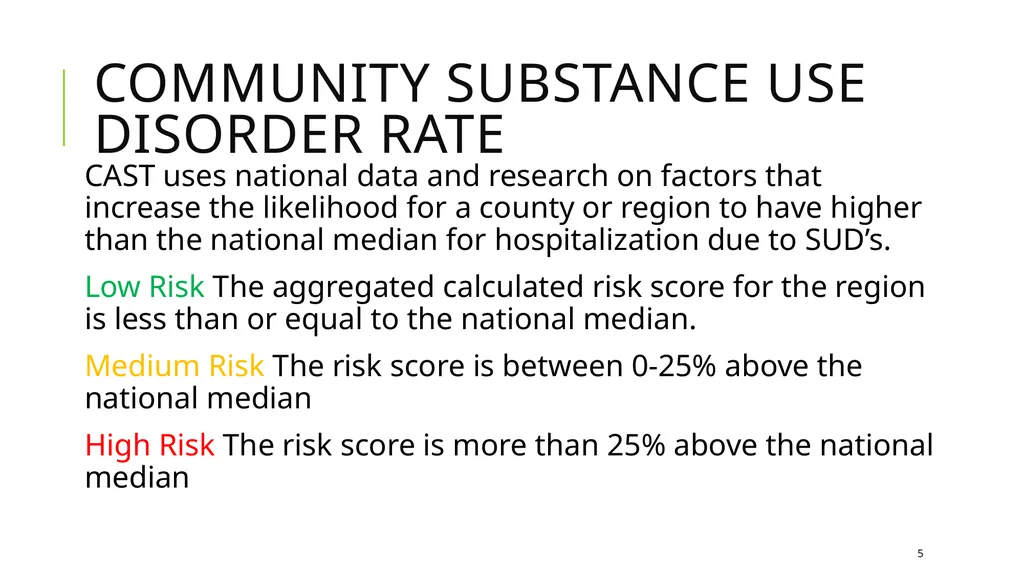
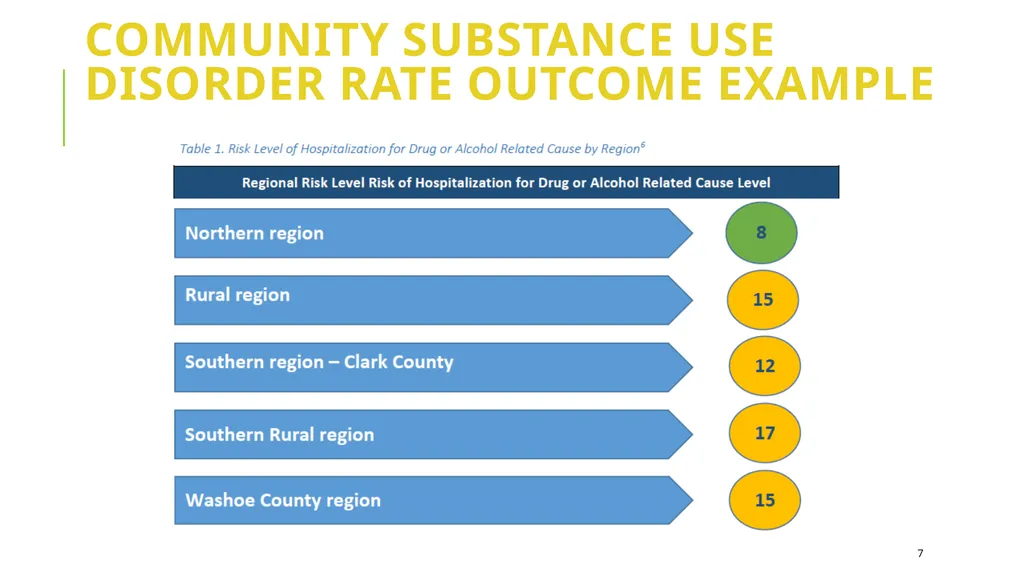
Community Substance Use Disorder Rate CAST uses national data and research on factors that increase the likelihood for a county or region to have higher than the national median for hospitalization due to SUD’s.
Low Risk The aggregated calculated risk score for the region is less than or equal to the national median.
Medium Risk The risk score is between 0-25% above the national median
High Risk The risk score is more than 25% above the national median 5<br>
06
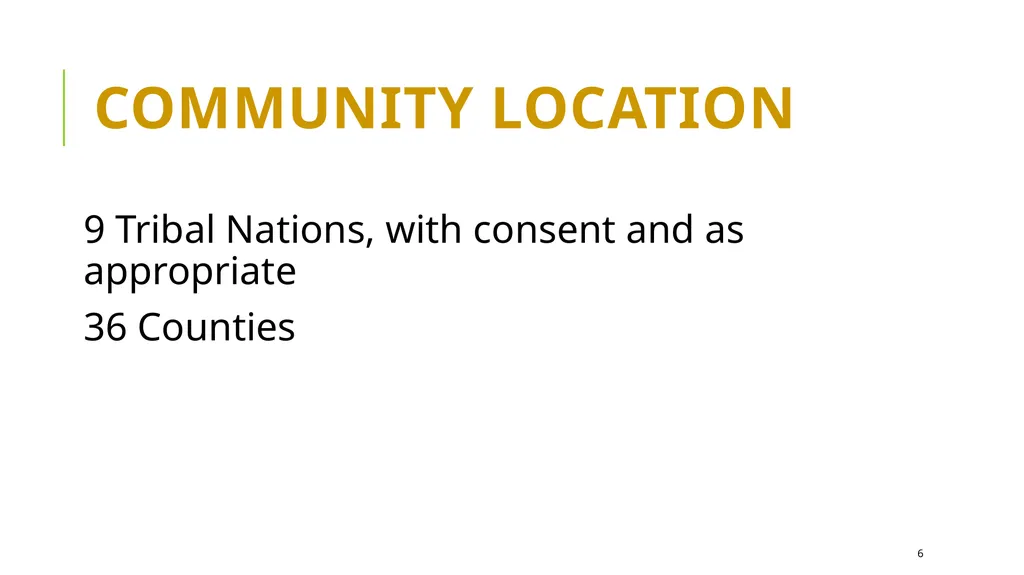
Community LOCATION 9 Tribal Nations, with consent and as appropriate
36 Counties 6<br>
07
Community Substance Use Disorder Rate Outcome EXAMPLE 7<br>
08
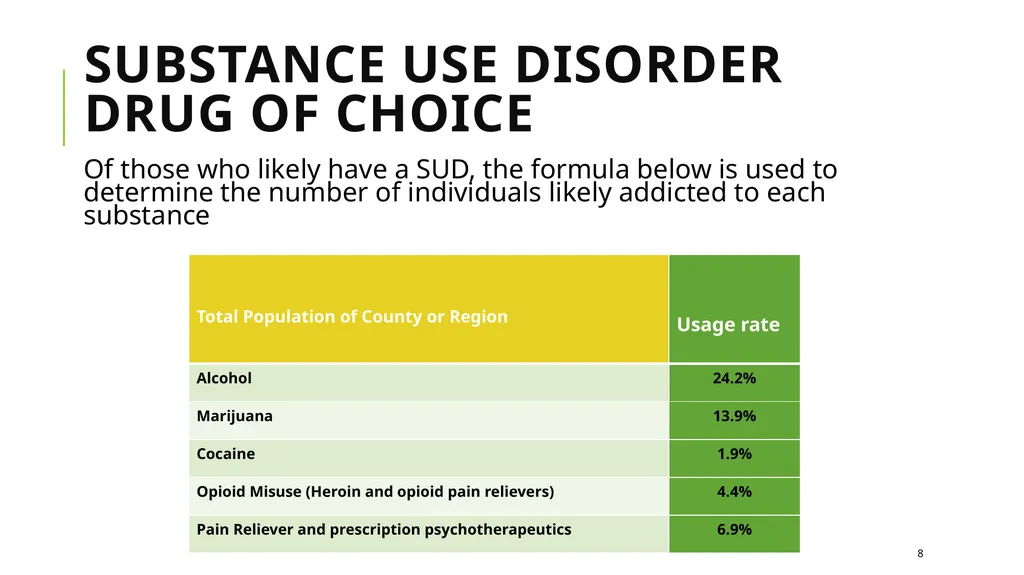
Substance Use Disorder Drug of Choice Of those who likely have a SUD, the formula below is used to determine the number of individuals likely addicted to each substance 8<br>
09
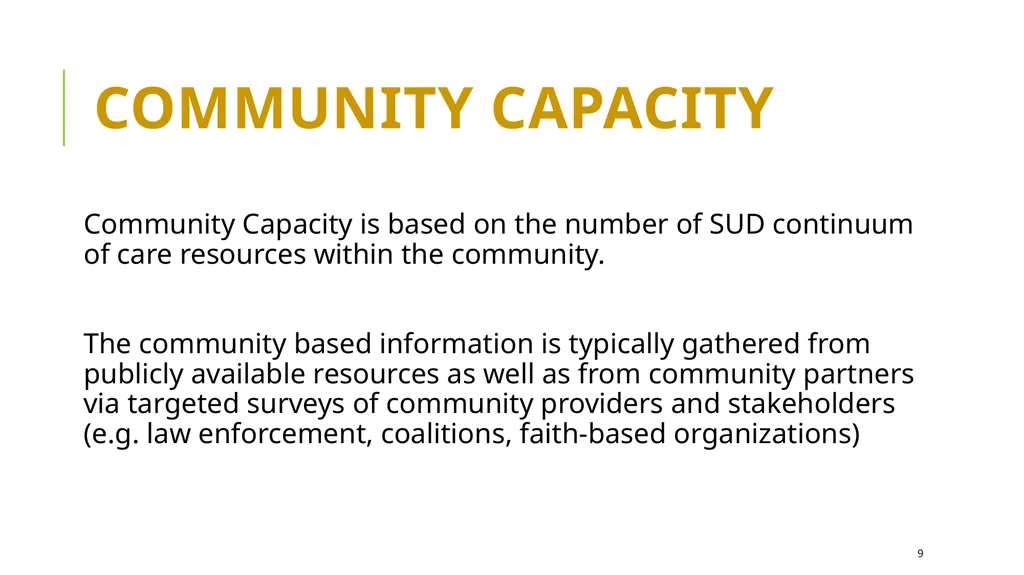
Community Capacity Community Capacity is based on the number of SUD continuum of care resources within the community.
The community based information is typically gathered from publicly available resources as well as from community partners via targeted surveys of community providers and stakeholders (e.g. law enforcement, coalitions, faith-based organizations) 9<br>
10
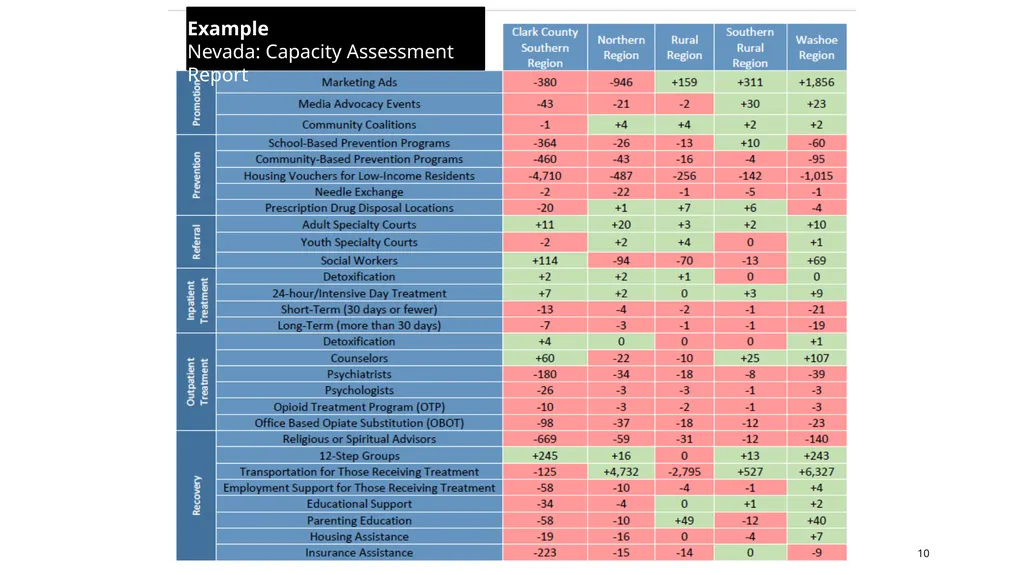
Example
Nevada: Capacity Assessment Report 10<br>
11
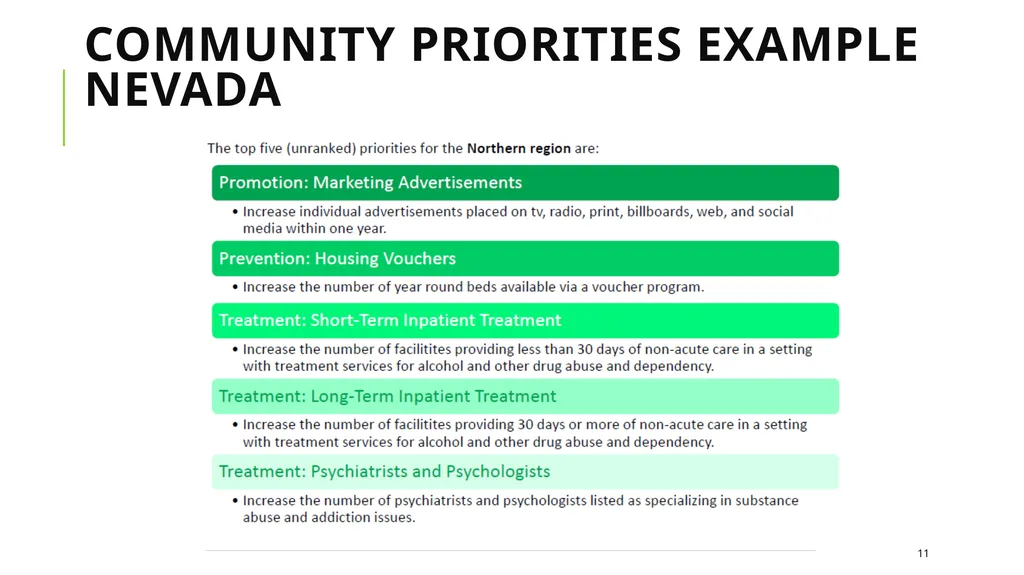
Community Priorities Example Nevada 11<br>
12
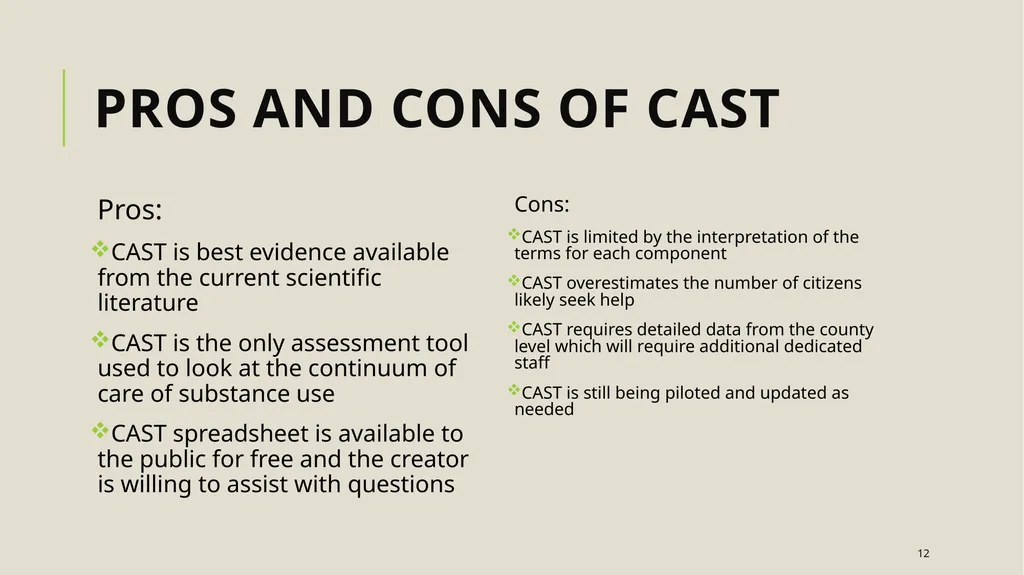
Pros and cons of CAST Pros:
CAST is best evidence available from the current scientific literature
CAST is the only assessment tool used to look at the continuum of care of substance use
CAST spreadsheet is available to the public for free and the creator is willing to assist with questions Cons:
CAST is limited by the interpretation of the terms for each component
CAST overestimates the number of citizens likely seek help
CAST requires detailed data from the county level which will require additional dedicated staff
CAST is still being piloted and updated as needed 12<br>