
Chapter 13 Decision Analysis Problem Formulation
LD
Published · 49 slides · 0 views

1 / 1


Description
Chapter 13 Decision Analysis Problem Formulation Decision Making without Probabilities Decision Making with Probabilities Risk Analysis and Sensitivity Analysis Decision Analysis with Sample Information Computing Branch Probabilities
Related Topics
Share
Embed code
Download this presentation From Below
"Chapter 13 Decision Analysis Problem Formulation" is the property of its rightful owner. Permission is granted to download and print the materials on this website for personal, non-commercial use only, and to display it on your personal computer provided you do not modify the materials and that you retain all copyright notices contained in the materials. By downloading content from our website, you accept the terms of this agreement.
Presentation Transcript
01
Chapter 13
Decision Analysis Problem Formulation
Decision Making without Probabilities
Decision Making with Probabilities
Risk Analysis and Sensitivity Analysis
Decision Analysis with Sample Information
Computing Branch Probabilities<br>
Decision Making without Probabilities
Decision Making with Probabilities
Risk Analysis and Sensitivity Analysis
Decision Analysis with Sample Information
Computing Branch Probabilities<br>
02
Decision Analysis Decision analysis can be used to develop an optimal strategy when a decision maker is faced with several decision alternatives and an uncertain or risk-filled pattern of future events.
Even when a careful decision analysis has been conducted, the uncertain future events make the final consequence uncertain.
The risk associated with any decision alternative is a direct result of the uncertainty associated with the final consequence.
Good decision analysis includes risk analysis that provides probability information about the favorable as well as the unfavorable consequences that may occur.<br>
Even when a careful decision analysis has been conducted, the uncertain future events make the final consequence uncertain.
The risk associated with any decision alternative is a direct result of the uncertainty associated with the final consequence.
Good decision analysis includes risk analysis that provides probability information about the favorable as well as the unfavorable consequences that may occur.<br>
03
Problem Formulation A decision problem is characterized by decision alternatives, states of nature, and resulting payoffs.
The decision alternatives are the different possible strategies the decision maker can employ.
The states of nature refer to future events, not under the control of the decision maker, which may occur. States of nature should be defined so that they are mutually exclusive and collectively exhaustive.<br>
The decision alternatives are the different possible strategies the decision maker can employ.
The states of nature refer to future events, not under the control of the decision maker, which may occur. States of nature should be defined so that they are mutually exclusive and collectively exhaustive.<br>
04
Pittsburgh Development Corporation (PDC) purchased land that will be the site of a new luxury condominium complex. PDC commissioned preliminary architectural drawings for three different projects: one with 30, one with 60, and one with 90 condominiums.
The financial success of the project depends upon the size of the condominium complex and the chance event concerning the demand for the condominiums. The statement of the PDC decision problem is to select the size of the new complex that will lead to the largest profit given the uncertainty concerning the demand for the condominiums. Example: Pittsburgh Development Corp.<br>
The financial success of the project depends upon the size of the condominium complex and the chance event concerning the demand for the condominiums. The statement of the PDC decision problem is to select the size of the new complex that will lead to the largest profit given the uncertainty concerning the demand for the condominiums. Example: Pittsburgh Development Corp.<br>
05
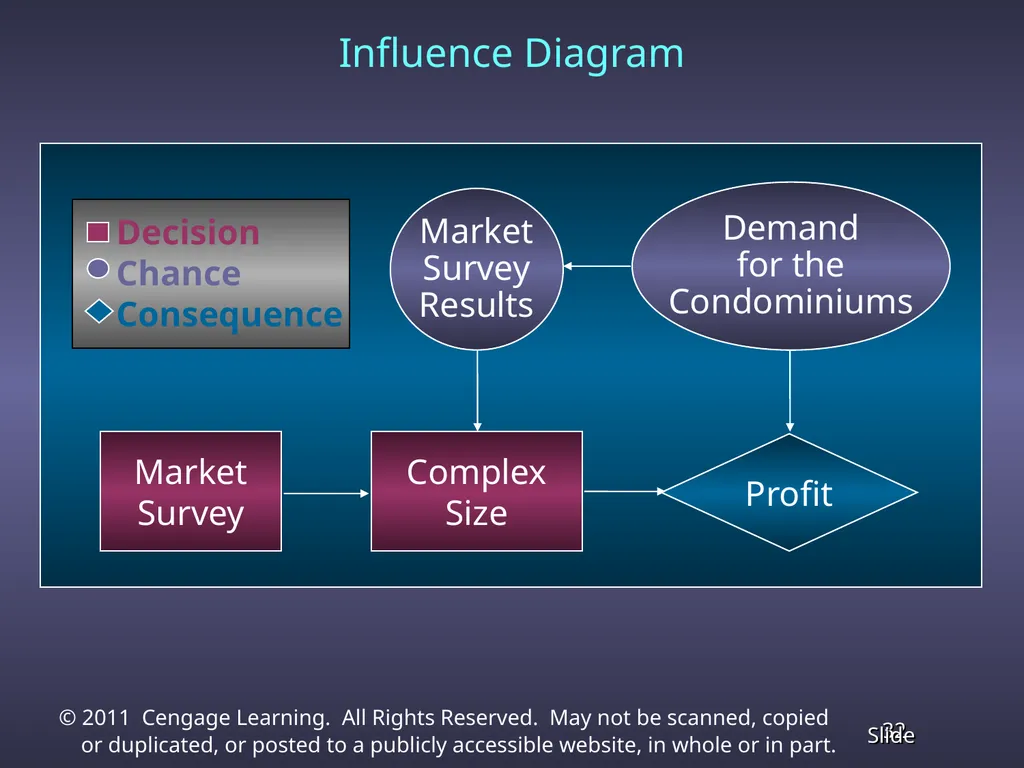
Influence Diagrams An influence diagram is a graphical device showing the relationships among the decisions, the chance events, and the consequences.
Squares or rectangles depict decision nodes.
Circles or ovals depict chance nodes.
Diamonds depict consequence nodes.
Lines or arcs connecting the nodes show the direction of influence.<br>
Squares or rectangles depict decision nodes.
Circles or ovals depict chance nodes.
Diamonds depict consequence nodes.
Lines or arcs connecting the nodes show the direction of influence.<br>
06
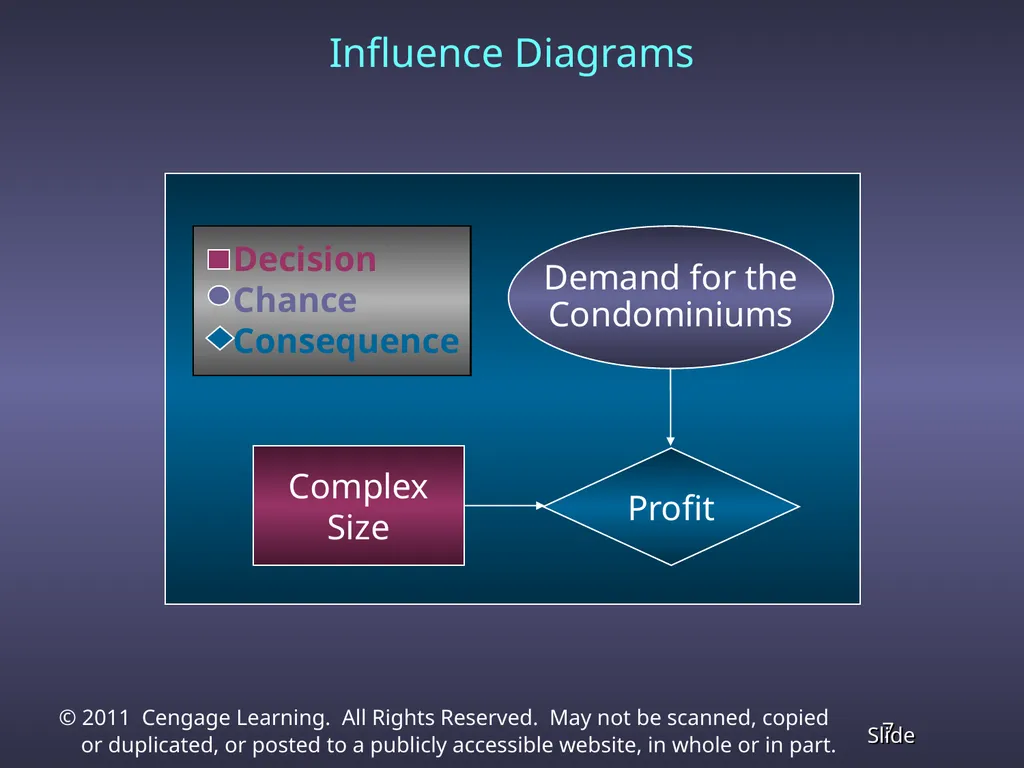
Complex
Size Profit Demand for the
Condominiums Decision
Chance
Consequence Influence Diagrams<br>
Size Profit Demand for the
Condominiums Decision
Chance
Consequence Influence Diagrams<br>
07
Payoff Tables The consequence resulting from a specific combination of a decision alternative and a state of nature is a payoff.
A table showing payoffs for all combinations of decision alternatives and states of nature is a payoff table.
Payoffs can be expressed in terms of profit, cost, time, distance or any other appropriate measure.<br>
A table showing payoffs for all combinations of decision alternatives and states of nature is a payoff table.
Payoffs can be expressed in terms of profit, cost, time, distance or any other appropriate measure.<br>
08
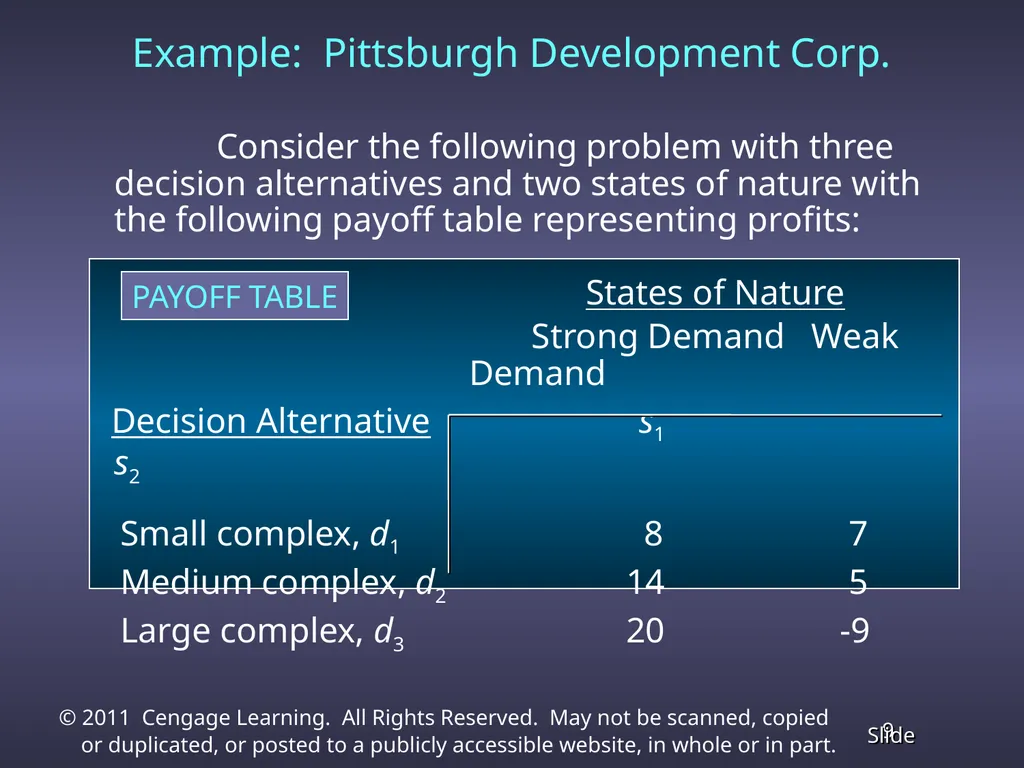
Consider the following problem with three decision alternatives and two states of nature with the following payoff table representing profits:
States of Nature
Strong Demand Weak Demand
Decision Alternative s1 s2
Small complex, d1 8 7
Medium complex, d2 14 5
Large complex, d3 20 -9 PAYOFF TABLE Example: Pittsburgh Development Corp.<br>
States of Nature
Strong Demand Weak Demand
Decision Alternative s1 s2
Small complex, d1 8 7
Medium complex, d2 14 5
Large complex, d3 20 -9 PAYOFF TABLE Example: Pittsburgh Development Corp.<br>
09
Decision Making without Probabilities Three commonly used criteria for decision making when probability information regarding the likelihood of the states of nature is unavailable are:
the optimistic approach
the conservative approach
the minimax regret approach.<br>
the optimistic approach
the conservative approach
the minimax regret approach.<br>
10
Optimistic Approach The optimistic approach would be used by an optimistic decision maker.
The decision with the largest possible payoff is chosen.
If the payoff table was in terms of costs, the decision with the lowest cost would be chosen.<br>
The decision with the largest possible payoff is chosen.
If the payoff table was in terms of costs, the decision with the lowest cost would be chosen.<br>
11
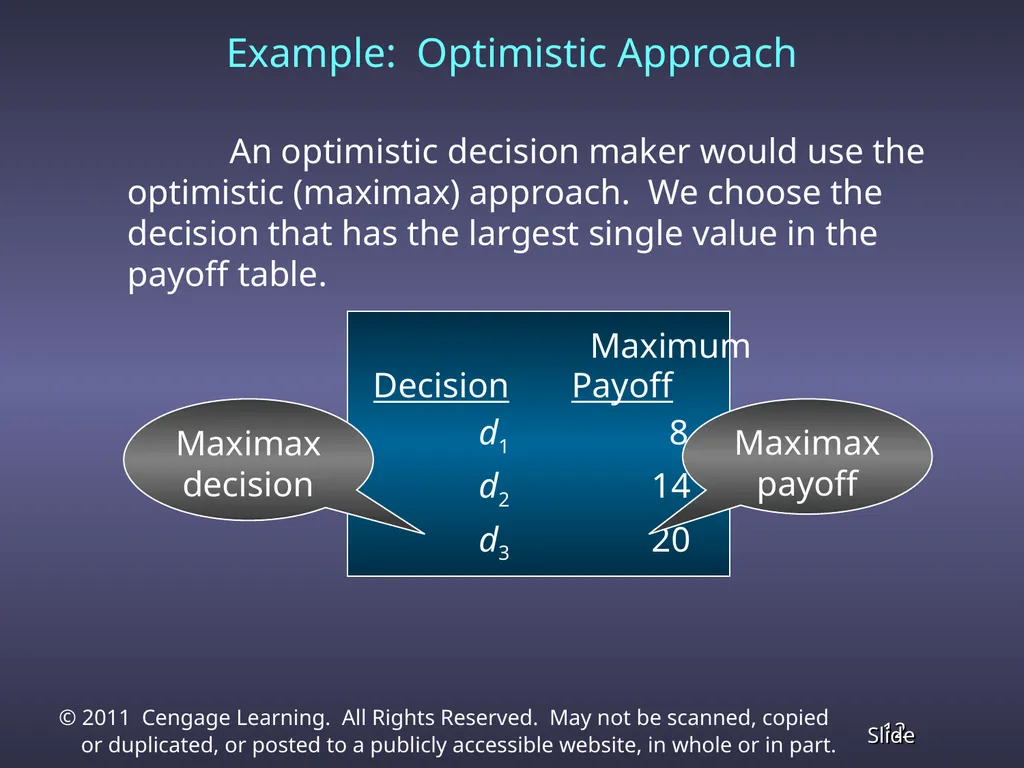
Example: Optimistic Approach An optimistic decision maker would use the optimistic (maximax) approach. We choose the decision that has the largest single value in the payoff table.
Maximum
Decision Payoff
d1 8
d2 14
d3 20 Maximax
payoff Maximaxdecision<br>
Maximum
Decision Payoff
d1 8
d2 14
d3 20 Maximax
payoff Maximaxdecision<br>
12
Conservative Approach The conservative approach would be used by a conservative decision maker.
For each decision the minimum payoff is listed and then the decision corresponding to the maximum of these minimum payoffs is selected. (Hence, the minimum possible payoff is maximized.)
If the payoff was in terms of costs, the maximum costs would be determined for each decision and then the decision corresponding to the minimum of these maximum costs is selected. (Hence, the maximum possible cost is minimized.)<br>
For each decision the minimum payoff is listed and then the decision corresponding to the maximum of these minimum payoffs is selected. (Hence, the minimum possible payoff is maximized.)
If the payoff was in terms of costs, the maximum costs would be determined for each decision and then the decision corresponding to the minimum of these maximum costs is selected. (Hence, the maximum possible cost is minimized.)<br>
13
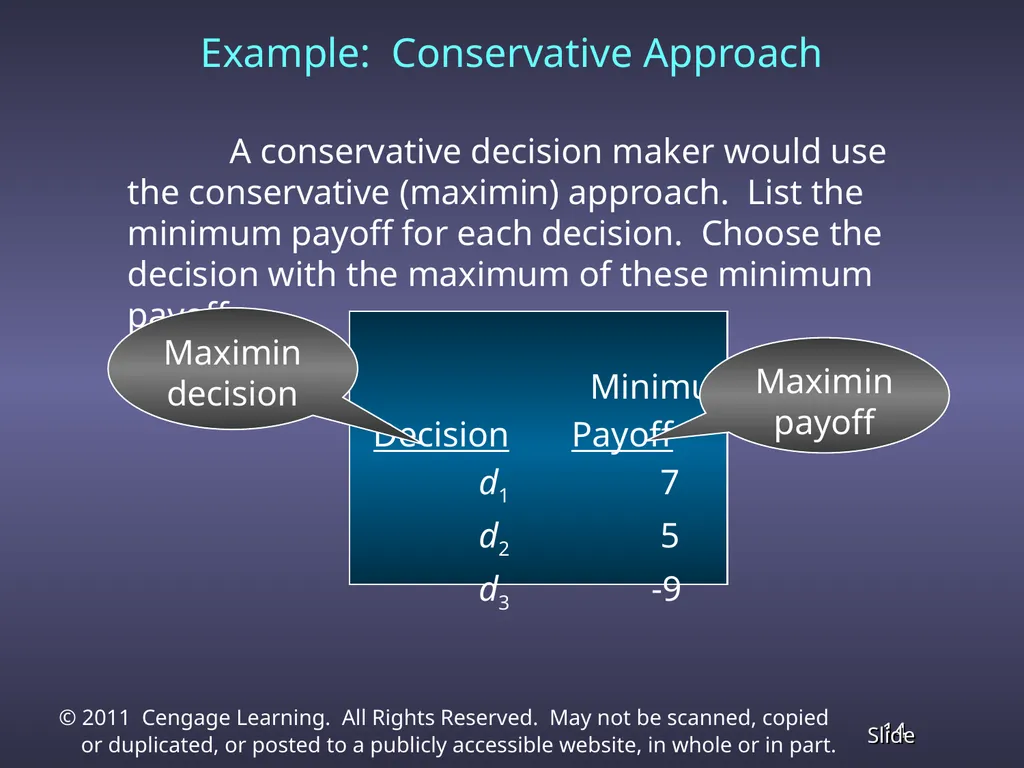
Example: Conservative Approach A conservative decision maker would use the conservative (maximin) approach. List the minimum payoff for each decision. Choose the decision with the maximum of these minimum payoffs.
Minimum
Decision Payoff
d1 7
d2 5
d3 -9 Maximin
decision Maximin
payoff<br>
Minimum
Decision Payoff
d1 7
d2 5
d3 -9 Maximin
decision Maximin
payoff<br>
14
Minimax Regret Approach The minimax regret approach requires the construction of a regret table or an opportunity loss table.
This is done by calculating for each state of nature the difference between each payoff and the largest payoff for that state of nature.
Then, using this regret table, the maximum regret for each possible decision is listed.
The decision chosen is the one corresponding to the minimum of the maximum regrets.<br>
This is done by calculating for each state of nature the difference between each payoff and the largest payoff for that state of nature.
Then, using this regret table, the maximum regret for each possible decision is listed.
The decision chosen is the one corresponding to the minimum of the maximum regrets.<br>
15
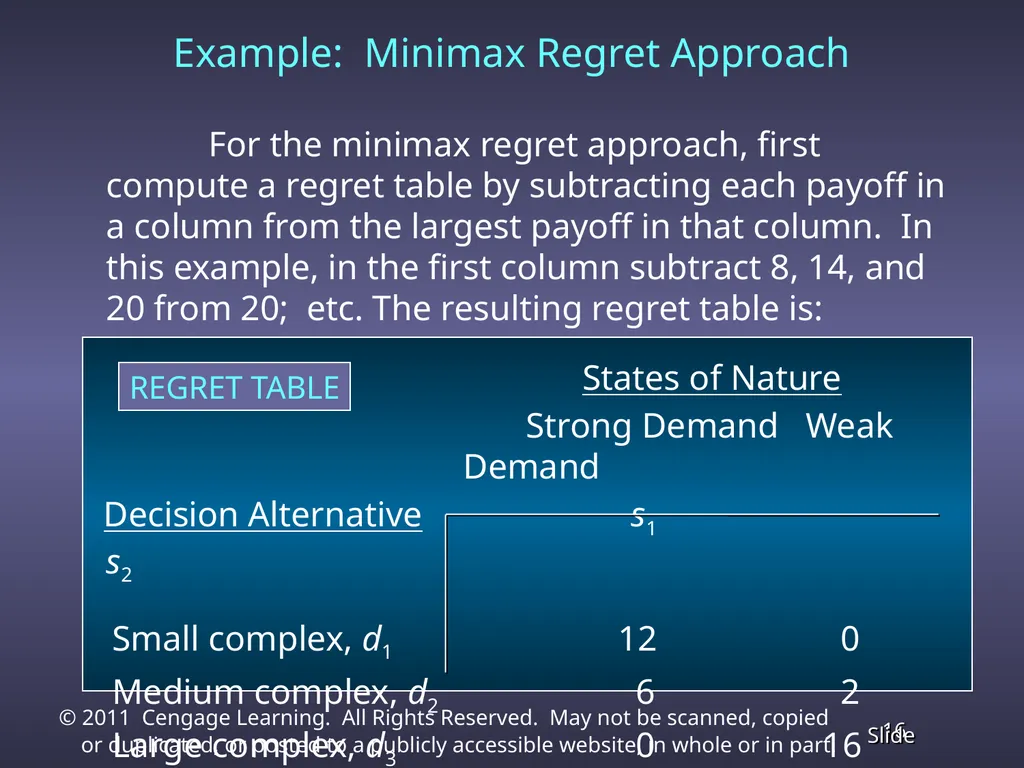
For the minimax regret approach, first compute a regret table by subtracting each payoff in a column from the largest payoff in that column. In this example, in the first column subtract 8, 14, and 20 from 20; etc. The resulting regret table is:
States of Nature
Strong Demand Weak Demand
Decision Alternative s1 s2
Small complex, d1 12 0
Medium complex, d2 6 2
Large complex, d3 0 16 Example: Minimax Regret Approach REGRET TABLE<br>
States of Nature
Strong Demand Weak Demand
Decision Alternative s1 s2
Small complex, d1 12 0
Medium complex, d2 6 2
Large complex, d3 0 16 Example: Minimax Regret Approach REGRET TABLE<br>
16
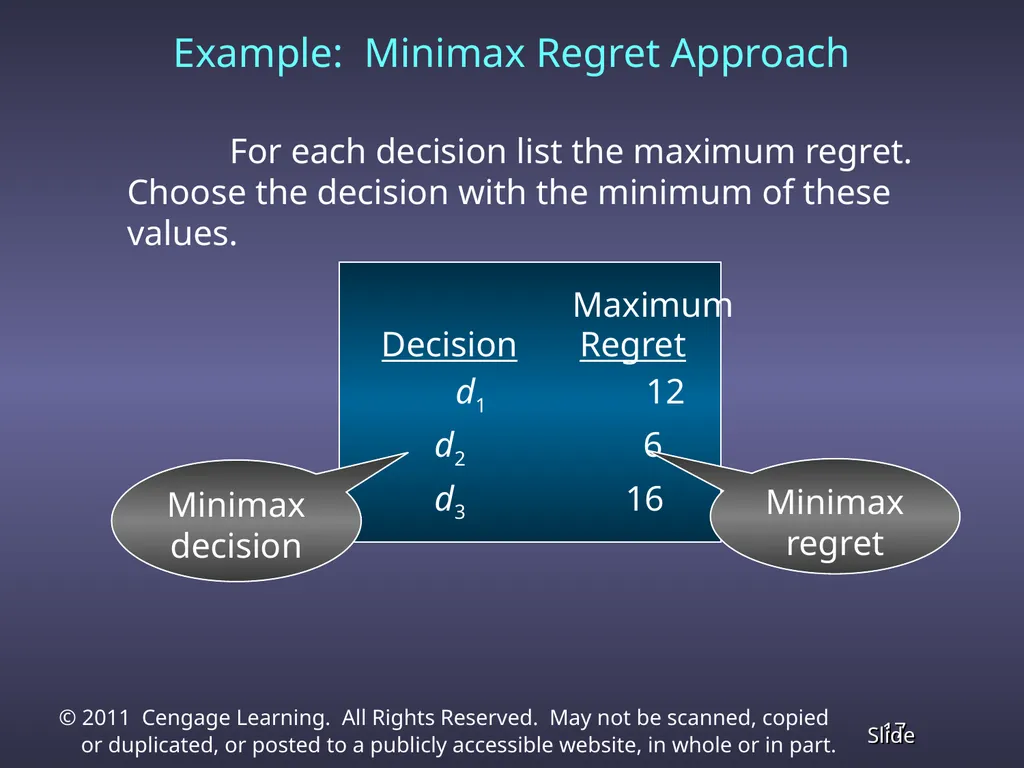
For each decision list the maximum regret. Choose the decision with the minimum of these values.
Maximum
Decision Regret
d1 12
d2 6
d3 16 Example: Minimax Regret Approach Minimax
decision Minimax
regret<br>
Maximum
Decision Regret
d1 12
d2 6
d3 16 Example: Minimax Regret Approach Minimax
decision Minimax
regret<br>
17
Decision Making with Probabilities Expected Value Approach
If probabilistic information regarding the states of nature is available, one may use the expected value (EV) approach.
Here the expected return for each decision is calculated by summing the products of the payoff under each state of nature and the probability of the respective state of nature occurring.
The decision yielding the best expected return is chosen.<br>
If probabilistic information regarding the states of nature is available, one may use the expected value (EV) approach.
Here the expected return for each decision is calculated by summing the products of the payoff under each state of nature and the probability of the respective state of nature occurring.
The decision yielding the best expected return is chosen.<br>
18
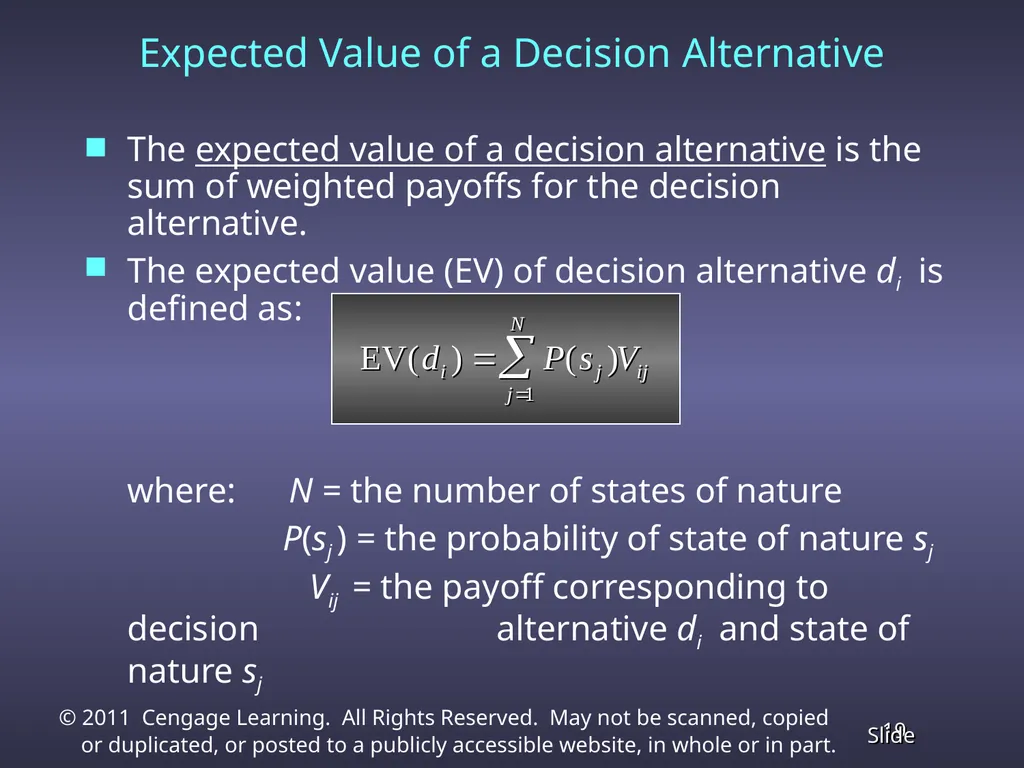
The expected value of a decision alternative is the sum of weighted payoffs for the decision alternative.
The expected value (EV) of decision alternative di is defined as:
where: N = the number of states of nature
P(sj ) = the probability of state of nature sj
Vij = the payoff corresponding to decision alternative di and state of nature sj Expected Value of a Decision Alternative<br>
The expected value (EV) of decision alternative di is defined as:
where: N = the number of states of nature
P(sj ) = the probability of state of nature sj
Vij = the payoff corresponding to decision alternative di and state of nature sj Expected Value of a Decision Alternative<br>
19
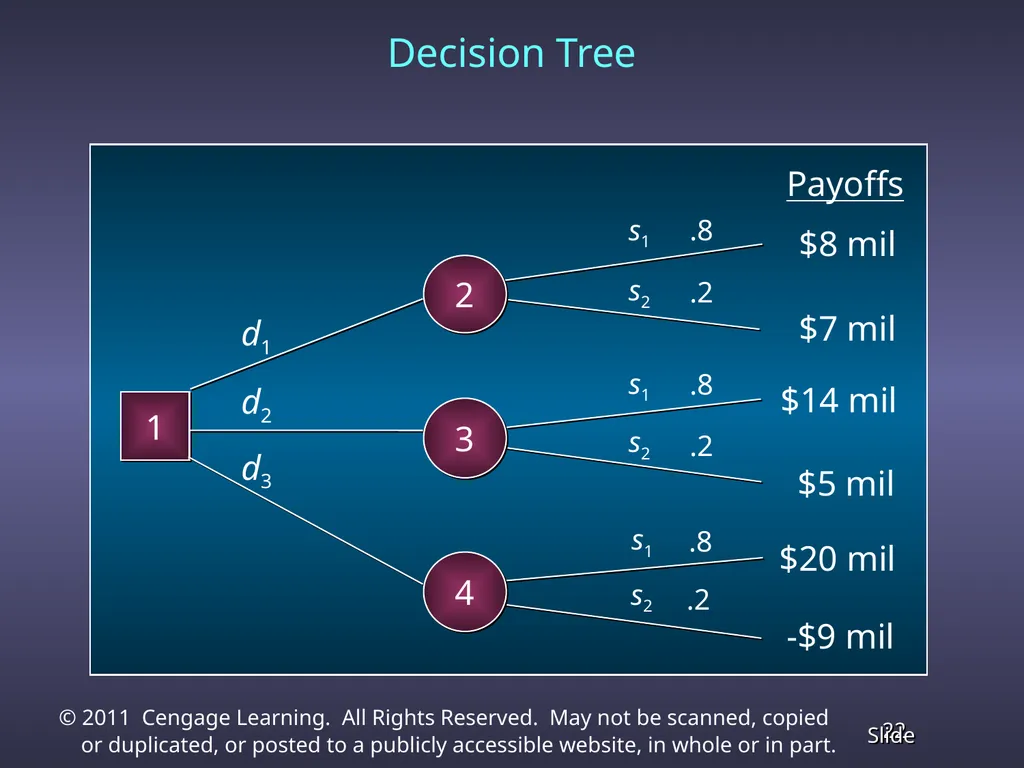
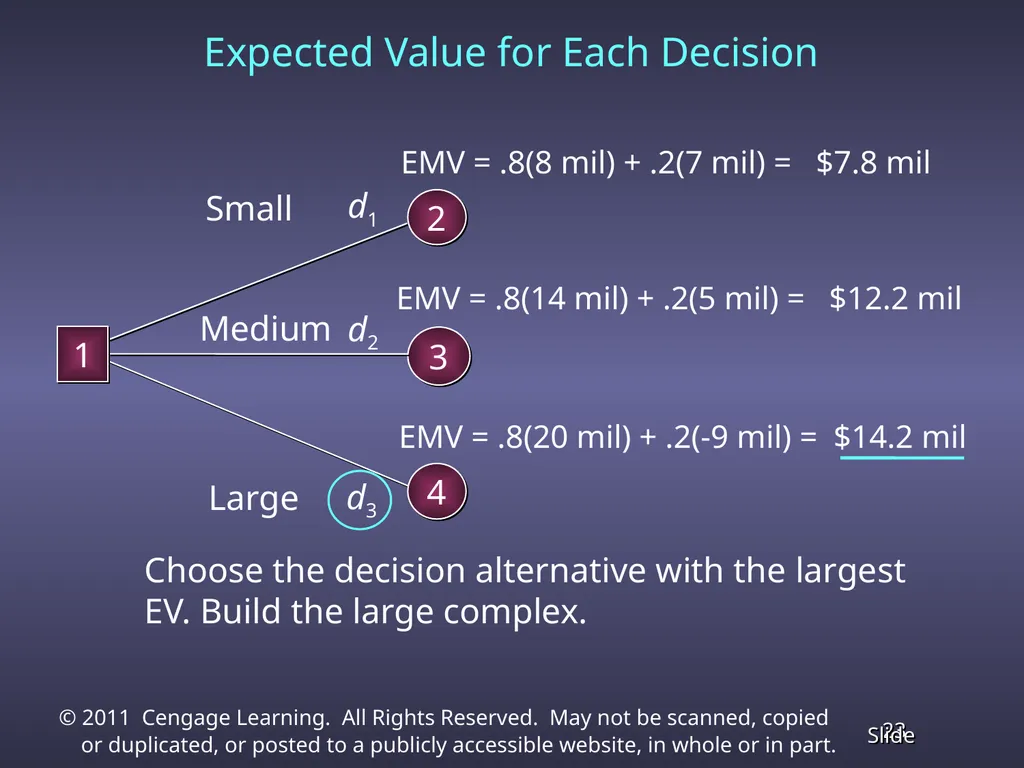
Expected Value Approach Calculate the expected value for each decision. The decision tree on the next slide can assist in this calculation. Here d1, d2, and d3 represent the decision alternatives of building a small, medium, and large complex, while s1 and s2 represent the states of nature of strong demand and weak demand.<br>
20
Decision Trees A decision tree is a chronological representation of the decision problem.
Each decision tree has two types of nodes; round nodes correspond to the states of nature while square nodes correspond to the decision alternatives.
The branches leaving each round node represent the different states of nature while the branches leaving each square node represent the different decision alternatives.
At the end of each limb of a tree are the payoffs attained from the series of branches making up that limb.<br>
Each decision tree has two types of nodes; round nodes correspond to the states of nature while square nodes correspond to the decision alternatives.
The branches leaving each round node represent the different states of nature while the branches leaving each square node represent the different decision alternatives.
At the end of each limb of a tree are the payoffs attained from the series of branches making up that limb.<br>
21
Decision Tree 1 .8 .2 .8 .2 .8 .2 d1 d2 d3 s1 s1 s1 s2 s2 s2 Payoffs $8 mil $7 mil $14 mil $5 mil $20 mil -$9 mil 2 3 4<br>
22
Expected Value for Each Decision Choose the decision alternative with the largest EV. Build the large complex. 3 d1 d2 d3 EMV = .8(8 mil) + .2(7 mil) = $7.8 mil EMV = .8(14 mil) + .2(5 mil) = $12.2 mil EMV = .8(20 mil) + .2(-9 mil) = $14.2 mil Small Medium Large 2 1 4<br>
23
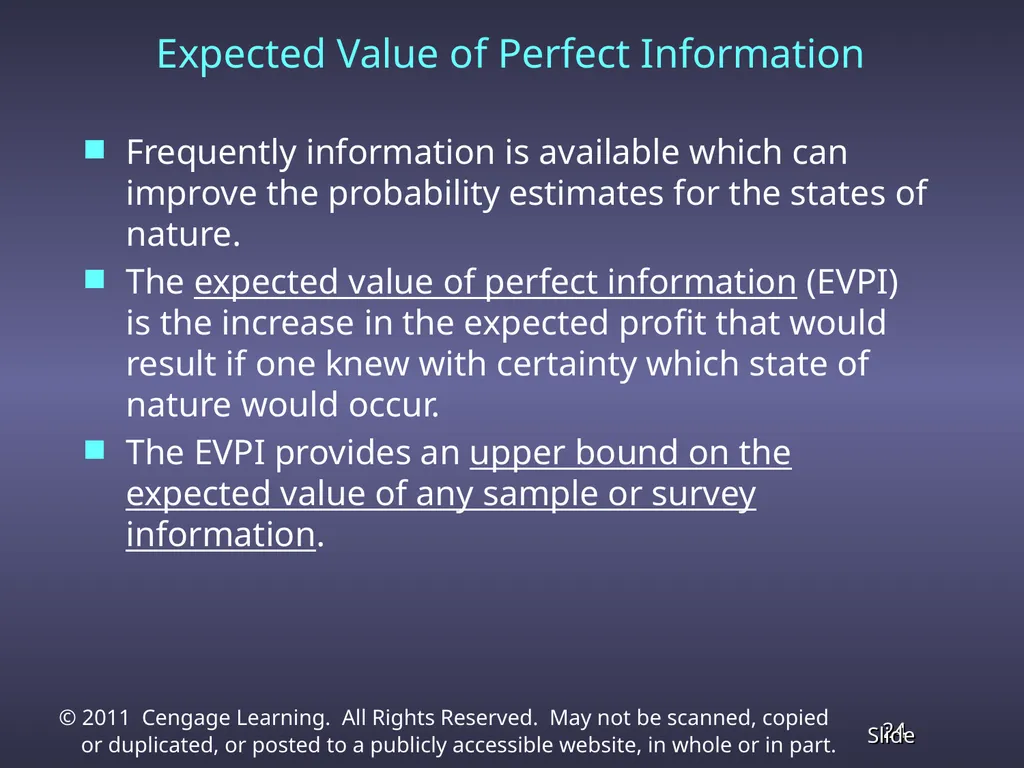
Expected Value of Perfect Information Frequently information is available which can improve the probability estimates for the states of nature.
The expected value of perfect information (EVPI) is the increase in the expected profit that would result if one knew with certainty which state of nature would occur.
The EVPI provides an upper bound on the expected value of any sample or survey information.<br>
The expected value of perfect information (EVPI) is the increase in the expected profit that would result if one knew with certainty which state of nature would occur.
The EVPI provides an upper bound on the expected value of any sample or survey information.<br>
24
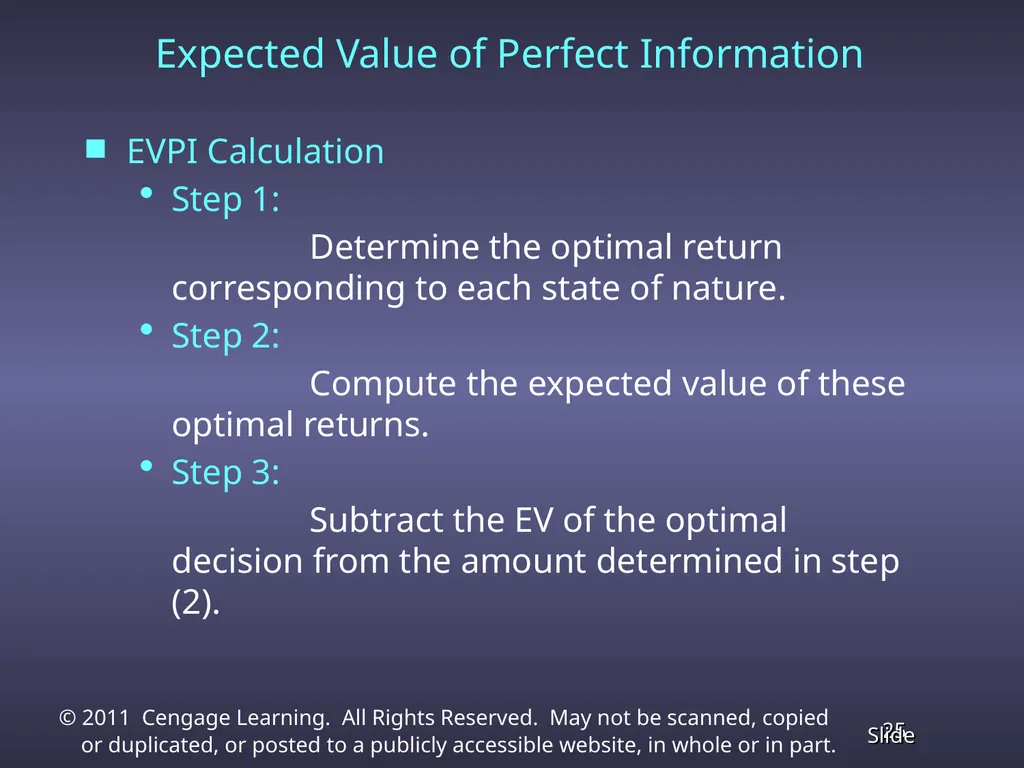
Expected Value of Perfect Information EVPI Calculation
Step 1:
Determine the optimal return corresponding to each state of nature.
Step 2:
Compute the expected value of these optimal returns.
Step 3:
Subtract the EV of the optimal decision from the amount determined in step (2).<br>
Step 1:
Determine the optimal return corresponding to each state of nature.
Step 2:
Compute the expected value of these optimal returns.
Step 3:
Subtract the EV of the optimal decision from the amount determined in step (2).<br>
25
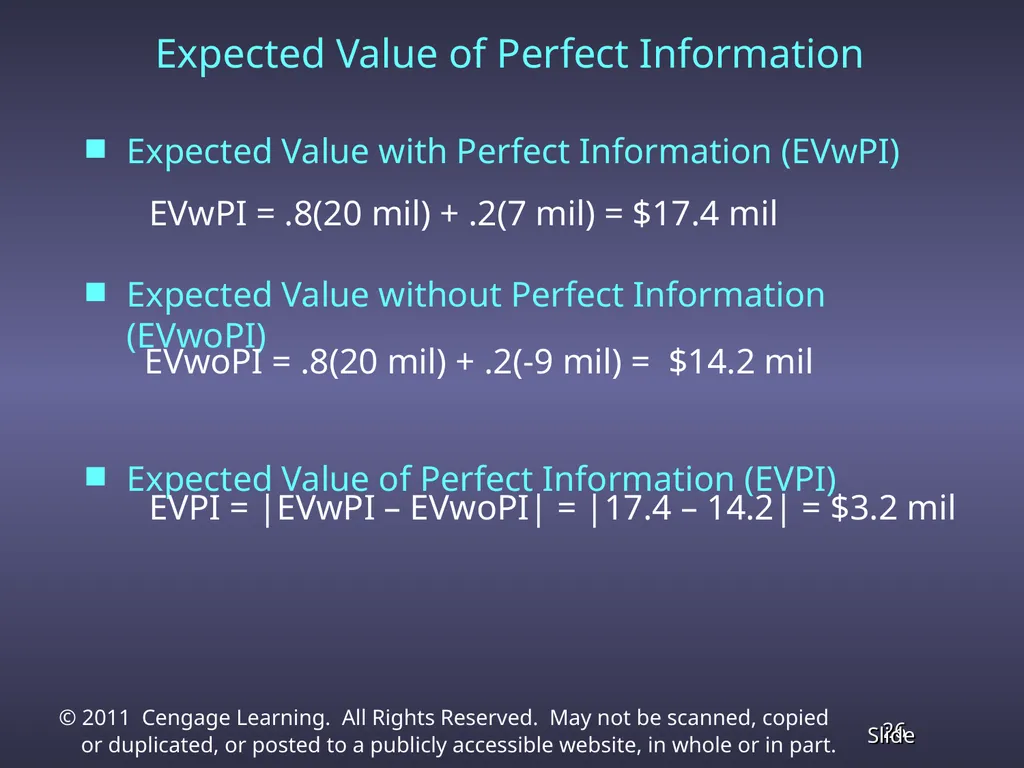
Expected Value with Perfect Information (EVwPI)
Expected Value without Perfect Information (EVwoPI)
Expected Value of Perfect Information (EVPI) Expected Value of Perfect Information EVwPI = .8(20 mil) + .2(7 mil) = $17.4 mil EVwoPI = .8(20 mil) + .2(-9 mil) = $14.2 mil EVPI = |EVwPI – EVwoPI| = |17.4 – 14.2| = $3.2 mil<br>
Expected Value without Perfect Information (EVwoPI)
Expected Value of Perfect Information (EVPI) Expected Value of Perfect Information EVwPI = .8(20 mil) + .2(7 mil) = $17.4 mil EVwoPI = .8(20 mil) + .2(-9 mil) = $14.2 mil EVPI = |EVwPI – EVwoPI| = |17.4 – 14.2| = $3.2 mil<br>
26
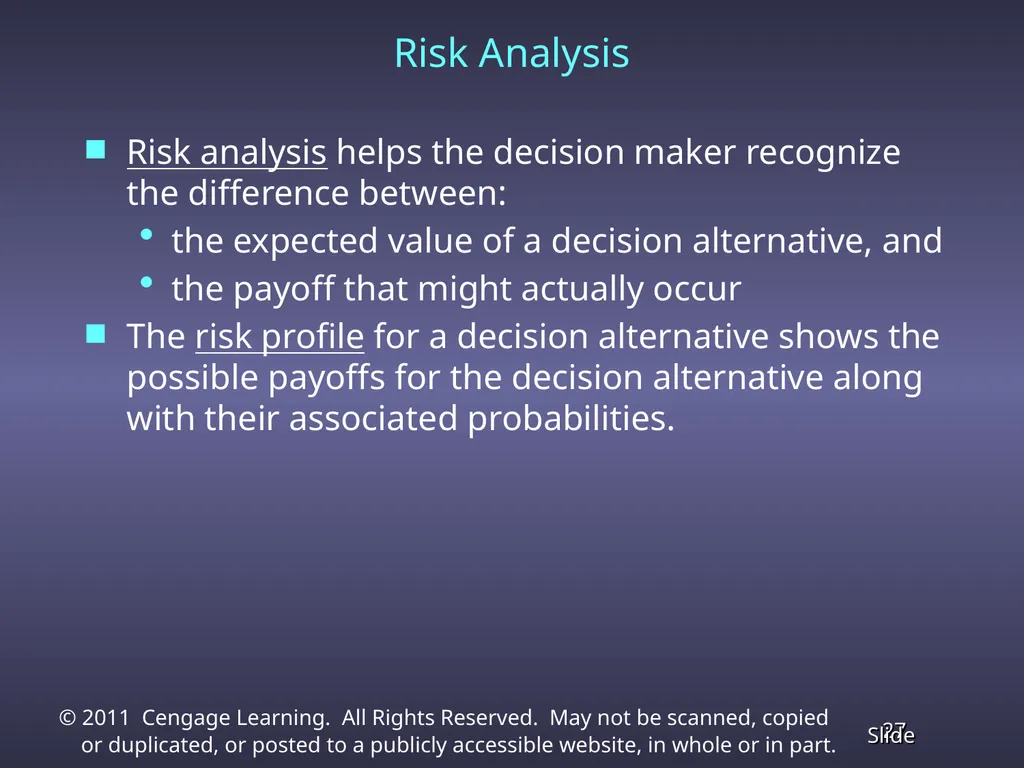
Risk Analysis Risk analysis helps the decision maker recognize the difference between:
the expected value of a decision alternative, and
the payoff that might actually occur
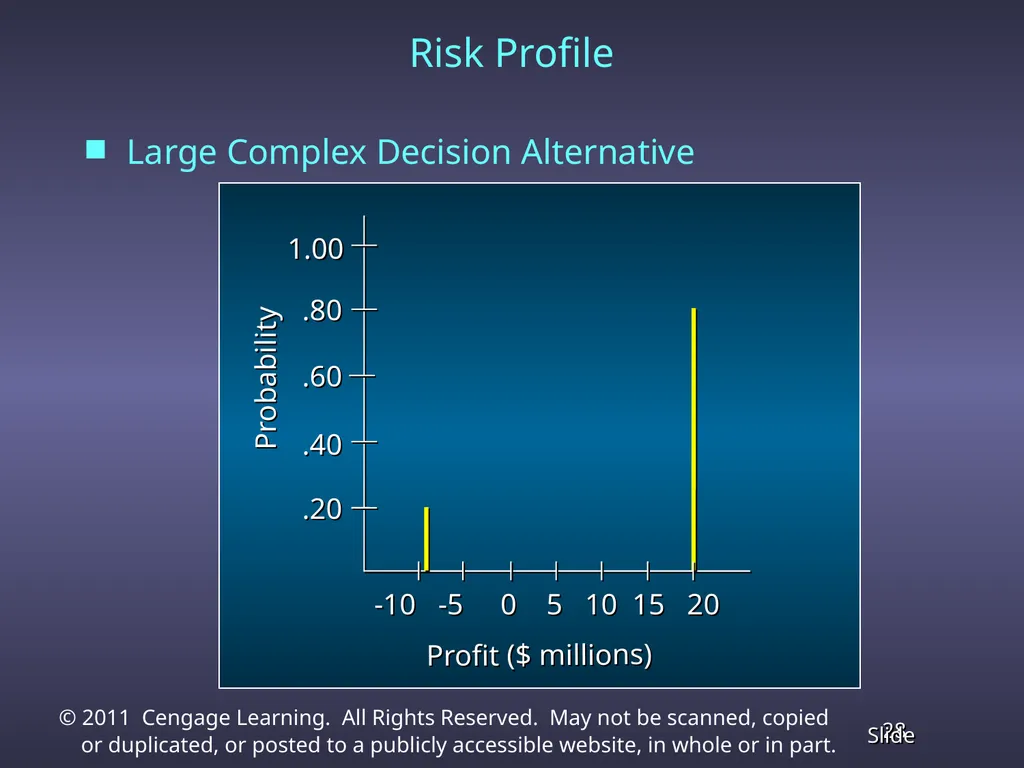
The risk profile for a decision alternative shows the possible payoffs for the decision alternative along with their associated probabilities.<br>
the expected value of a decision alternative, and
the payoff that might actually occur
The risk profile for a decision alternative shows the possible payoffs for the decision alternative along with their associated probabilities.<br>
27
Risk Profile Large Complex Decision Alternative .20 .40 .60 .80 1.00 -10 -5 0 5 10 15 20 Probability Profit ($ millions)<br>
28
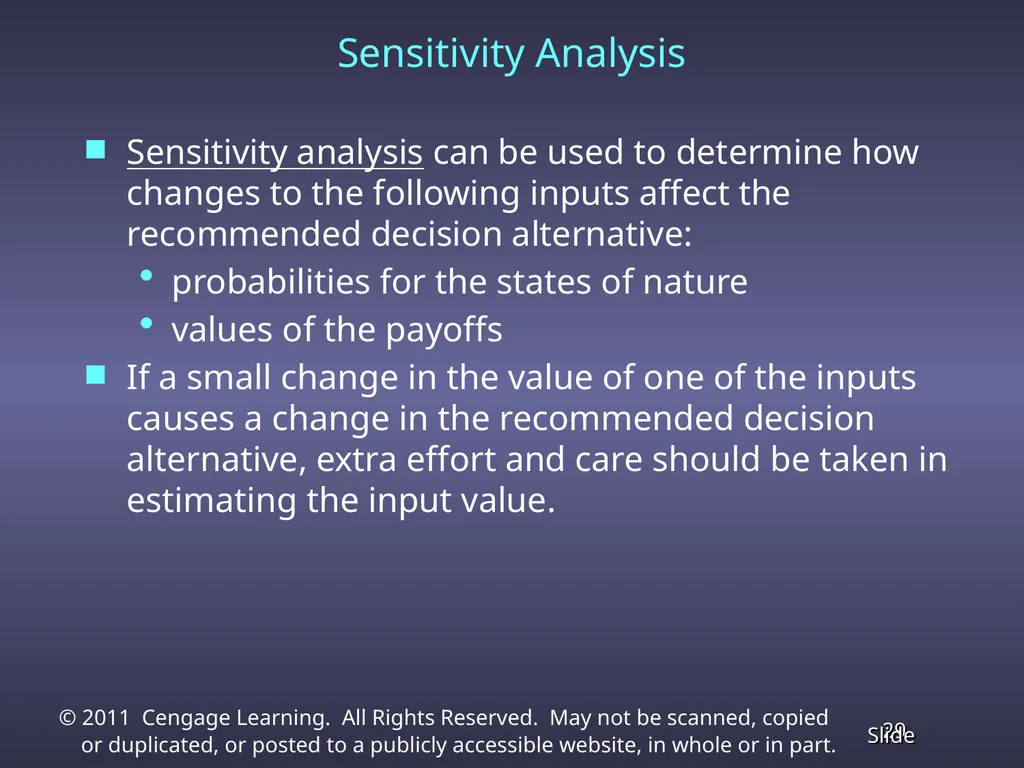
Sensitivity Analysis Sensitivity analysis can be used to determine how changes to the following inputs affect the recommended decision alternative:
probabilities for the states of nature
values of the payoffs
If a small change in the value of one of the inputs causes a change in the recommended decision alternative, extra effort and care should be taken in estimating the input value.<br>
probabilities for the states of nature
values of the payoffs
If a small change in the value of one of the inputs causes a change in the recommended decision alternative, extra effort and care should be taken in estimating the input value.<br>
29
Decision Analysis with Sample Information Frequently, decision makers have preliminary or prior probability assessments for the states of nature that are the best probability values available at that time.
To make the best possible decision, the decision maker may want to seek additional information about the states of nature.
This new information, often obtained through sampling, can be used to revise the prior probabilities so that the final decision is based on more accurate probabilities for the states of nature.
These revised probabilities are called posterior probabilities.<br>
To make the best possible decision, the decision maker may want to seek additional information about the states of nature.
This new information, often obtained through sampling, can be used to revise the prior probabilities so that the final decision is based on more accurate probabilities for the states of nature.
These revised probabilities are called posterior probabilities.<br>
30
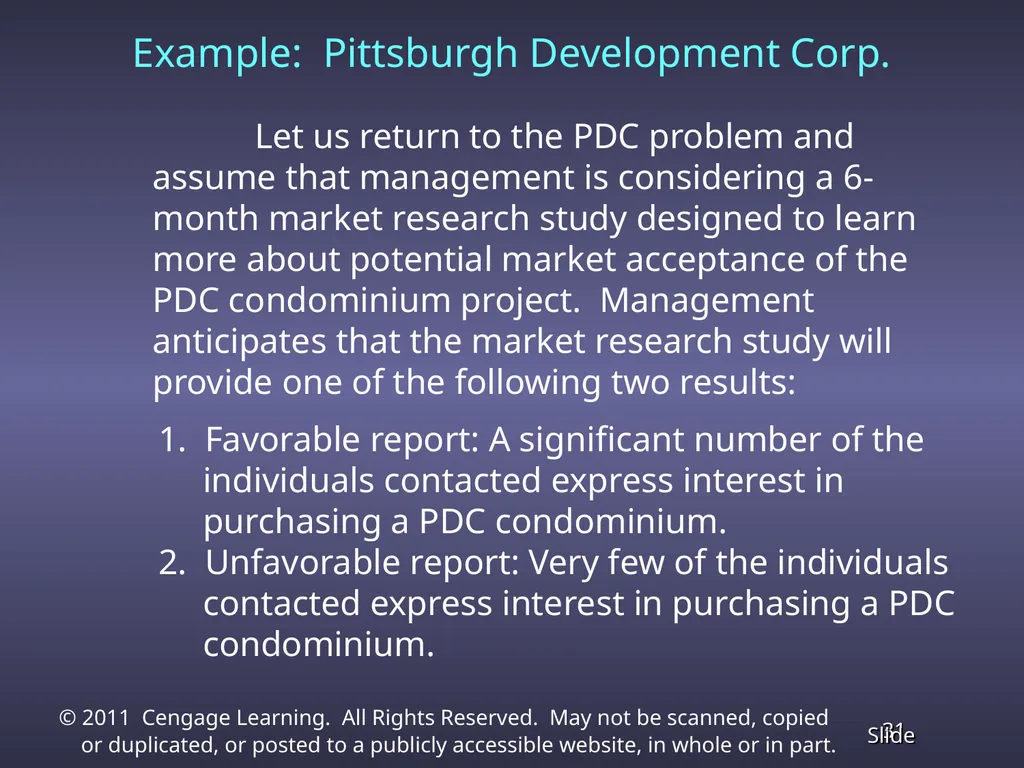
Let us return to the PDC problem and assume that management is considering a 6-month market research study designed to learn more about potential market acceptance of the PDC condominium project. Management anticipates that the market research study will provide one of the following two results: Example: Pittsburgh Development Corp. 1. Favorable report: A significant number of the
individuals contacted express interest in
purchasing a PDC condominium.
2. Unfavorable report: Very few of the individuals
contacted express interest in purchasing a PDC
condominium.<br>
individuals contacted express interest in
purchasing a PDC condominium.
2. Unfavorable report: Very few of the individuals
contacted express interest in purchasing a PDC
condominium.<br>
31
Influence Diagram Complex
Size Profit Demand
for the
Condominiums Market
Survey
Results Market
Survey Decision
Chance
Consequence<br>
Size Profit Demand
for the
Condominiums Market
Survey
Results Market
Survey Decision
Chance
Consequence<br>
32
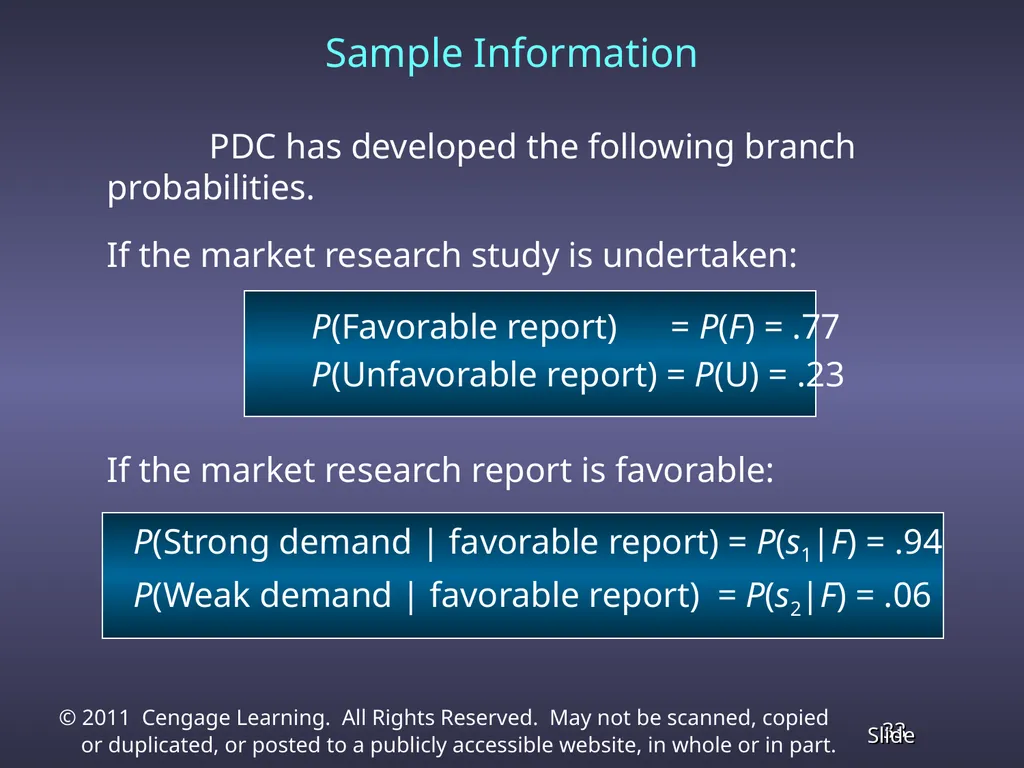
PDC has developed the following branch probabilities.
If the market research study is undertaken:
P(Favorable report) = P(F) = .77
P(Unfavorable report) = P(U) = .23
If the market research report is favorable:
P(Strong demand | favorable report) = P(s1|F) = .94
P(Weak demand | favorable report) = P(s2|F) = .06 Sample Information<br>
If the market research study is undertaken:
P(Favorable report) = P(F) = .77
P(Unfavorable report) = P(U) = .23
If the market research report is favorable:
P(Strong demand | favorable report) = P(s1|F) = .94
P(Weak demand | favorable report) = P(s2|F) = .06 Sample Information<br>
33
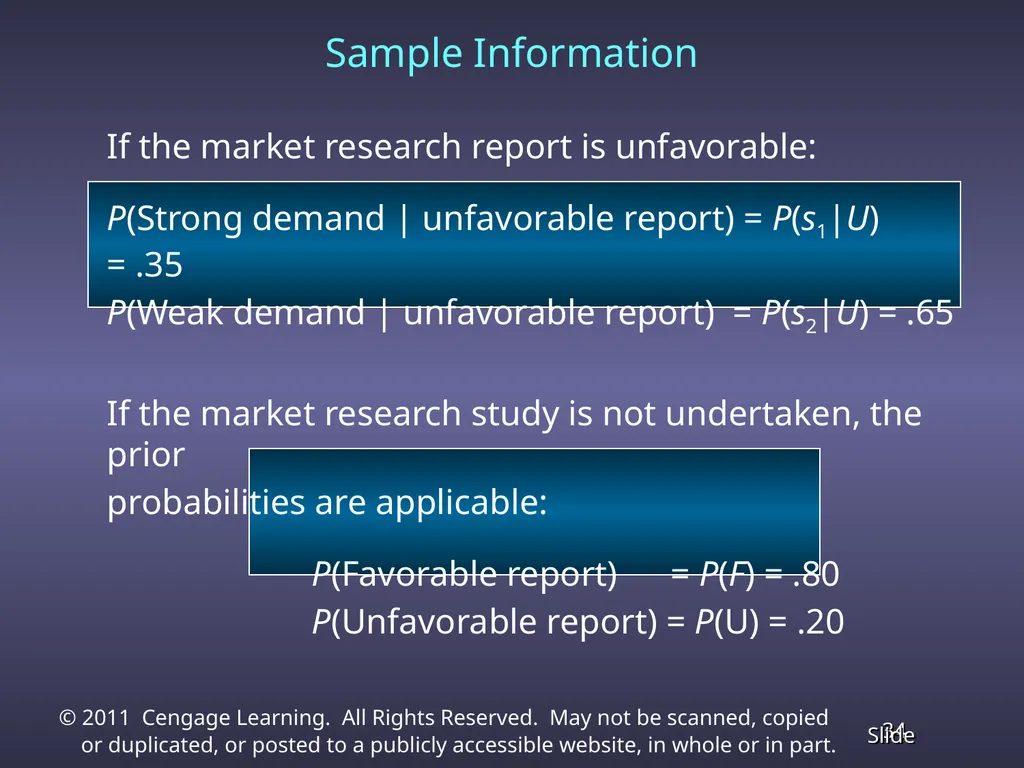
If the market research report is unfavorable:
P(Strong demand | unfavorable report) = P(s1|U) = .35
P(Weak demand | unfavorable report) = P(s2|U) = .65
If the market research study is not undertaken, the prior
probabilities are applicable:
P(Favorable report) = P(F) = .80
P(Unfavorable report) = P(U) = .20 Sample Information<br>
P(Strong demand | unfavorable report) = P(s1|U) = .35
P(Weak demand | unfavorable report) = P(s2|U) = .65
If the market research study is not undertaken, the prior
probabilities are applicable:
P(Favorable report) = P(F) = .80
P(Unfavorable report) = P(U) = .20 Sample Information<br>
34
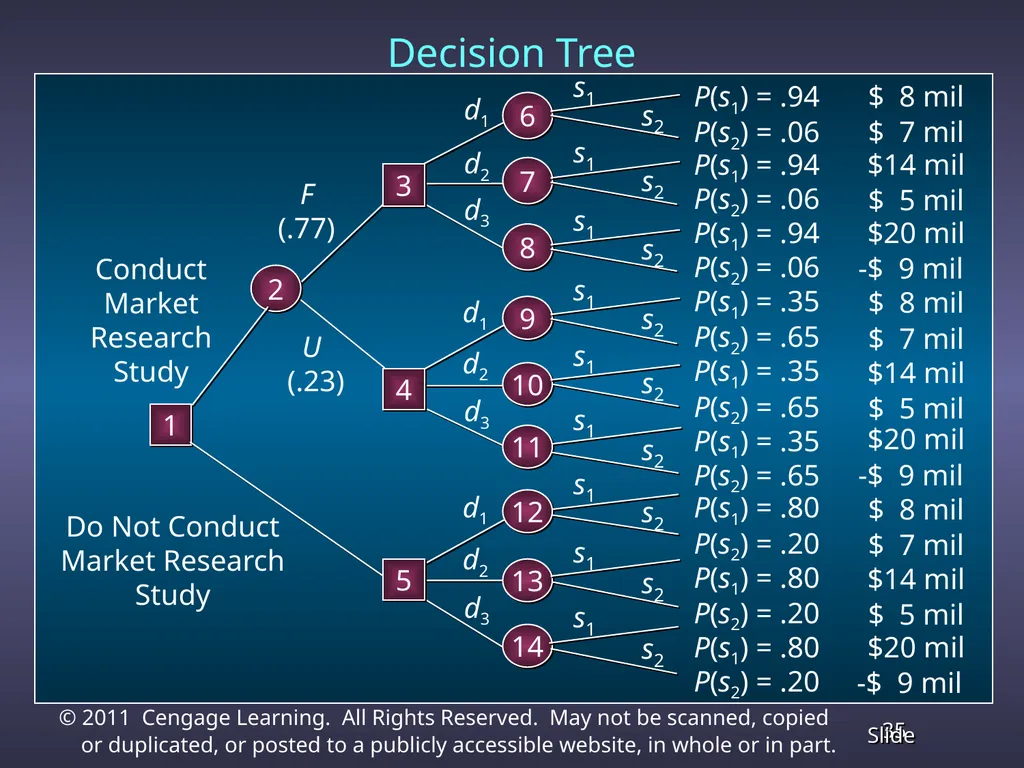
Decision Tree U
(.23) d1 d2 d3 F
(.77) d1 d2 d3 6 7 8 9 10 11 3 4 2 1 d1 d2 d3 12 13 14 5 $ 8 mil $ 7 mil s1 s2 P(s1) = .94 P(s2) = .06 P(s1) = .94 P(s2) = .06 P(s1) = .94 P(s2) = .06 P(s1) = .35 P(s2) = .65 P(s1) = .35 P(s2) = .65 P(s1) = .35 P(s2) = .65 P(s1) = .80 P(s2) = .20 P(s1) = .80 P(s2) = .20 P(s1) = .80 P(s2) = .20 $14 mil $ 5 mil $20 mil -$ 9 mil $ 8 mil $ 7 mil $14 mil $ 5 mil $20 mil -$ 9 mil $ 8 mil $ 7 mil $14 mil $ 5 mil $20 mil -$ 9 mil s1 s2 s1 s2 s1 s2 s1 s2 s1 s2 s1 s2 s1 s2 s1 s2 Conduct
Market
Research
Study Do Not Conduct
Market Research
Study<br>
(.23) d1 d2 d3 F
(.77) d1 d2 d3 6 7 8 9 10 11 3 4 2 1 d1 d2 d3 12 13 14 5 $ 8 mil $ 7 mil s1 s2 P(s1) = .94 P(s2) = .06 P(s1) = .94 P(s2) = .06 P(s1) = .94 P(s2) = .06 P(s1) = .35 P(s2) = .65 P(s1) = .35 P(s2) = .65 P(s1) = .35 P(s2) = .65 P(s1) = .80 P(s2) = .20 P(s1) = .80 P(s2) = .20 P(s1) = .80 P(s2) = .20 $14 mil $ 5 mil $20 mil -$ 9 mil $ 8 mil $ 7 mil $14 mil $ 5 mil $20 mil -$ 9 mil $ 8 mil $ 7 mil $14 mil $ 5 mil $20 mil -$ 9 mil s1 s2 s1 s2 s1 s2 s1 s2 s1 s2 s1 s2 s1 s2 s1 s2 Conduct
Market
Research
Study Do Not Conduct
Market Research
Study<br>
35
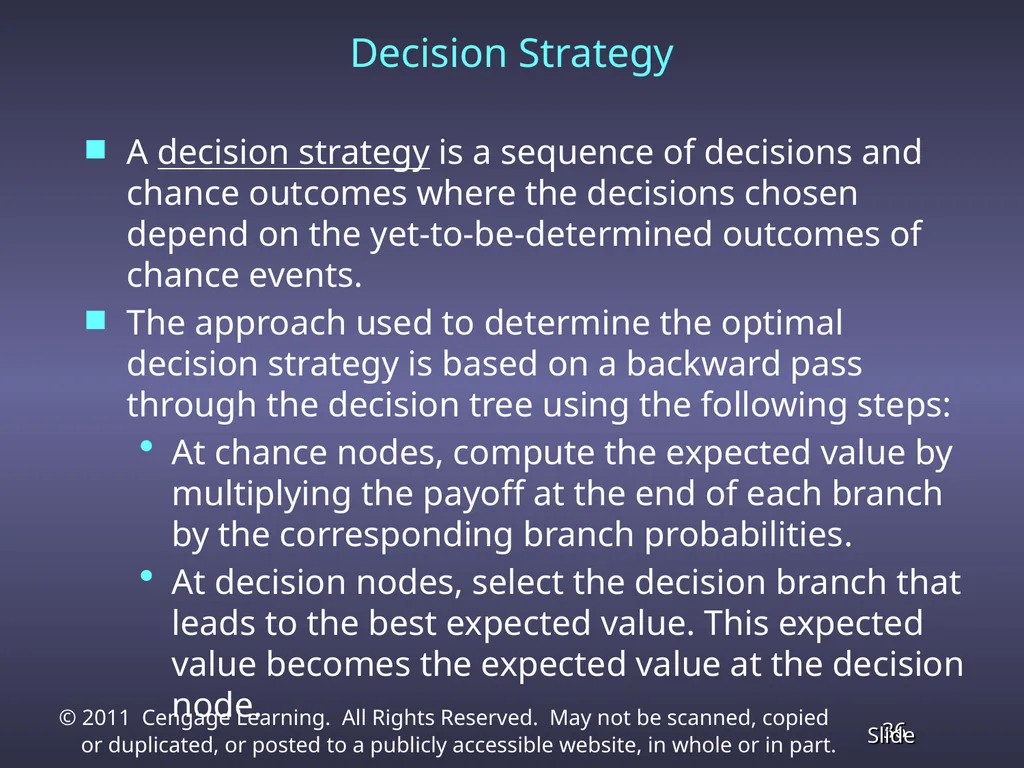
Decision Strategy A decision strategy is a sequence of decisions and chance outcomes where the decisions chosen depend on the yet-to-be-determined outcomes of chance events.
The approach used to determine the optimal decision strategy is based on a backward pass through the decision tree using the following steps:
At chance nodes, compute the expected value by multiplying the payoff at the end of each branch by the corresponding branch probabilities.
At decision nodes, select the decision branch that leads to the best expected value. This expected value becomes the expected value at the decision node.<br>
The approach used to determine the optimal decision strategy is based on a backward pass through the decision tree using the following steps:
At chance nodes, compute the expected value by multiplying the payoff at the end of each branch by the corresponding branch probabilities.
At decision nodes, select the decision branch that leads to the best expected value. This expected value becomes the expected value at the decision node.<br>
36
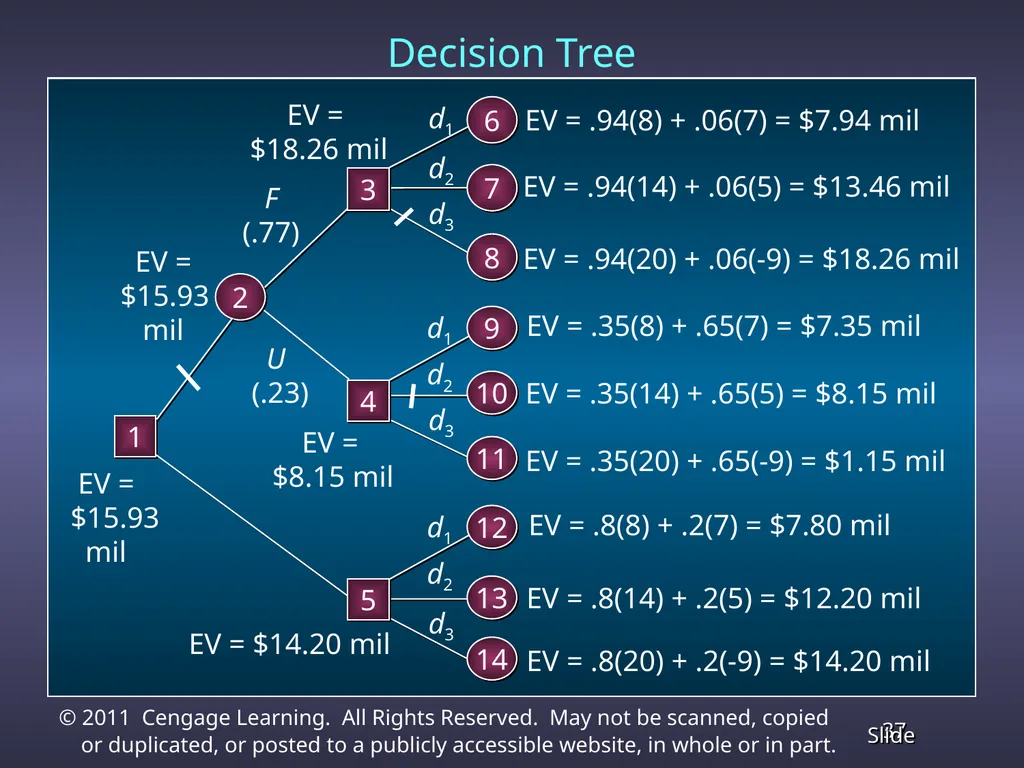
Decision Tree U
(.23) d1 d2 d3 EV = .35(8) + .65(7) = $7.35 mil EV = .35(14) + .65(5) = $8.15 mil EV = .35(20) + .65(-9) = $1.15 mil F
(.77) d1 d2 d3 EV = .94(8) + .06(7) = $7.94 mil EV = .94(14) + .06(5) = $13.46 mil EV = .94(20) + .06(-9) = $18.26 mil 6 7 8 9 10 11 3 4 2 EV =
$18.26 mil EV =
$8.15 mil EV =
$15.93
mil 1 d1 d2 d3 EV = .8(8) + .2(7) = $7.80 mil EV = .8(14) + .2(5) = $12.20 mil EV = .8(20) + .2(-9) = $14.20 mil 12 13 14 5 EV = $14.20 mil EV =
$15.93
mil<br>
(.23) d1 d2 d3 EV = .35(8) + .65(7) = $7.35 mil EV = .35(14) + .65(5) = $8.15 mil EV = .35(20) + .65(-9) = $1.15 mil F
(.77) d1 d2 d3 EV = .94(8) + .06(7) = $7.94 mil EV = .94(14) + .06(5) = $13.46 mil EV = .94(20) + .06(-9) = $18.26 mil 6 7 8 9 10 11 3 4 2 EV =
$18.26 mil EV =
$8.15 mil EV =
$15.93
mil 1 d1 d2 d3 EV = .8(8) + .2(7) = $7.80 mil EV = .8(14) + .2(5) = $12.20 mil EV = .8(20) + .2(-9) = $14.20 mil 12 13 14 5 EV = $14.20 mil EV =
$15.93
mil<br>
37
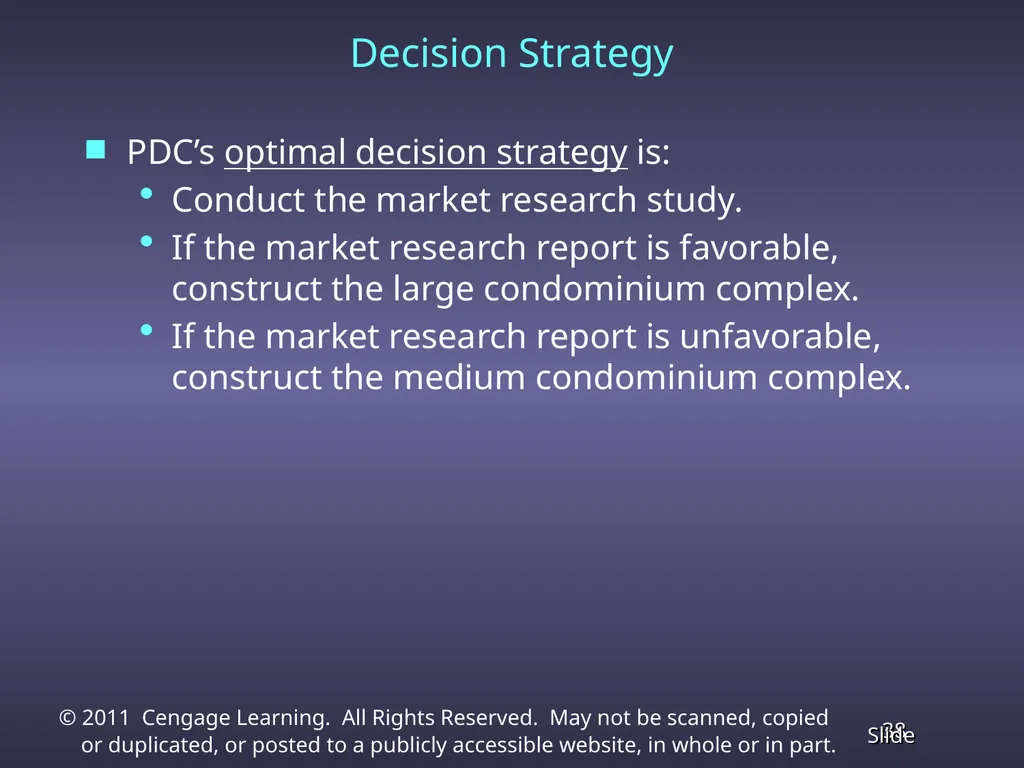
Decision Strategy PDC’s optimal decision strategy is:
Conduct the market research study.
If the market research report is favorable, construct the large condominium complex.
If the market research report is unfavorable, construct the medium condominium complex.<br>
Conduct the market research study.
If the market research report is favorable, construct the large condominium complex.
If the market research report is unfavorable, construct the medium condominium complex.<br>
38
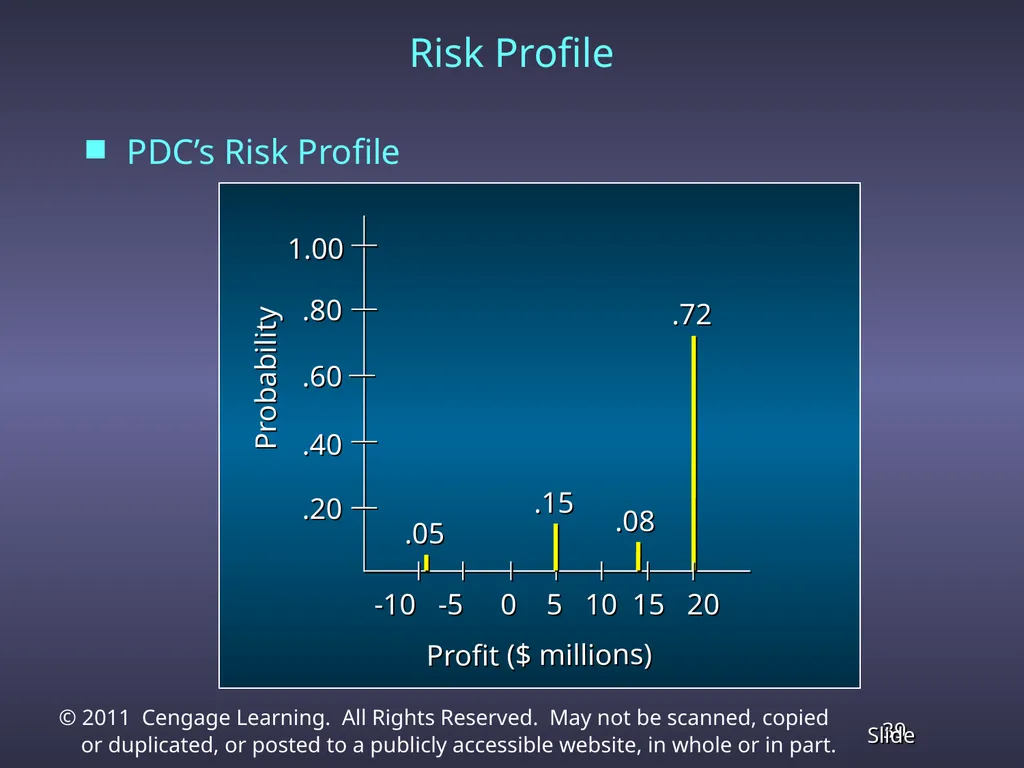
Risk Profile PDC’s Risk Profile .20 .40 .60 .80 1.00 -10 -5 0 5 10 15 20 Probability Profit ($ millions) .72 .08 .15 .05<br>
39
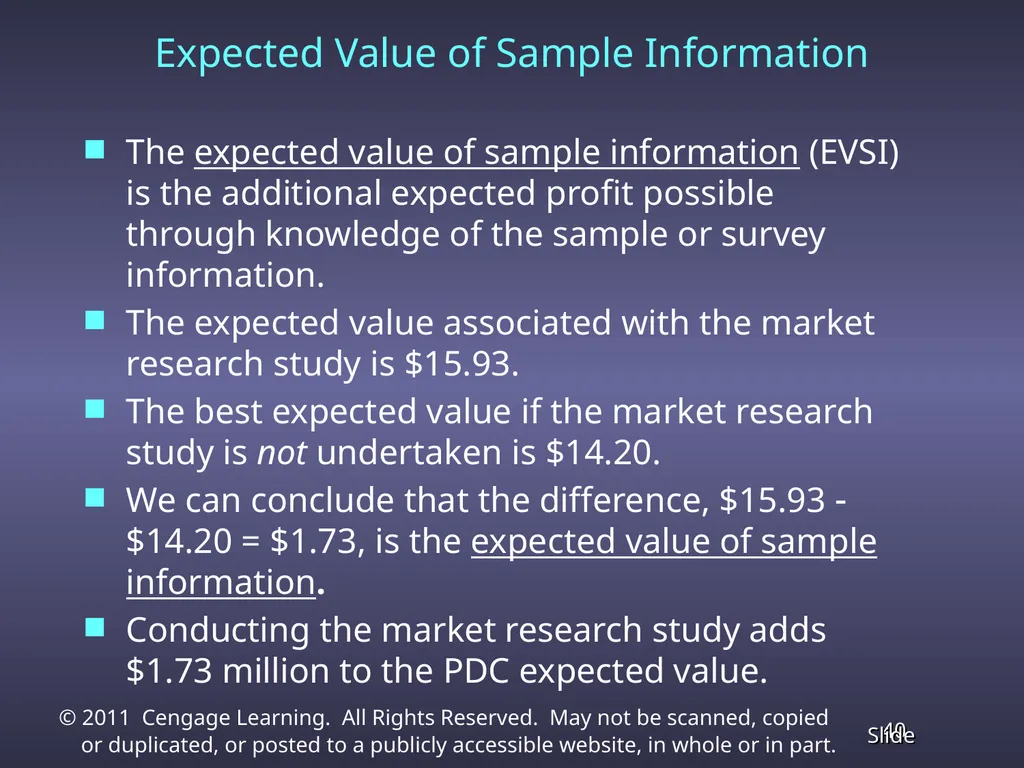
Expected Value of Sample Information The expected value of sample information (EVSI) is the additional expected profit possible through knowledge of the sample or survey information.
The expected value associated with the market research study is $15.93.
The best expected value if the market research study is not undertaken is $14.20.
We can conclude that the difference, $15.93 $14.20 = $1.73, is the expected value of sample information.
Conducting the market research study adds $1.73 million to the PDC expected value.<br>
The expected value associated with the market research study is $15.93.
The best expected value if the market research study is not undertaken is $14.20.
We can conclude that the difference, $15.93 $14.20 = $1.73, is the expected value of sample information.
Conducting the market research study adds $1.73 million to the PDC expected value.<br>
40
Efficiency of Sample Information Efficiency of sample information is the ratio of EVSI to EVPI.
As the EVPI provides an upper bound for the EVSI, efficiency is always a number between 0 and 1.<br>
As the EVPI provides an upper bound for the EVSI, efficiency is always a number between 0 and 1.<br>
41
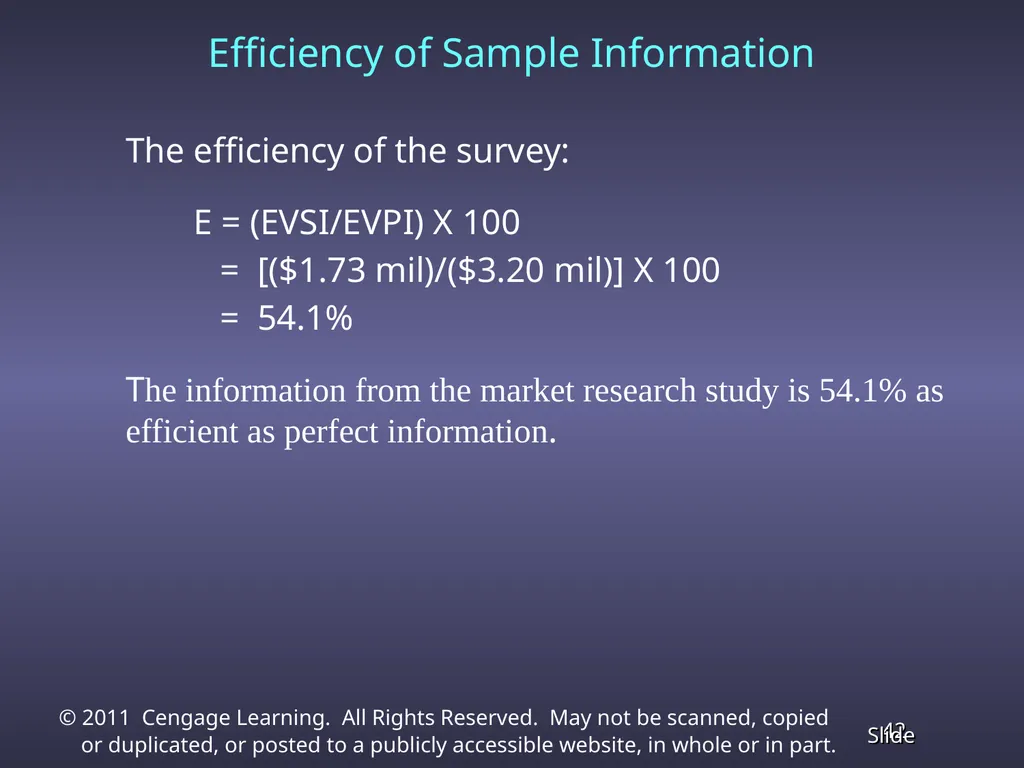
Efficiency of Sample Information The efficiency of the survey:
E = (EVSI/EVPI) X 100
= [($1.73 mil)/($3.20 mil)] X 100
= 54.1%
The information from the market research study is 54.1% as efficient as perfect information.<br>
E = (EVSI/EVPI) X 100
= [($1.73 mil)/($3.20 mil)] X 100
= 54.1%
The information from the market research study is 54.1% as efficient as perfect information.<br>
42
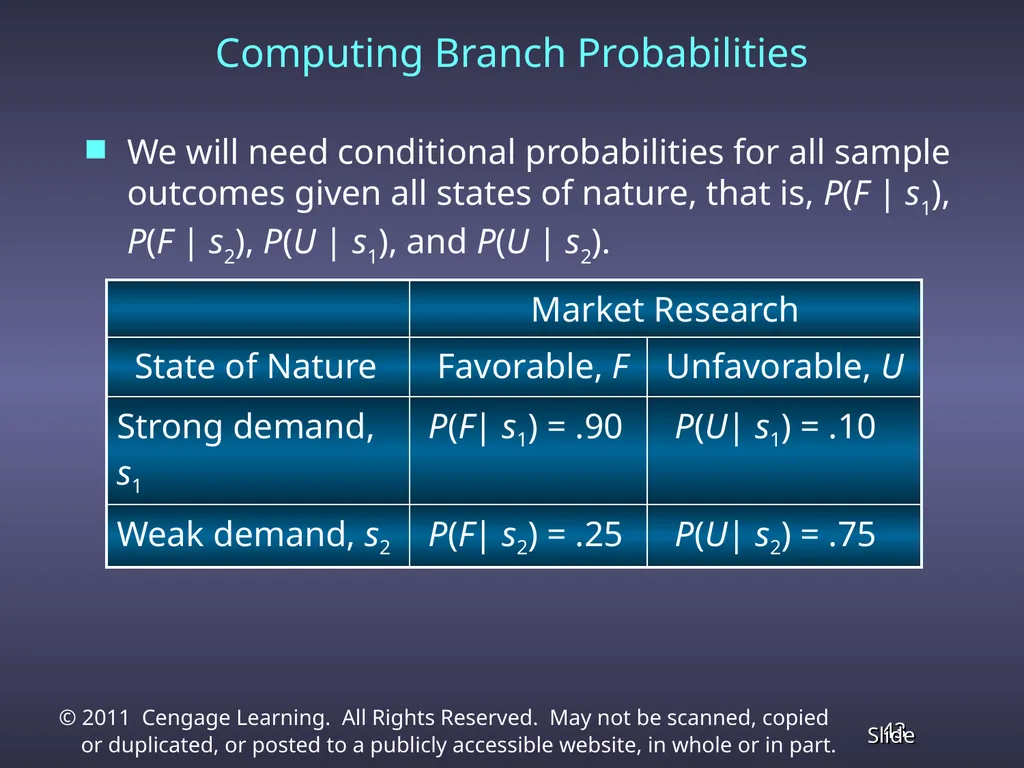
Computing Branch Probabilities We will need conditional probabilities for all sample outcomes given all states of nature, that is, P(F | s1), P(F | s2), P(U | s1), and P(U | s2).<br>
43
Computing Branch Probabilities Branch (Posterior) Probabilities Calculation
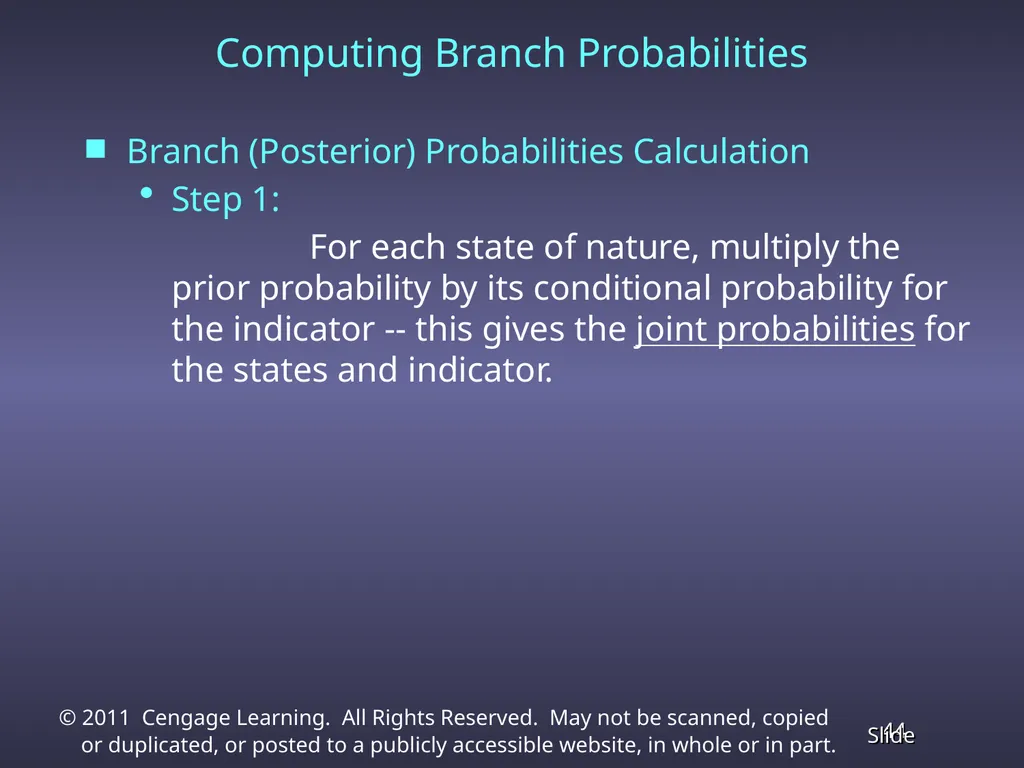
Step 1:
For each state of nature, multiply the prior probability by its conditional probability for the indicator -- this gives the joint probabilities for the states and indicator.<br>
Step 1:
For each state of nature, multiply the prior probability by its conditional probability for the indicator -- this gives the joint probabilities for the states and indicator.<br>
44
Computing Branch Probabilities Branch (Posterior) Probabilities Calculation
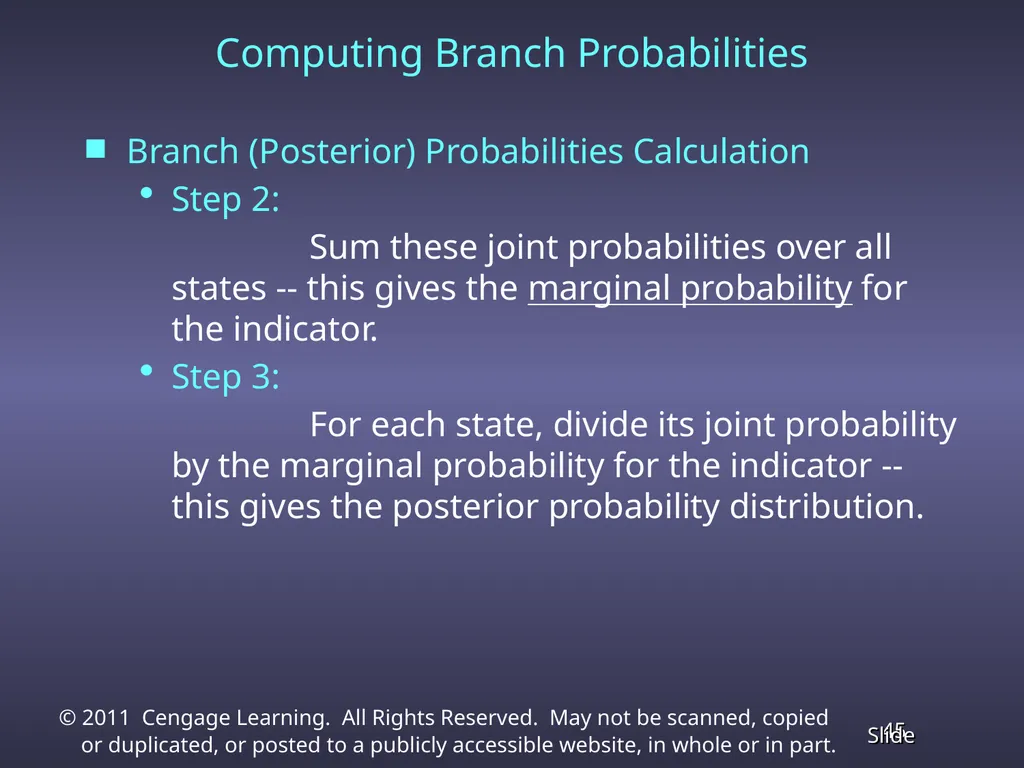
Step 2:
Sum these joint probabilities over all states -- this gives the marginal probability for the indicator.
Step 3:
For each state, divide its joint probability by the marginal probability for the indicator -- this gives the posterior probability distribution.<br>
Step 2:
Sum these joint probabilities over all states -- this gives the marginal probability for the indicator.
Step 3:
For each state, divide its joint probability by the marginal probability for the indicator -- this gives the posterior probability distribution.<br>
45
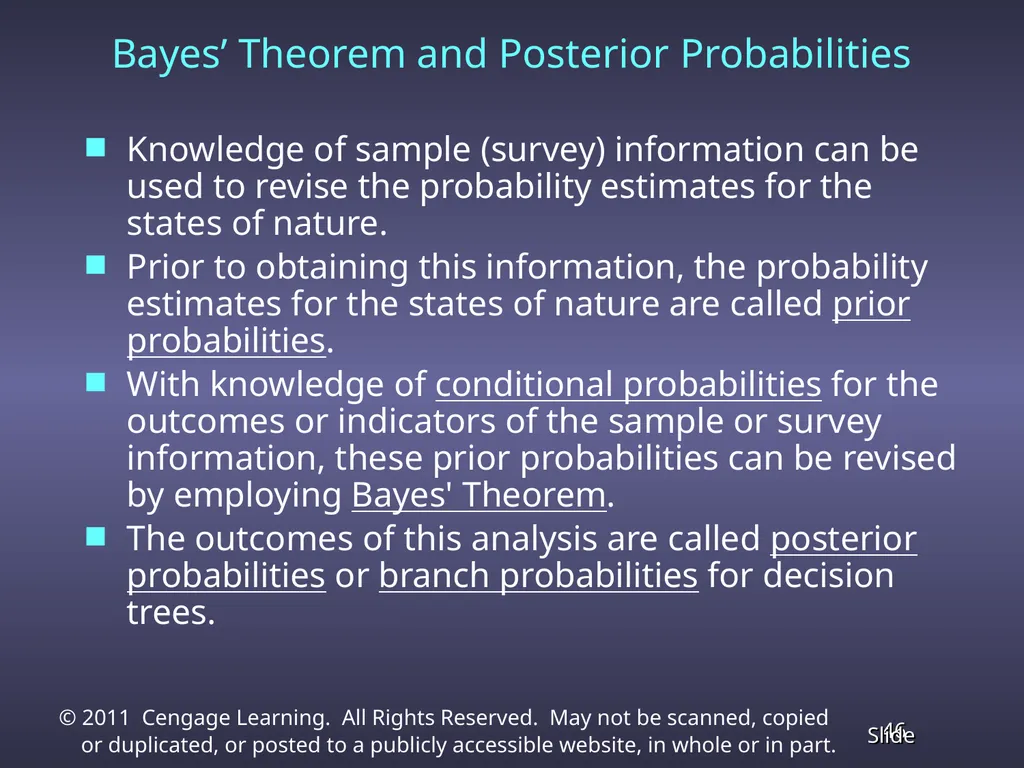
Bayes’ Theorem and Posterior Probabilities Knowledge of sample (survey) information can be used to revise the probability estimates for the states of nature.
Prior to obtaining this information, the probability estimates for the states of nature are called prior probabilities.
With knowledge of conditional probabilities for the outcomes or indicators of the sample or survey information, these prior probabilities can be revised by employing Bayes' Theorem.
The outcomes of this analysis are called posterior probabilities or branch probabilities for decision trees.<br>
Prior to obtaining this information, the probability estimates for the states of nature are called prior probabilities.
With knowledge of conditional probabilities for the outcomes or indicators of the sample or survey information, these prior probabilities can be revised by employing Bayes' Theorem.
The outcomes of this analysis are called posterior probabilities or branch probabilities for decision trees.<br>
46
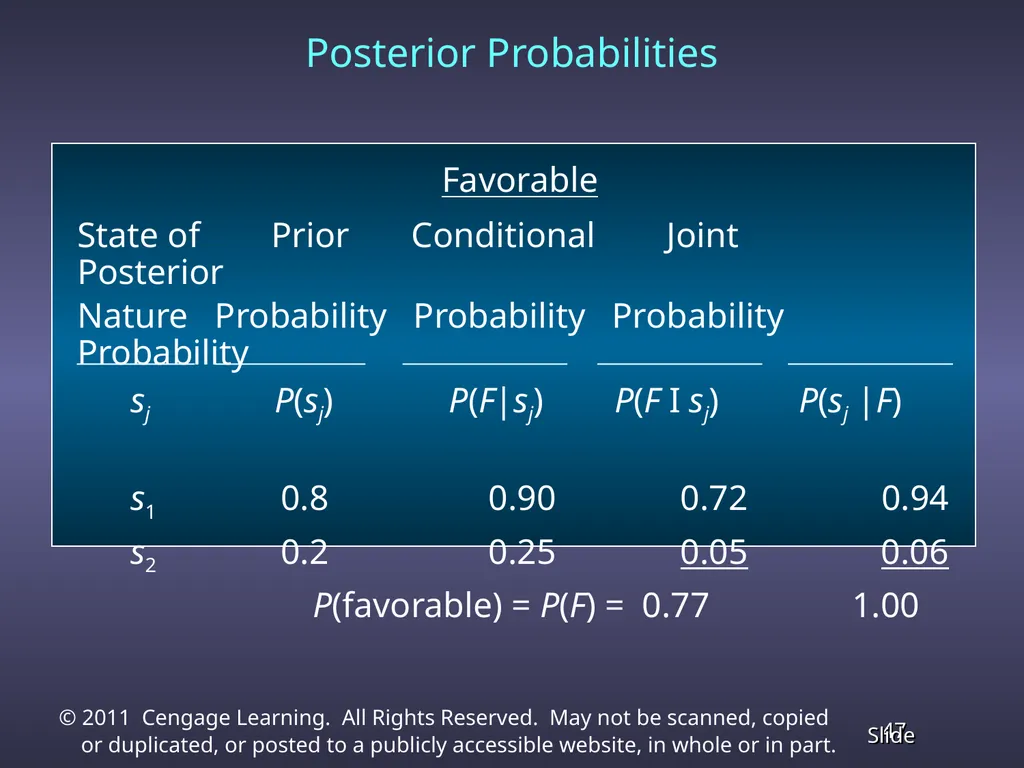
Posterior Probabilities Favorable
State of Prior Conditional Joint Posterior
Nature Probability Probability Probability Probability
sj P(sj) P(F|sj) P(F I sj) P(sj |F)
s1 0.8 0.90 0.72 0.94
s2 0.2 0.25 0.05 0.06
P(favorable) = P(F) = 0.77 1.00<br>
State of Prior Conditional Joint Posterior
Nature Probability Probability Probability Probability
sj P(sj) P(F|sj) P(F I sj) P(sj |F)
s1 0.8 0.90 0.72 0.94
s2 0.2 0.25 0.05 0.06
P(favorable) = P(F) = 0.77 1.00<br>
47
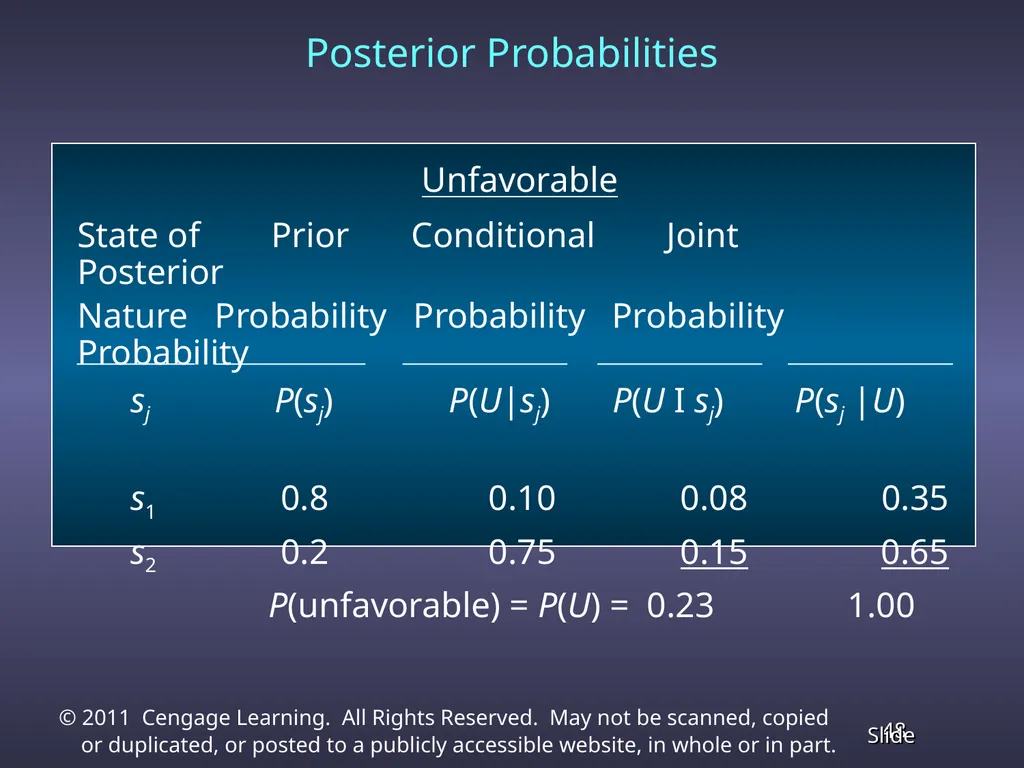
Unfavorable
State of Prior Conditional Joint Posterior
Nature Probability Probability Probability Probability
sj P(sj) P(U|sj) P(U I sj) P(sj |U)
s1 0.8 0.10 0.08 0.35
s2 0.2 0.75 0.15 0.65
P(unfavorable) = P(U) = 0.23 1.00 Posterior Probabilities<br>
State of Prior Conditional Joint Posterior
Nature Probability Probability Probability Probability
sj P(sj) P(U|sj) P(U I sj) P(sj |U)
s1 0.8 0.10 0.08 0.35
s2 0.2 0.75 0.15 0.65
P(unfavorable) = P(U) = 0.23 1.00 Posterior Probabilities<br>
48
End of Chapter 13<br>