
chapter 3 Evaluating a Company’s External
OM
Published · 45 slides · 0 views

1 / 1



Description
chapter 3 Evaluating a Companys External Environment 2022 McGraw Hill. All rights reserved. Authorized only for instructor use in the classroom. No reproduction or further distribution permitted without the prior written consent of
Related Topics
Share
Embed code
Download this presentation From Below
"chapter 3 Evaluating a Company’s External" is the property of its rightful owner. Permission is granted to download and print the materials on this website for personal, non-commercial use only, and to display it on your personal computer provided you do not modify the materials and that you retain all copyright notices contained in the materials. By downloading content from our website, you accept the terms of this agreement.
Presentation Transcript
01
chapter 3 Evaluating a Company’s External Environment © 2022 McGraw Hill. All rights reserved. Authorized only for instructor use in the classroom.
No reproduction or further distribution permitted without the prior written consent of McGraw Hill. Copyright Image Source/Getty Images<br>
No reproduction or further distribution permitted without the prior written consent of McGraw Hill. Copyright Image Source/Getty Images<br>
02
Learning Objectives After reading this chapter, you should be able to:
Recognize the factors in a company’s broad macro-environment that may have strategic significance.
Use analytic tools to diagnose the competitive conditions in a company’s industry.
Map the market positions of key groups of industry rivals.
Determine whether an industry’s outlook presents a company with sufficiently attractive opportunities for growth and profitability.<br>
Recognize the factors in a company’s broad macro-environment that may have strategic significance.
Use analytic tools to diagnose the competitive conditions in a company’s industry.
Map the market positions of key groups of industry rivals.
Determine whether an industry’s outlook presents a company with sufficiently attractive opportunities for growth and profitability.<br>
03
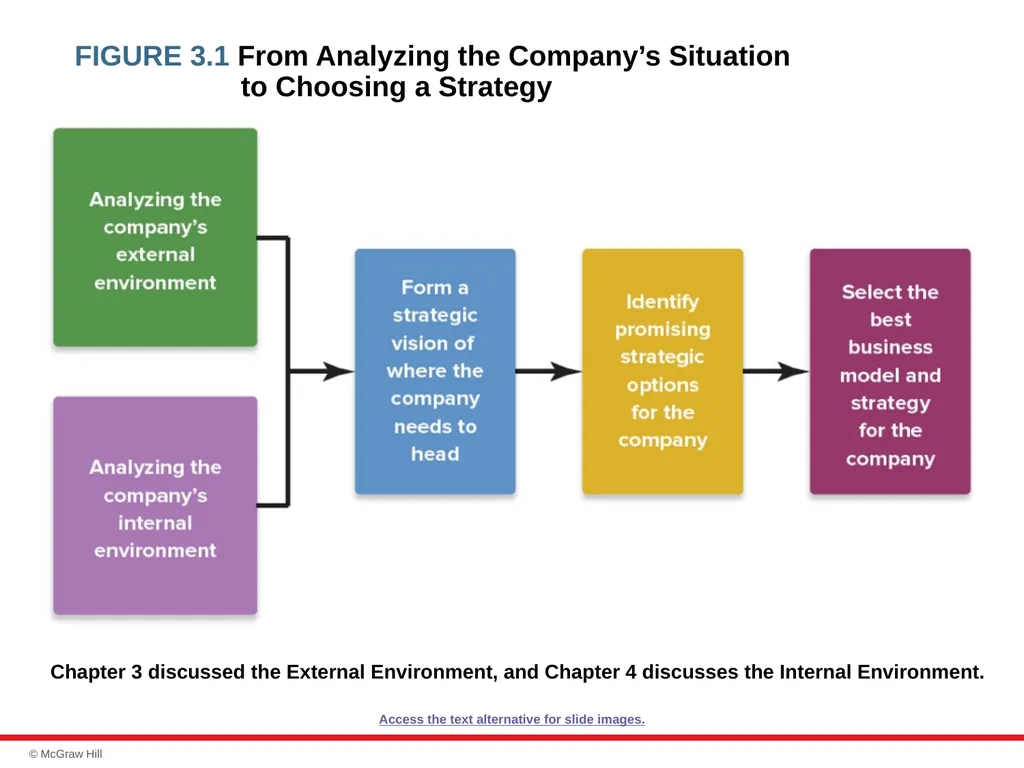
FIGURE 3.1 From Analyzing the Company’s Situation to Choosing a Strategy Chapter 3 discussed the External Environment, and Chapter 4 discusses the Internal Environment. Access the text alternative for slide images.<br>
04
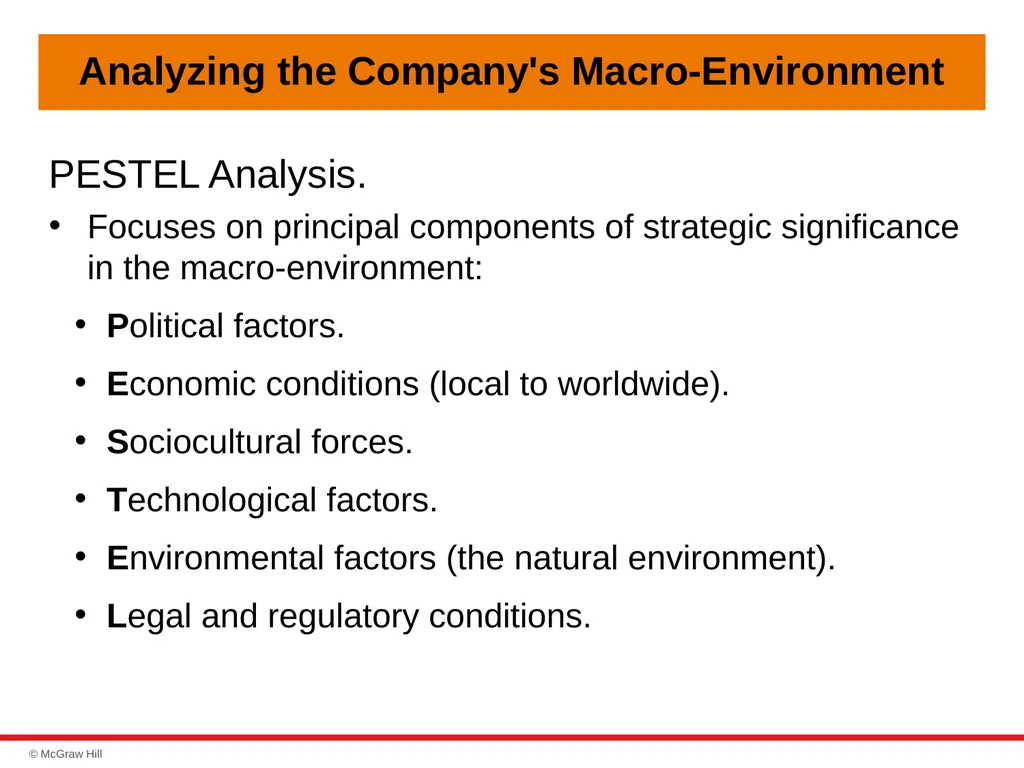
Analyzing the Company's Macro-Environment PESTEL Analysis.
Focuses on principal components of strategic significance in the macro-environment:
Political factors.
Economic conditions (local to worldwide).
Sociocultural forces.
Technological factors.
Environmental factors (the natural environment).
Legal and regulatory conditions.<br>
Focuses on principal components of strategic significance in the macro-environment:
Political factors.
Economic conditions (local to worldwide).
Sociocultural forces.
Technological factors.
Environmental factors (the natural environment).
Legal and regulatory conditions.<br>
05
Assessing the Company’s Industry and
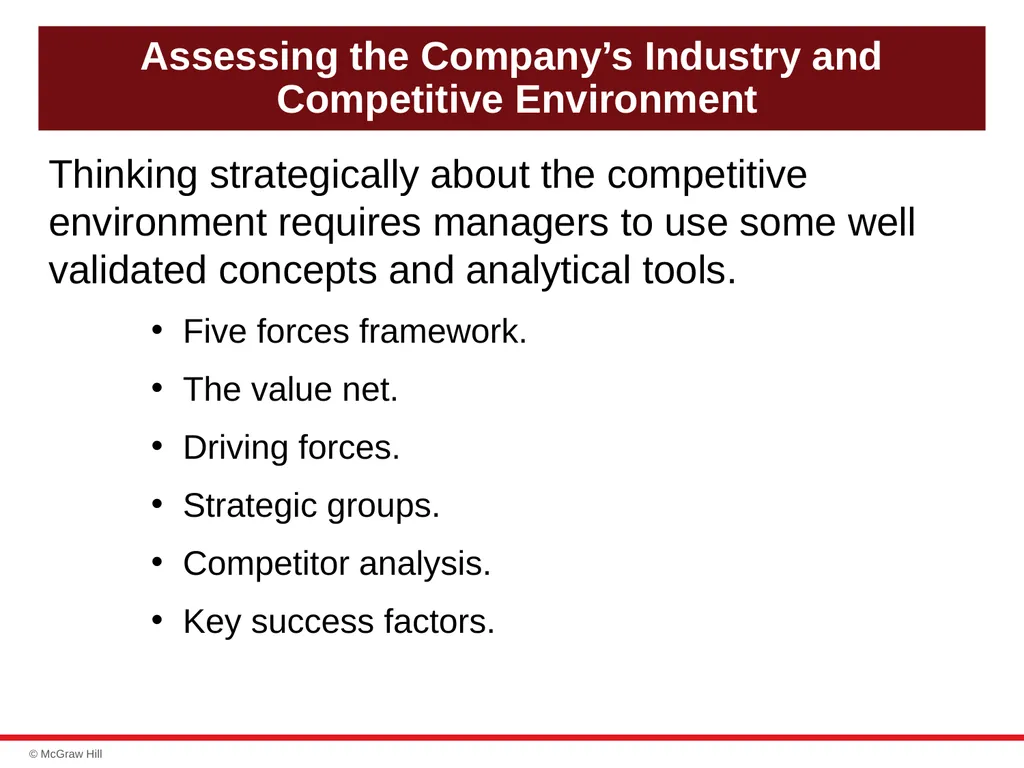
Competitive Environment Thinking strategically about the competitive environment requires managers to use some well validated concepts and analytical tools.
Five forces framework.
The value net.
Driving forces.
Strategic groups.
Competitor analysis.
Key success factors.<br>
Five forces framework.
The value net.
Driving forces.
Strategic groups.
Competitor analysis.
Key success factors.<br>
06
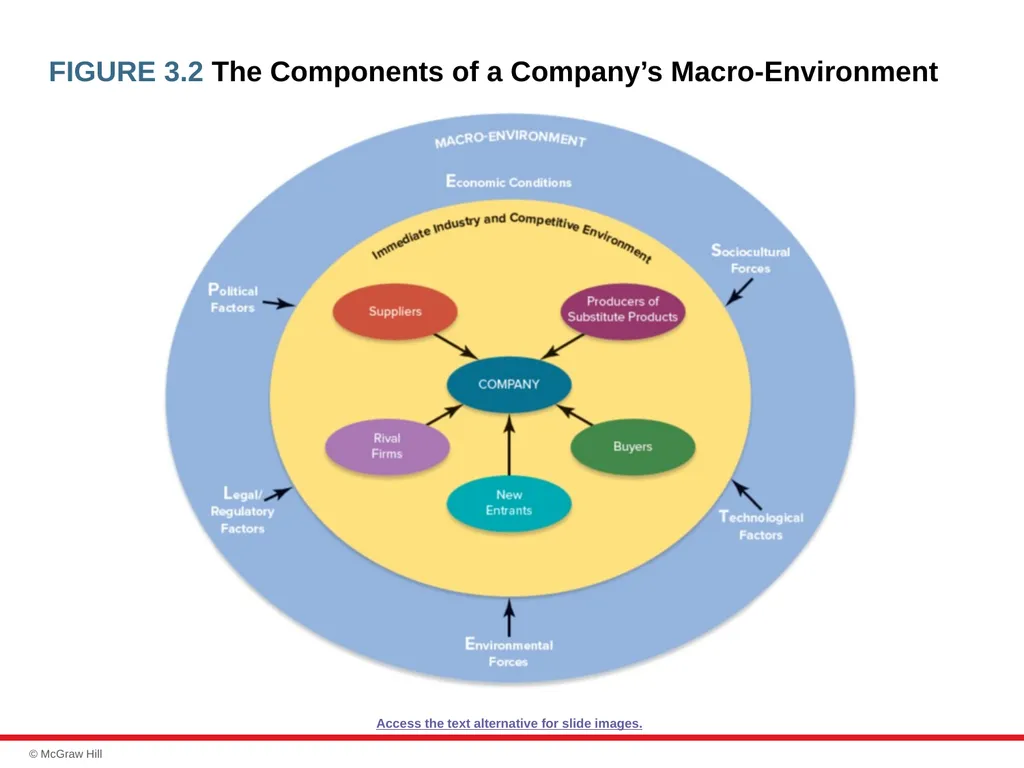
FIGURE 3.2 The Components of a Company’s Macro-Environment Access the text alternative for slide images.<br>
07
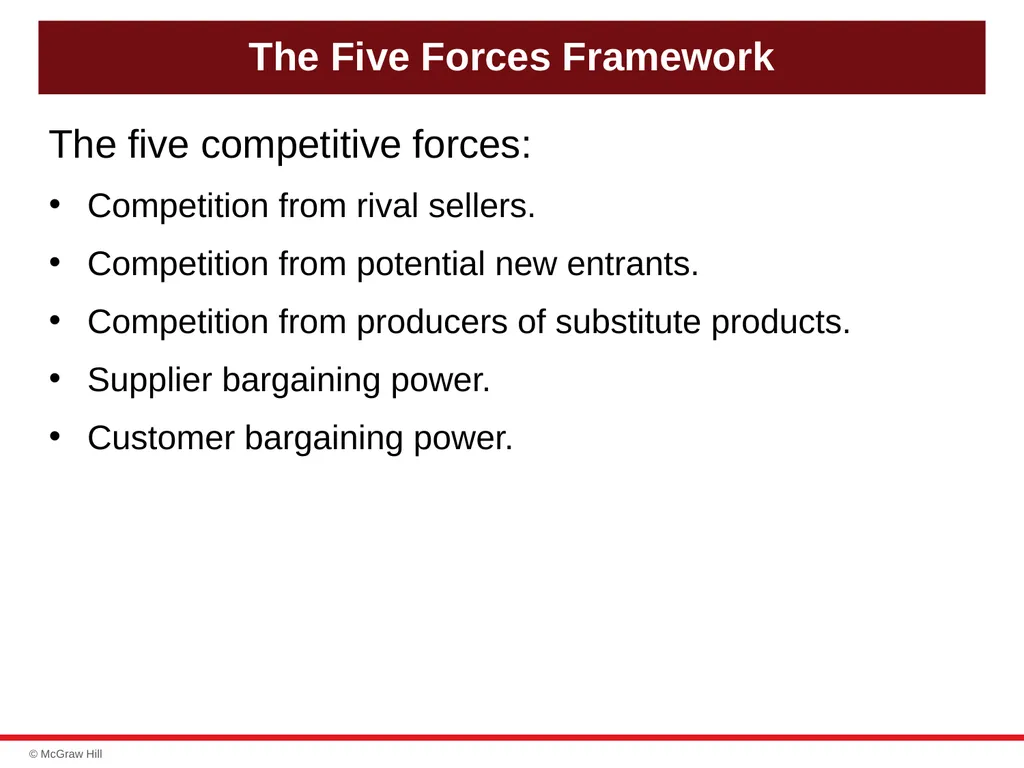
The Five Forces Framework The five competitive forces:
Competition from rival sellers.
Competition from potential new entrants.
Competition from producers of substitute products.
Supplier bargaining power.
Customer bargaining power.<br>
Competition from rival sellers.
Competition from potential new entrants.
Competition from producers of substitute products.
Supplier bargaining power.
Customer bargaining power.<br>
08
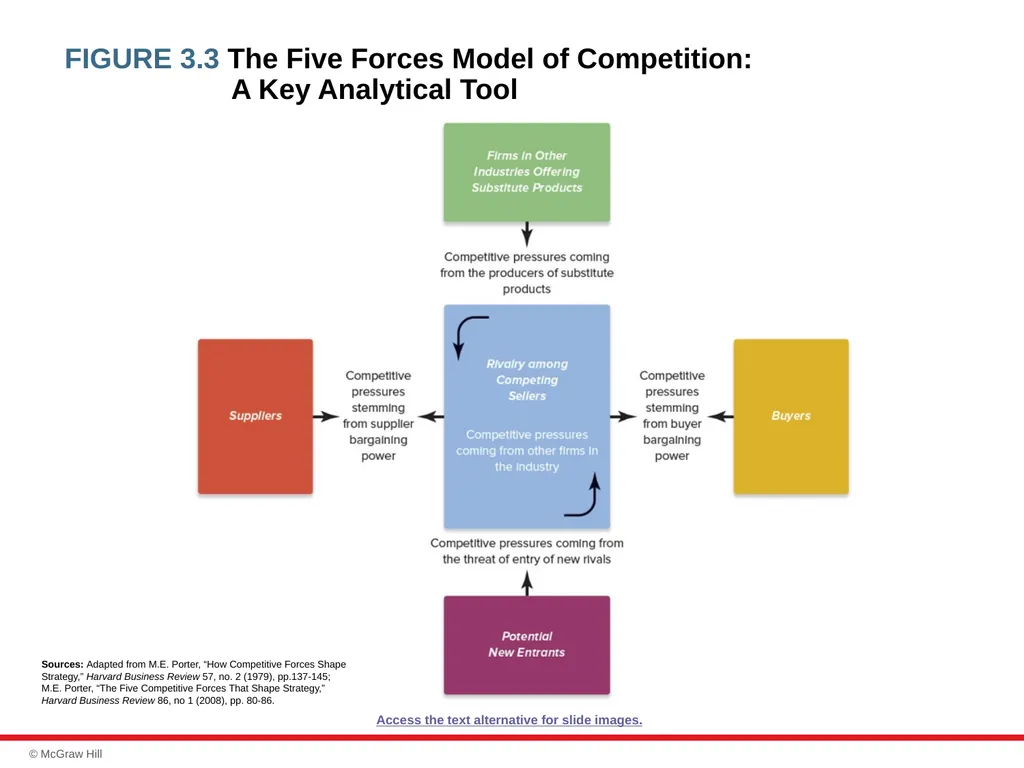
FIGURE 3.3 The Five Forces Model of Competition:
A Key Analytical Tool Sources: Adapted from M.E. Porter, “How Competitive Forces Shape Strategy,” Harvard Business Review 57, no. 2 (1979), pp.137-145; M.E. Porter, “The Five Competitive Forces That Shape Strategy,” Harvard Business Review 86, no 1 (2008), pp. 80-86. Access the text alternative for slide images.<br>
09
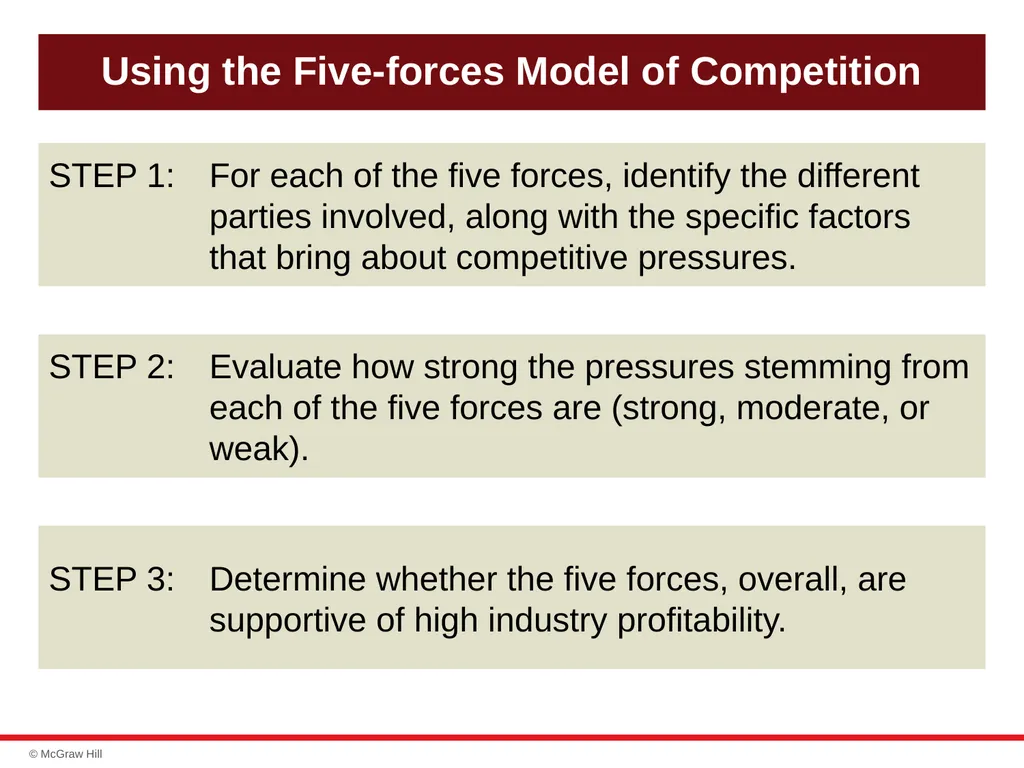
Using the Five-forces Model of Competition STEP 1: For each of the five forces, identify the different parties involved, along with the specific factors that bring about competitive pressures. STEP 2: Evaluate how strong the pressures stemming from each of the five forces are (strong, moderate, or weak). STEP 3: Determine whether the five forces, overall, are supportive of high industry profitability.<br>
10
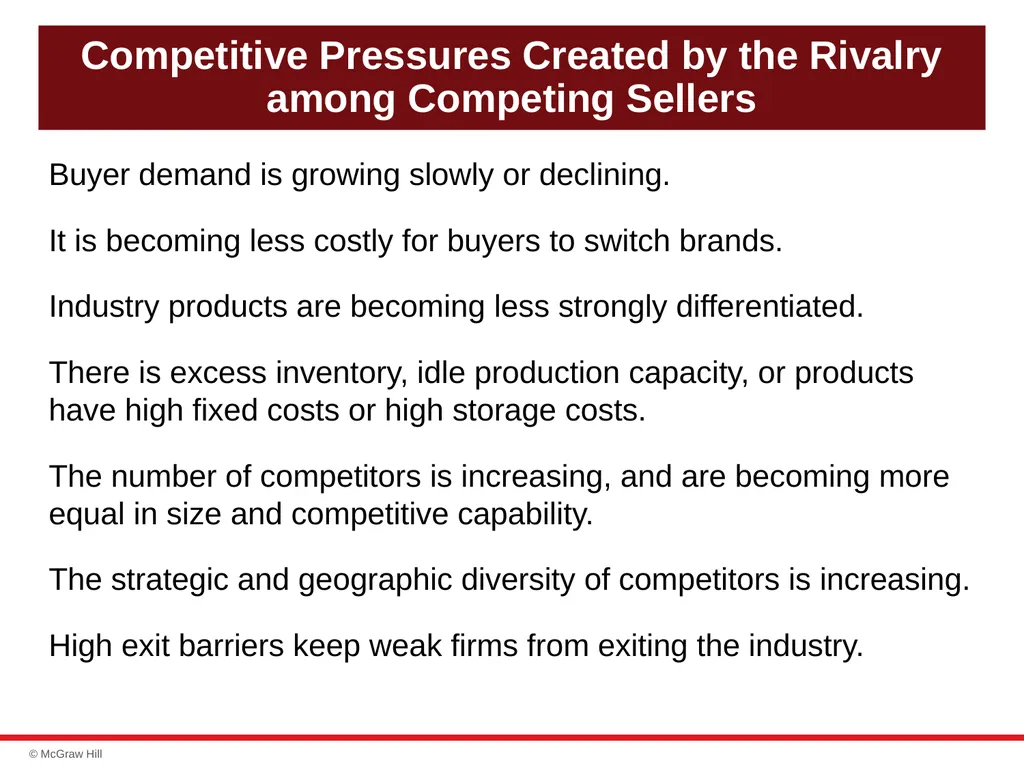
Competitive Pressures Created by the Rivalry among Competing Sellers Buyer demand is growing slowly or declining.
It is becoming less costly for buyers to switch brands.
Industry products are becoming less strongly differentiated.
There is excess inventory, idle production capacity, or products have high fixed costs or high storage costs.
The number of competitors is increasing, and are becoming more equal in size and competitive capability.
The strategic and geographic diversity of competitors is increasing.
High exit barriers keep weak firms from exiting the industry.<br>
It is becoming less costly for buyers to switch brands.
Industry products are becoming less strongly differentiated.
There is excess inventory, idle production capacity, or products have high fixed costs or high storage costs.
The number of competitors is increasing, and are becoming more equal in size and competitive capability.
The strategic and geographic diversity of competitors is increasing.
High exit barriers keep weak firms from exiting the industry.<br>
11
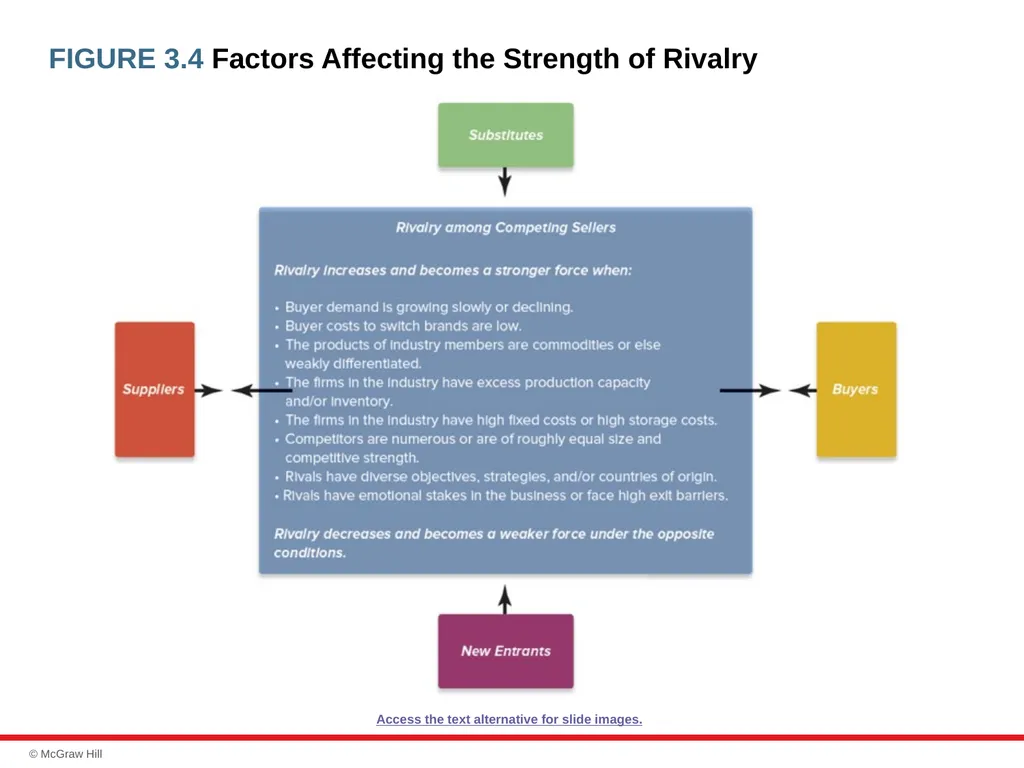
FIGURE 3.4 Factors Affecting the Strength of Rivalry Access the text alternative for slide images.<br>
12
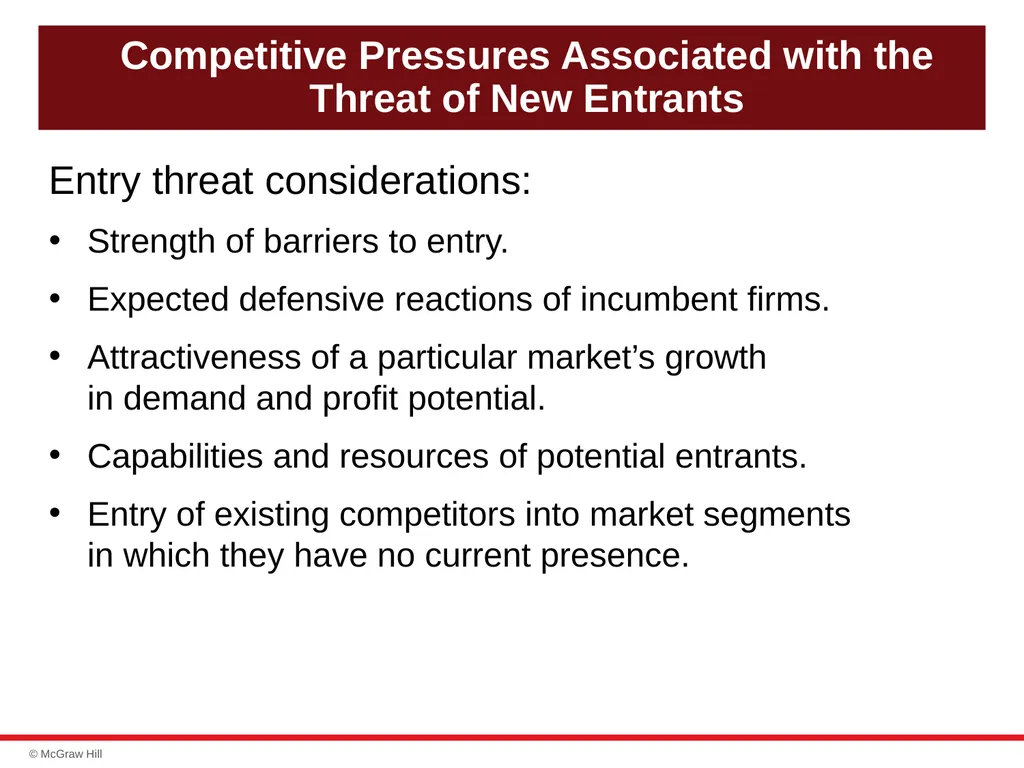
Competitive Pressures Associated with the Threat of New Entrants Entry threat considerations:
Strength of barriers to entry.
Expected defensive reactions of incumbent firms.
Attractiveness of a particular market’s growth in demand and profit potential.
Capabilities and resources of potential entrants.
Entry of existing competitors into market segments in which they have no current presence.<br>
Strength of barriers to entry.
Expected defensive reactions of incumbent firms.
Attractiveness of a particular market’s growth in demand and profit potential.
Capabilities and resources of potential entrants.
Entry of existing competitors into market segments in which they have no current presence.<br>
13
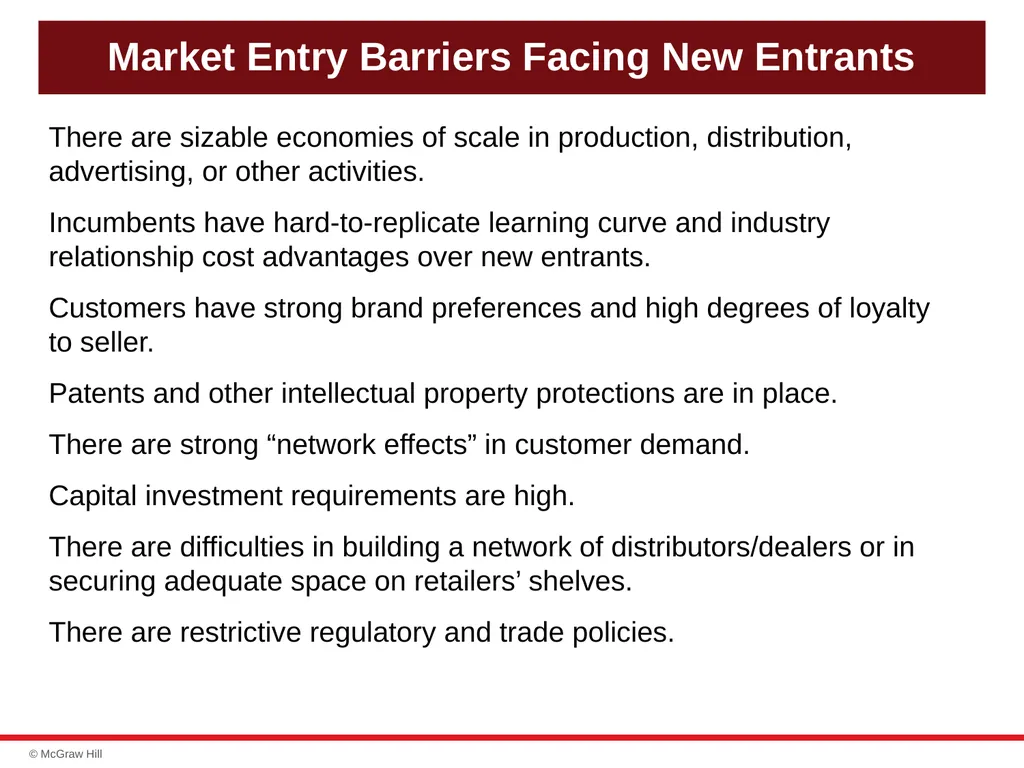
Market Entry Barriers Facing New Entrants There are sizable economies of scale in production, distribution, advertising, or other activities.
Incumbents have hard-to-replicate learning curve and industry relationship cost advantages over new entrants.
Customers have strong brand preferences and high degrees of loyalty to seller.
Patents and other intellectual property protections are in place.
There are strong “network effects” in customer demand.
Capital investment requirements are high.
There are difficulties in building a network of distributors/dealers or in securing adequate space on retailers’ shelves.
There are restrictive regulatory and trade policies.<br>
Incumbents have hard-to-replicate learning curve and industry relationship cost advantages over new entrants.
Customers have strong brand preferences and high degrees of loyalty to seller.
Patents and other intellectual property protections are in place.
There are strong “network effects” in customer demand.
Capital investment requirements are high.
There are difficulties in building a network of distributors/dealers or in securing adequate space on retailers’ shelves.
There are restrictive regulatory and trade policies.<br>
14
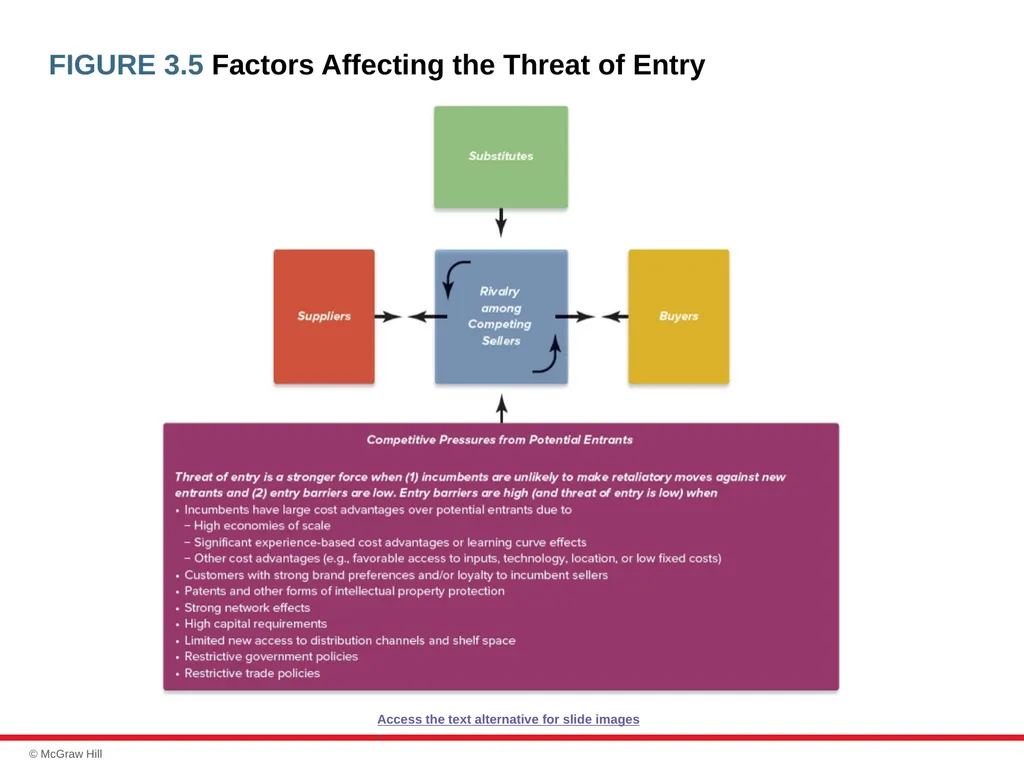
FIGURE 3.5 Factors Affecting the Threat of Entry Access the text alternative for slide images.<br>
15
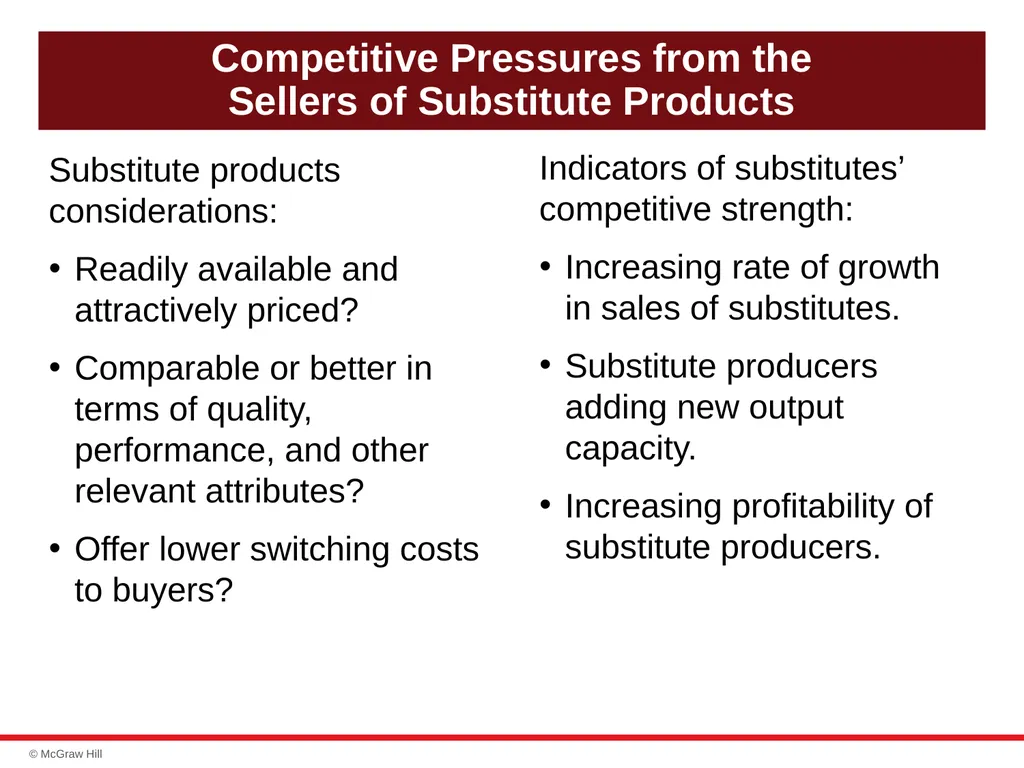
Competitive Pressures from the Sellers of Substitute Products Substitute products considerations:
Readily available and attractively priced?
Comparable or better in terms of quality, performance, and other relevant attributes?
Offer lower switching costs to buyers? Indicators of substitutes’ competitive strength:
Increasing rate of growth in sales of substitutes.
Substitute producers adding new output capacity.
Increasing profitability of substitute producers.<br>
Readily available and attractively priced?
Comparable or better in terms of quality, performance, and other relevant attributes?
Offer lower switching costs to buyers? Indicators of substitutes’ competitive strength:
Increasing rate of growth in sales of substitutes.
Substitute producers adding new output capacity.
Increasing profitability of substitute producers.<br>
16
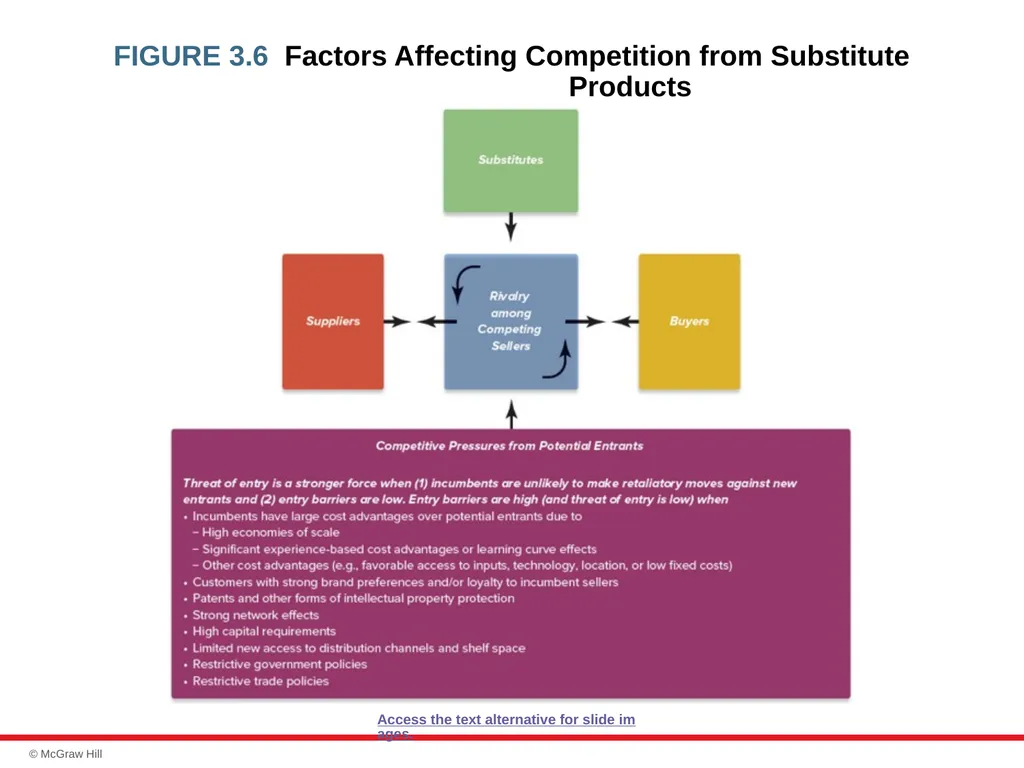
FIGURE 3.6 Factors Affecting Competition from Substitute Products Access the text alternative for slide images.<br>
17
Competitive Pressures Stemming from
Supplier Bargaining Power Supplier bargaining power depends on:
Strength of demand for and availability of suppliers’ products.
Whether suppliers provide a differentiated input that enhances the performance of the industry’s product.
Industry members’ costs for switching among suppliers.
Size and number of suppliers relative to industry members.
Possibility of backward integration into suppliers’ industry.
Fraction of the cost of the supplier’s product relative to the total cost of the industry’s product.
Availability of good substitutes for suppliers’ products.
Whether industry members are major customers of suppliers.<br>
Strength of demand for and availability of suppliers’ products.
Whether suppliers provide a differentiated input that enhances the performance of the industry’s product.
Industry members’ costs for switching among suppliers.
Size and number of suppliers relative to industry members.
Possibility of backward integration into suppliers’ industry.
Fraction of the cost of the supplier’s product relative to the total cost of the industry’s product.
Availability of good substitutes for suppliers’ products.
Whether industry members are major customers of suppliers.<br>
18
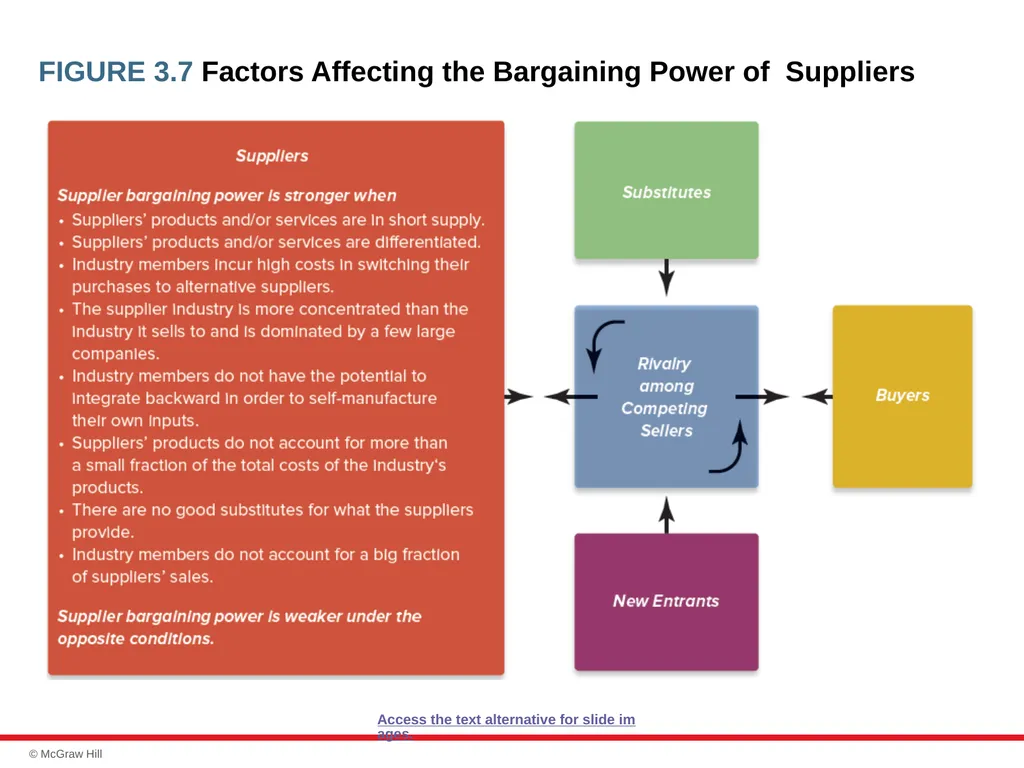
FIGURE 3.7 Factors Affecting the Bargaining Power of Suppliers Access the text alternative for slide images.<br>
19
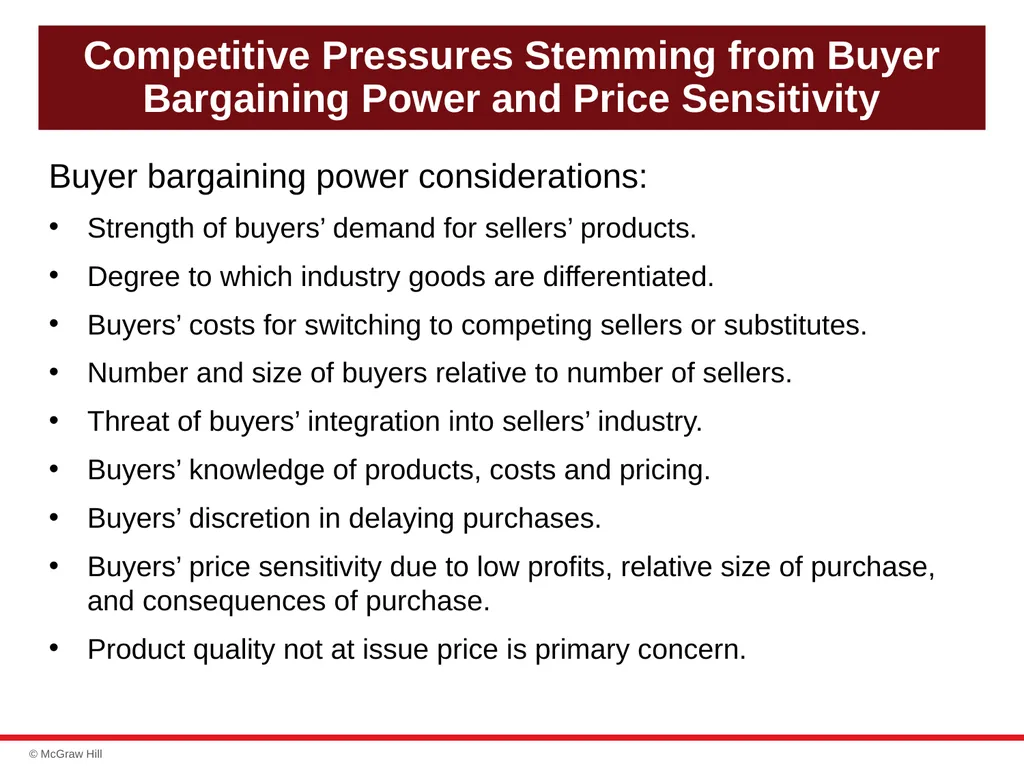
Competitive Pressures Stemming from Buyer Bargaining Power and Price Sensitivity Buyer bargaining power considerations:
Strength of buyers’ demand for sellers’ products.
Degree to which industry goods are differentiated.
Buyers’ costs for switching to competing sellers or substitutes.
Number and size of buyers relative to number of sellers.
Threat of buyers’ integration into sellers’ industry.
Buyers’ knowledge of products, costs and pricing.
Buyers’ discretion in delaying purchases.
Buyers’ price sensitivity due to low profits, relative size of purchase, and consequences of purchase.
Product quality not at issue price is primary concern.<br>
Strength of buyers’ demand for sellers’ products.
Degree to which industry goods are differentiated.
Buyers’ costs for switching to competing sellers or substitutes.
Number and size of buyers relative to number of sellers.
Threat of buyers’ integration into sellers’ industry.
Buyers’ knowledge of products, costs and pricing.
Buyers’ discretion in delaying purchases.
Buyers’ price sensitivity due to low profits, relative size of purchase, and consequences of purchase.
Product quality not at issue price is primary concern.<br>
20
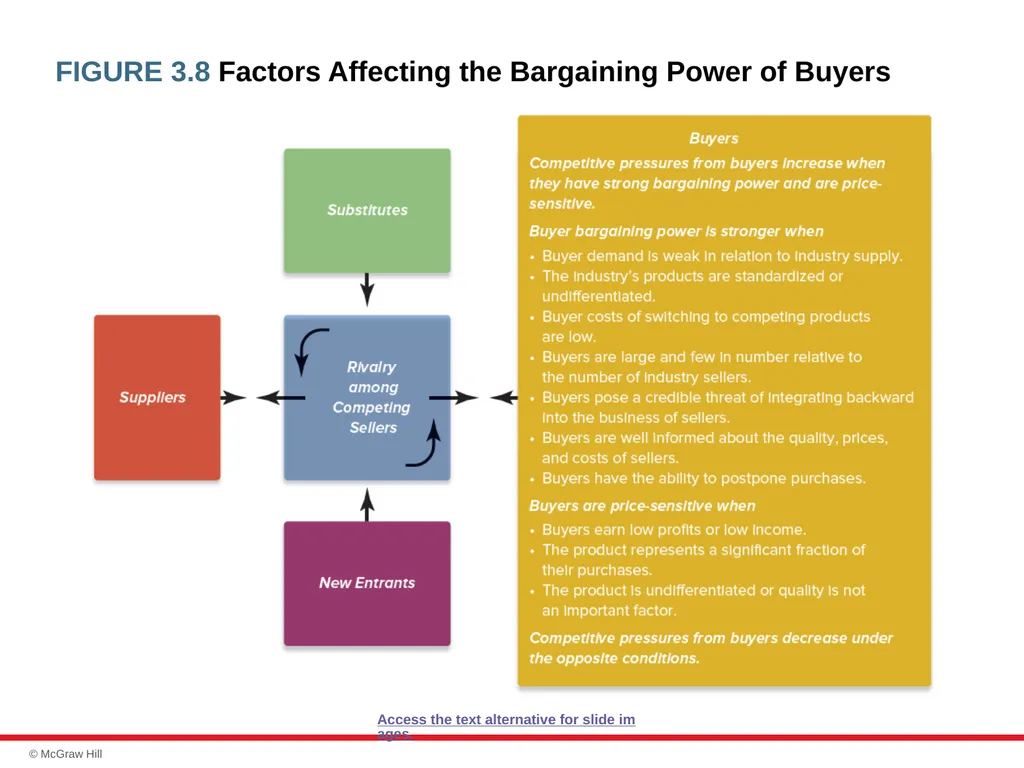
FIGURE 3.8 Factors Affecting the Bargaining Power of Buyers Access the text alternative for slide images.<br>
21
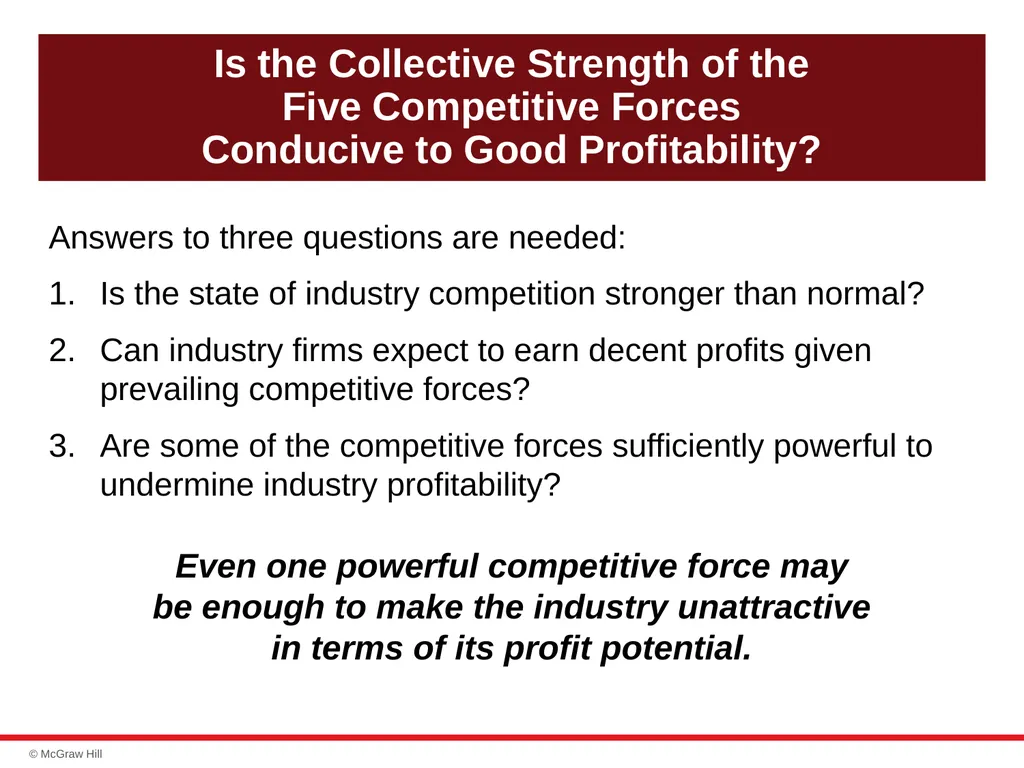
Is the Collective Strength of the Five Competitive Forces Conducive to Good Profitability? Answers to three questions are needed:
Is the state of industry competition stronger than normal?
Can industry firms expect to earn decent profits given prevailing competitive forces?
Are some of the competitive forces sufficiently powerful to undermine industry profitability? Even one powerful competitive force may be enough to make the industry unattractive in terms of its profit potential.<br>
Is the state of industry competition stronger than normal?
Can industry firms expect to earn decent profits given prevailing competitive forces?
Are some of the competitive forces sufficiently powerful to undermine industry profitability? Even one powerful competitive force may be enough to make the industry unattractive in terms of its profit potential.<br>
22
Matching Company Strategy to
Competitive Conditions Effectively matching a firm’s business strategy to prevailing competitive conditions has two aspects:
Pursuing avenues that shield the firm from as many competitive pressures as possible.
Initiating actions calculated to shift competitive forces in the firm’s favor by altering underlying factors driving the five forces.<br>
Pursuing avenues that shield the firm from as many competitive pressures as possible.
Initiating actions calculated to shift competitive forces in the firm’s favor by altering underlying factors driving the five forces.<br>
23
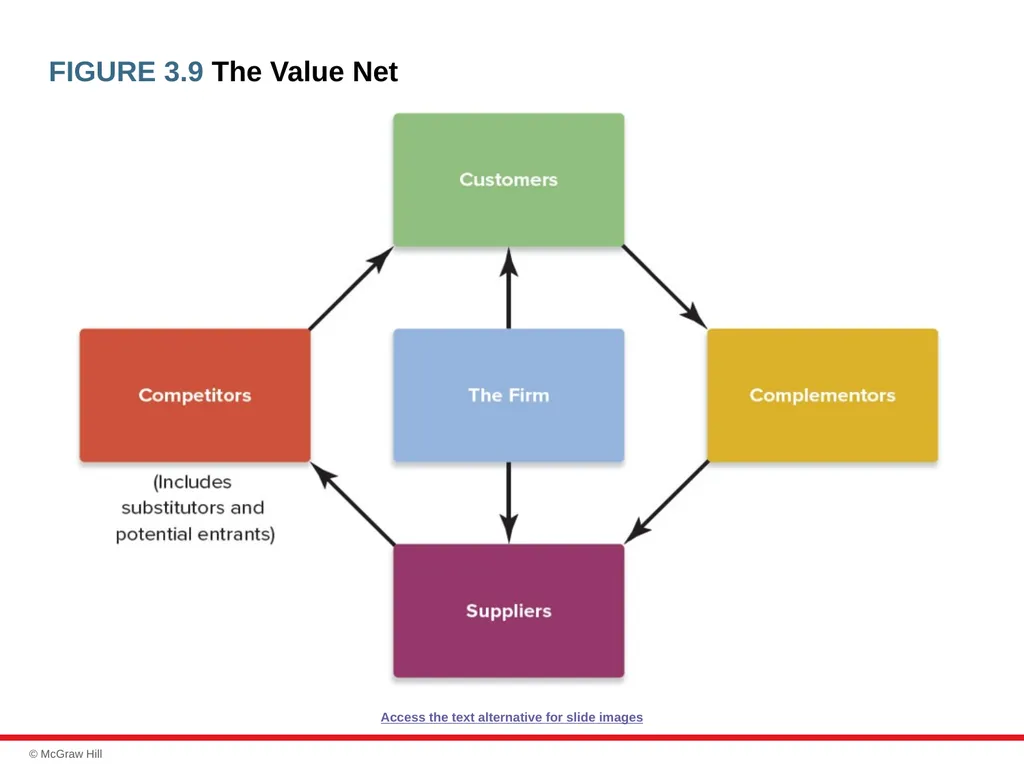
Complementors and the Value Net How the value net differs from the five forces:
Focuses on the interactions of industry participants with a particular (focal) company.
Defines the category of competitors to include the focal firm’s direct competitors, industry rivals, the sellers of substitute products, and potential entrants.
Introduces a new category of industry participant—complementors—producers of products that enhance the value of the focal firm’s products when they are used together.<br>
Focuses on the interactions of industry participants with a particular (focal) company.
Defines the category of competitors to include the focal firm’s direct competitors, industry rivals, the sellers of substitute products, and potential entrants.
Introduces a new category of industry participant—complementors—producers of products that enhance the value of the focal firm’s products when they are used together.<br>
24
FIGURE 3.9 The Value Net Access the text alternative for slide images<br>
25
Industry Dynamics and the Forces Driving Change Driving forces analysis has three steps.
Identifying what the driving forces are.
Assessing whether the drivers of change are acting to make the industry more or less attractive.
Determining what strategy changes are needed to prepare for the impact of the driving forces.<br>
Identifying what the driving forces are.
Assessing whether the drivers of change are acting to make the industry more or less attractive.
Determining what strategy changes are needed to prepare for the impact of the driving forces.<br>
26
Identifying the Forces Driving Industry Change Changes in an industry’s long-term growth rate.
Increasing globalization.
Emerging new Internet capabilities and applications.
Shifts in who buys industry products and how the products are used.
Technological change and manufacturing process innovation.
Product and marketing innovation.
Entry or exit of major firms.
Diffusion of technical know-how across firms and countries.
Changes in costs and efficiencies.
Reductions in uncertainty and business risk.
Regulatory influences and government policy changes.
Changing societal concerns, attitudes, and lifestyles<br>
Increasing globalization.
Emerging new Internet capabilities and applications.
Shifts in who buys industry products and how the products are used.
Technological change and manufacturing process innovation.
Product and marketing innovation.
Entry or exit of major firms.
Diffusion of technical know-how across firms and countries.
Changes in costs and efficiencies.
Reductions in uncertainty and business risk.
Regulatory influences and government policy changes.
Changing societal concerns, attitudes, and lifestyles<br>
27
Assessing the Impact of the Factors Driving Industry Change Are the driving forces, on balance, acting to cause demand for the industry’s product to increase or decrease?
Is the collective impact of the driving forces making competition more or less intense?
Will the combined impacts of the driving forces lead to higher or lower industry profitability?<br>
Is the collective impact of the driving forces making competition more or less intense?
Will the combined impacts of the driving forces lead to higher or lower industry profitability?<br>
28
Adjusting Strategy to Prepare for the Impacts of Driving Forces What strategy adjustments will be needed
to deal with the impacts of the driving forces?
What immediate adjustments must be made?
What actions currently being taken should be halted or abandoned?
What can we do now to prepare for adjustments we anticipate making in the future?<br>
What immediate adjustments must be made?
What actions currently being taken should be halted or abandoned?
What can we do now to prepare for adjustments we anticipate making in the future?<br>
29
Strategic Group Analysis Strategic group.
Consists of those industry members with similar competitive approaches and positions in the market.
Having comparable product-line breadth.
Employing the same distribution channels.
Depending on identical technological approaches.
Competing in the same geographic areas
Offering the same product attributes to buyers.
Offering similar services and technical assistance.<br>
Consists of those industry members with similar competitive approaches and positions in the market.
Having comparable product-line breadth.
Employing the same distribution channels.
Depending on identical technological approaches.
Competing in the same geographic areas
Offering the same product attributes to buyers.
Offering similar services and technical assistance.<br>
30
Using Strategic Group Maps to Assess the Market Positions of Key Competitors Constructing a strategic group map:
Identify the competitive characteristics that delineate strategic approaches used in the industry.
Plot the firms on a two-variable map using pairs of competitive characteristics.
Assign firms occupying about the same map location to the same strategic group.
Draw circles around each strategic group, making the circles proportional to the size of the group’s share of total industry sales revenues.<br>
Identify the competitive characteristics that delineate strategic approaches used in the industry.
Plot the firms on a two-variable map using pairs of competitive characteristics.
Assign firms occupying about the same map location to the same strategic group.
Draw circles around each strategic group, making the circles proportional to the size of the group’s share of total industry sales revenues.<br>
31
Typical Variables Used in Creating Group Maps Price and quality range (high, medium, low).
Geographic coverage (local, regional, national, global).
Product-line breadth (wide, narrow).
Degree of service offered (no frills, limited, full).
Distribution channels (retail, wholesale, Internet, multiple).
Degree of vertical integration (none, partial, full).
Degree of diversification into other industries (none, some, considerable).<br>
Geographic coverage (local, regional, national, global).
Product-line breadth (wide, narrow).
Degree of service offered (no frills, limited, full).
Distribution channels (retail, wholesale, Internet, multiple).
Degree of vertical integration (none, partial, full).
Degree of diversification into other industries (none, some, considerable).<br>
32
Guidelines for Creating Group Maps Variables selected as map axes should not be highly correlated.
Variables should reflect important (sizable) differences among rival approaches.
Variables may be quantitative, continuous, discrete, or defined in terms of distinct classes and combinations.
Drawing group circles proportional to the combined sales of firms in each group will reflect the relative sizes of each strategic group.
Drawing maps using different pairs of variables will show the different competitive positioning relationships present in the industry’s structure.<br>
Variables should reflect important (sizable) differences among rival approaches.
Variables may be quantitative, continuous, discrete, or defined in terms of distinct classes and combinations.
Drawing group circles proportional to the combined sales of firms in each group will reflect the relative sizes of each strategic group.
Drawing maps using different pairs of variables will show the different competitive positioning relationships present in the industry’s structure.<br>
33
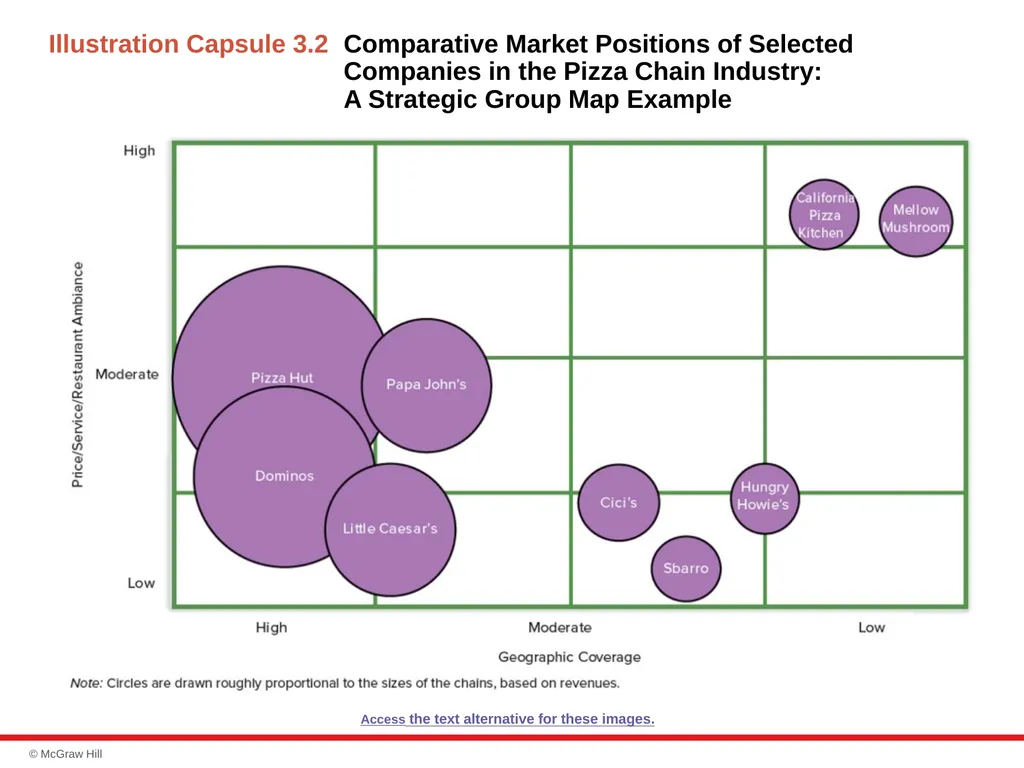
Illustration Capsule 3.2 Comparative Market Positions of Selected Companies in the Pizza Chain Industry:
A Strategic Group Map Example Access the text alternative for these images.<br>
34
Examining the Comparative Market Positions of Strategic Groups in the Pizza Chain Industry Which strategic group is located in the least favorable market position? Which group is in the most favorable position?
Which strategic group is likely to experience increased intragroup competition?
Which groups are most threatened by the likely strategic moves of members of nearby strategic groups?<br>
Which strategic group is likely to experience increased intragroup competition?
Which groups are most threatened by the likely strategic moves of members of nearby strategic groups?<br>
35
The Value of Strategic Group Maps Maps are useful in identifying groups of close and distant rivals in an industry.
Not all map positions are equally attractive.
Prevailing competitive pressures from the industry’s five forces may cause the profit potential of different strategic groups to vary.
Industry driving forces may favor some strategic groups and hurt others.<br>
Not all map positions are equally attractive.
Prevailing competitive pressures from the industry’s five forces may cause the profit potential of different strategic groups to vary.
Industry driving forces may favor some strategic groups and hurt others.<br>
36
Competitor Analysis Competitive intelligence.
Information about rivals that is useful in anticipating their next strategic moves.
Signals of the likelihood of strategic moves:
Rivals under pressure to improve financial performance.
Rivals seeking to increase market standing.
Public statements of rivals’ intentions.
Profiles developed by competitive intelligence units.<br>
Information about rivals that is useful in anticipating their next strategic moves.
Signals of the likelihood of strategic moves:
Rivals under pressure to improve financial performance.
Rivals seeking to increase market standing.
Public statements of rivals’ intentions.
Profiles developed by competitive intelligence units.<br>
37
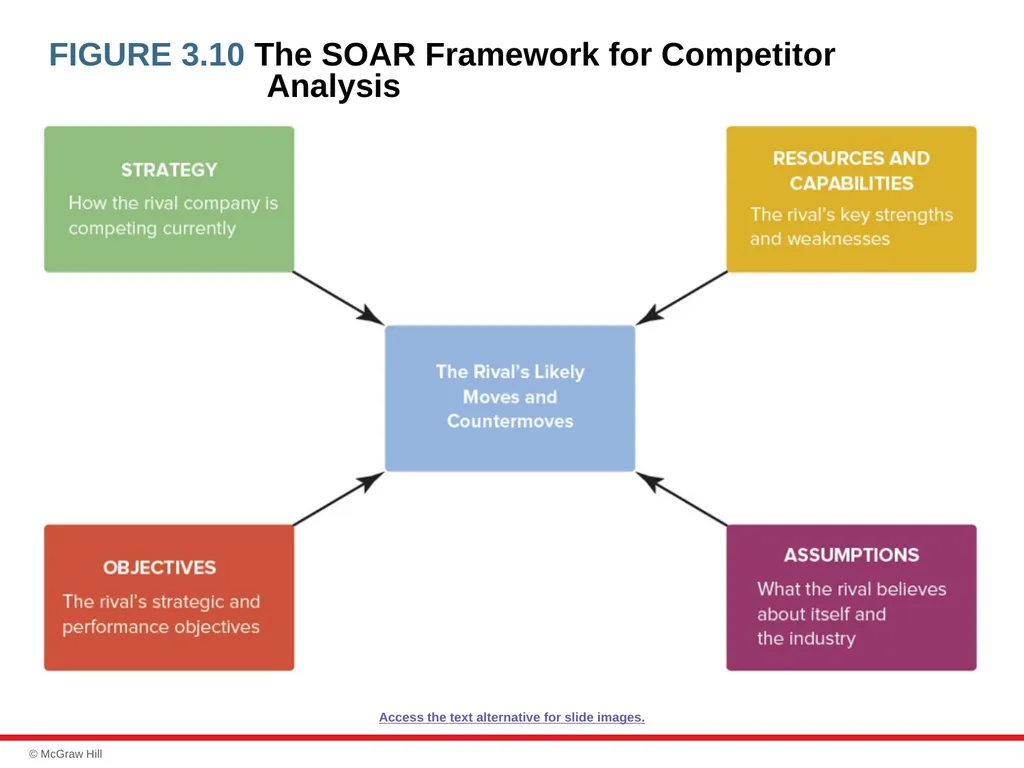
FIGURE 3.10 The SOAR Framework for Competitor Analysis Access the text alternative for slide images.<br>
38
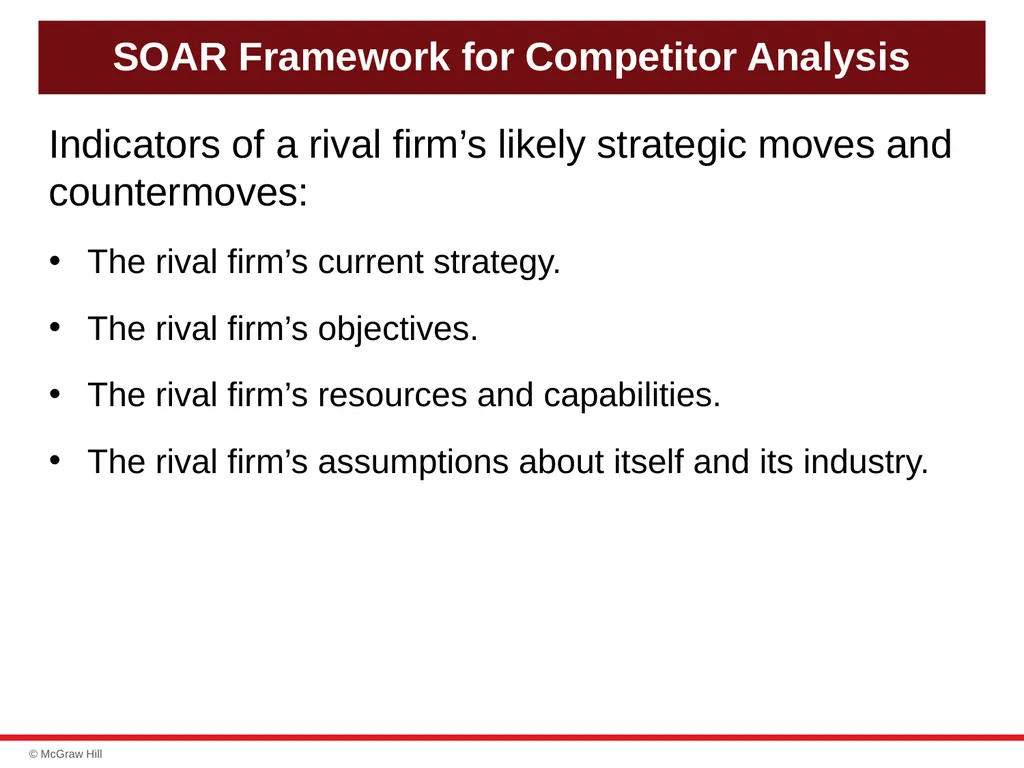
SOAR Framework for Competitor Analysis Indicators of a rival firm’s likely strategic moves and countermoves:
The rival firm’s current strategy.
The rival firm’s objectives.
The rival firm’s resources and capabilities.
The rival firm’s assumptions about itself and its industry.<br>
The rival firm’s current strategy.
The rival firm’s objectives.
The rival firm’s resources and capabilities.
The rival firm’s assumptions about itself and its industry.<br>
39
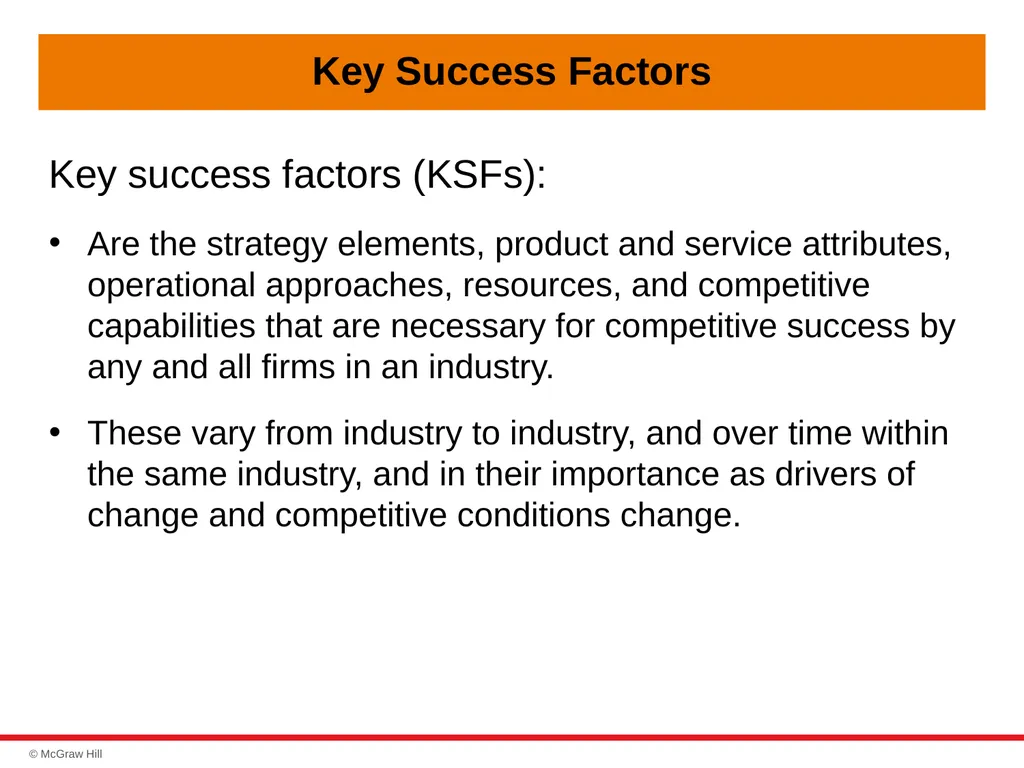
Key Success Factors Key success factors (KSFs):
Are the strategy elements, product and service attributes, operational approaches, resources, and competitive capabilities that are necessary for competitive success by any and all firms in an industry.
These vary from industry to industry, and over time within the same industry, and in their importance as drivers of change and competitive conditions change.<br>
Are the strategy elements, product and service attributes, operational approaches, resources, and competitive capabilities that are necessary for competitive success by any and all firms in an industry.
These vary from industry to industry, and over time within the same industry, and in their importance as drivers of change and competitive conditions change.<br>
40
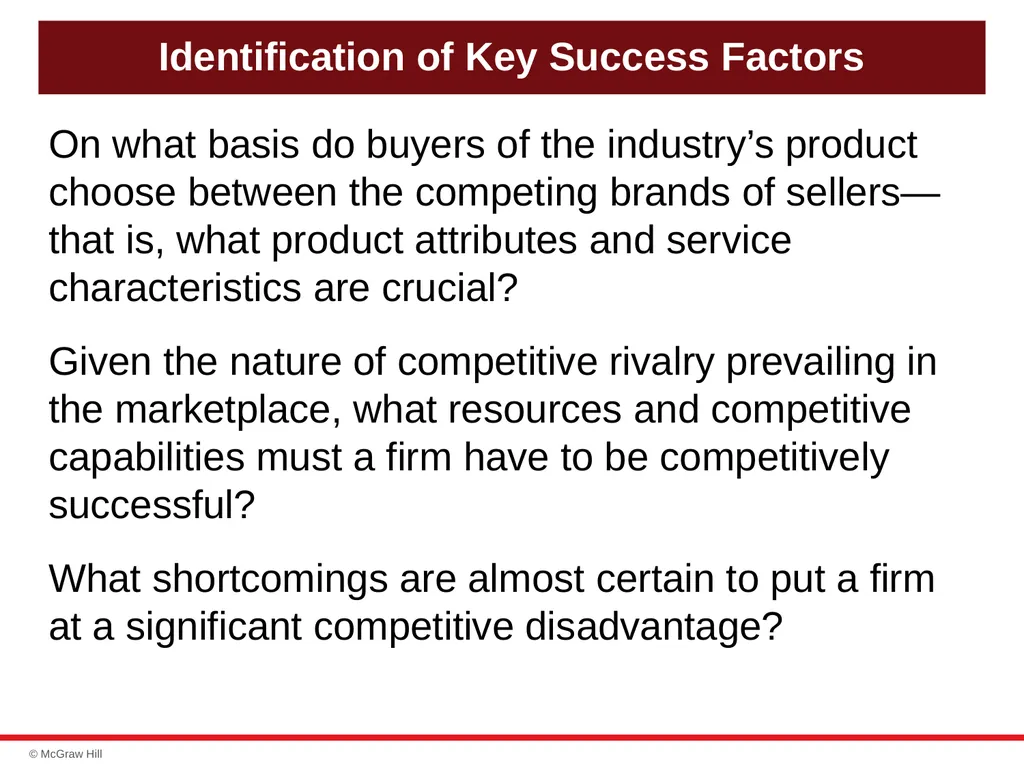
Identification of Key Success Factors On what basis do buyers of the industry’s product choose between the competing brands of sellers—that is, what product attributes and service characteristics are crucial?
Given the nature of competitive rivalry prevailing in the marketplace, what resources and competitive capabilities must a firm have to be competitively successful?
What shortcomings are almost certain to put a firm at a significant competitive disadvantage?<br>
Given the nature of competitive rivalry prevailing in the marketplace, what resources and competitive capabilities must a firm have to be competitively successful?
What shortcomings are almost certain to put a firm at a significant competitive disadvantage?<br>
41
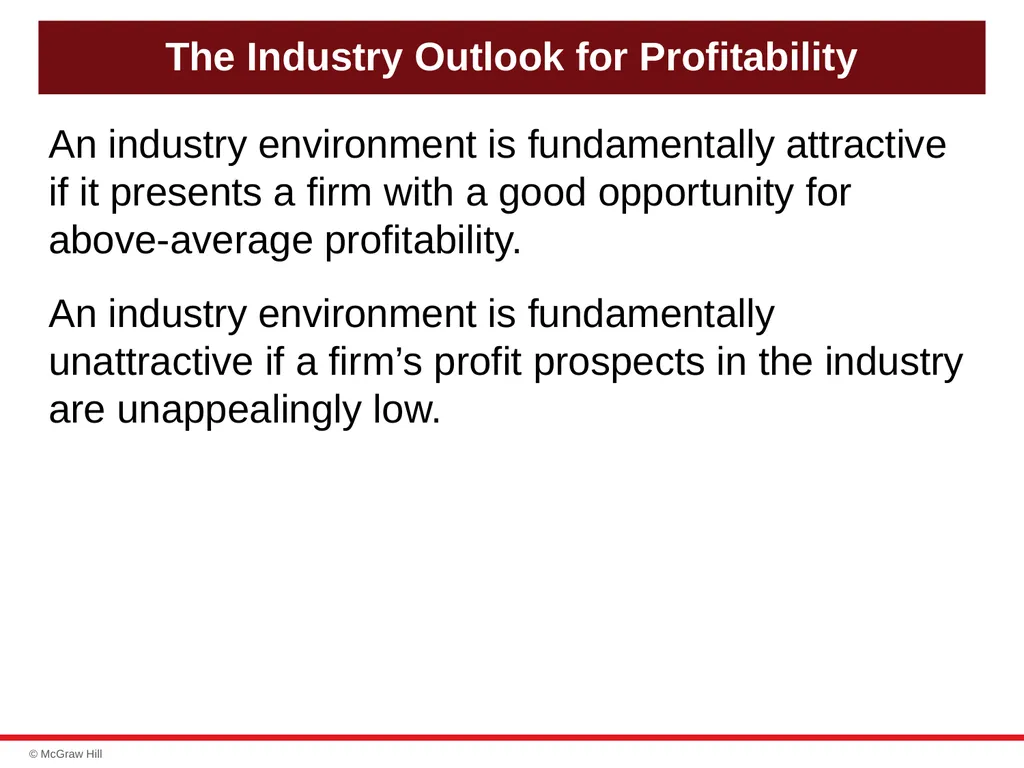
The Industry Outlook for Profitability An industry environment is fundamentally attractive if it presents a firm with a good opportunity for above-average profitability.
An industry environment is fundamentally unattractive if a firm’s profit prospects in the industry are unappealingly low.<br>
An industry environment is fundamentally unattractive if a firm’s profit prospects in the industry are unappealingly low.<br>
42
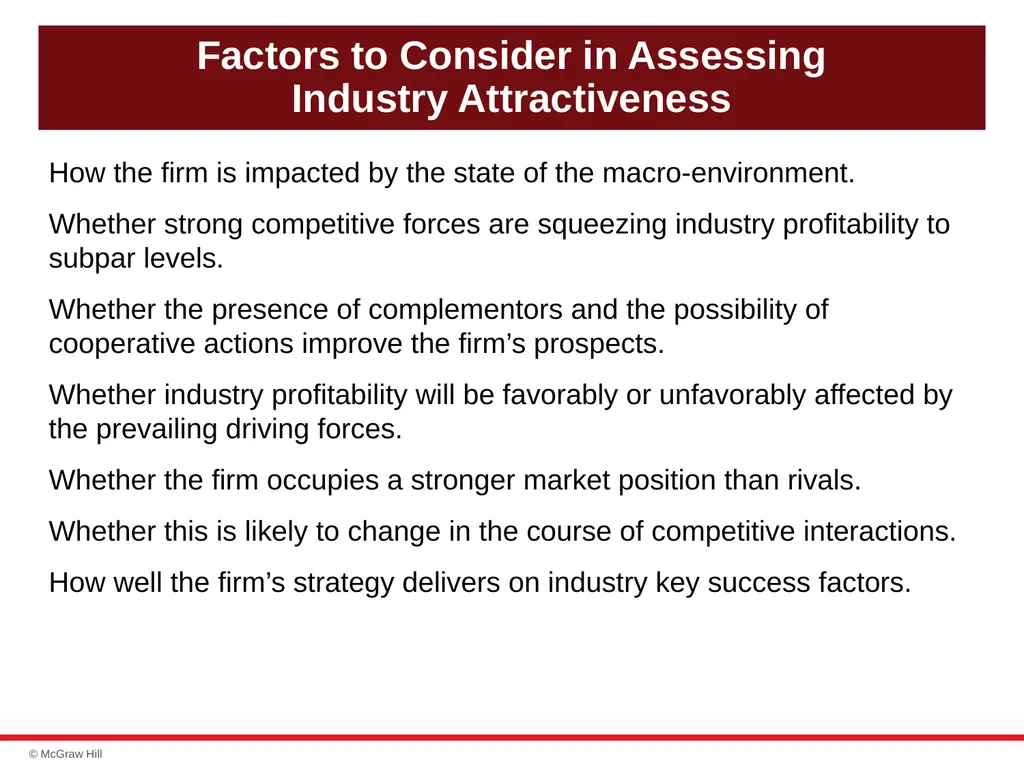
Factors to Consider in Assessing Industry Attractiveness How the firm is impacted by the state of the macro-environment.
Whether strong competitive forces are squeezing industry profitability to subpar levels.
Whether the presence of complementors and the possibility of cooperative actions improve the firm’s prospects.
Whether industry profitability will be favorably or unfavorably affected by the prevailing driving forces.
Whether the firm occupies a stronger market position than rivals.
Whether this is likely to change in the course of competitive interactions.
How well the firm’s strategy delivers on industry key success factors.<br>
Whether strong competitive forces are squeezing industry profitability to subpar levels.
Whether the presence of complementors and the possibility of cooperative actions improve the firm’s prospects.
Whether industry profitability will be favorably or unfavorably affected by the prevailing driving forces.
Whether the firm occupies a stronger market position than rivals.
Whether this is likely to change in the course of competitive interactions.
How well the firm’s strategy delivers on industry key success factors.<br>
43
Industry Attractiveness Is Not the Same for All Participants Industry outsiders may conclude that they have the resources to easily hurdle the barriers to entering an attractive industry while other outsiders may find the same industry unattractive because they do not want to challenge market leaders and have better opportunities elsewhere.
A particular industry’s attractiveness depends in large part on whether a company has the resources and capabilities to be competitively successful and profitable in that environment.<br>
A particular industry’s attractiveness depends in large part on whether a company has the resources and capabilities to be competitively successful and profitable in that environment.<br>
44
What Should a Current Competitor Decide
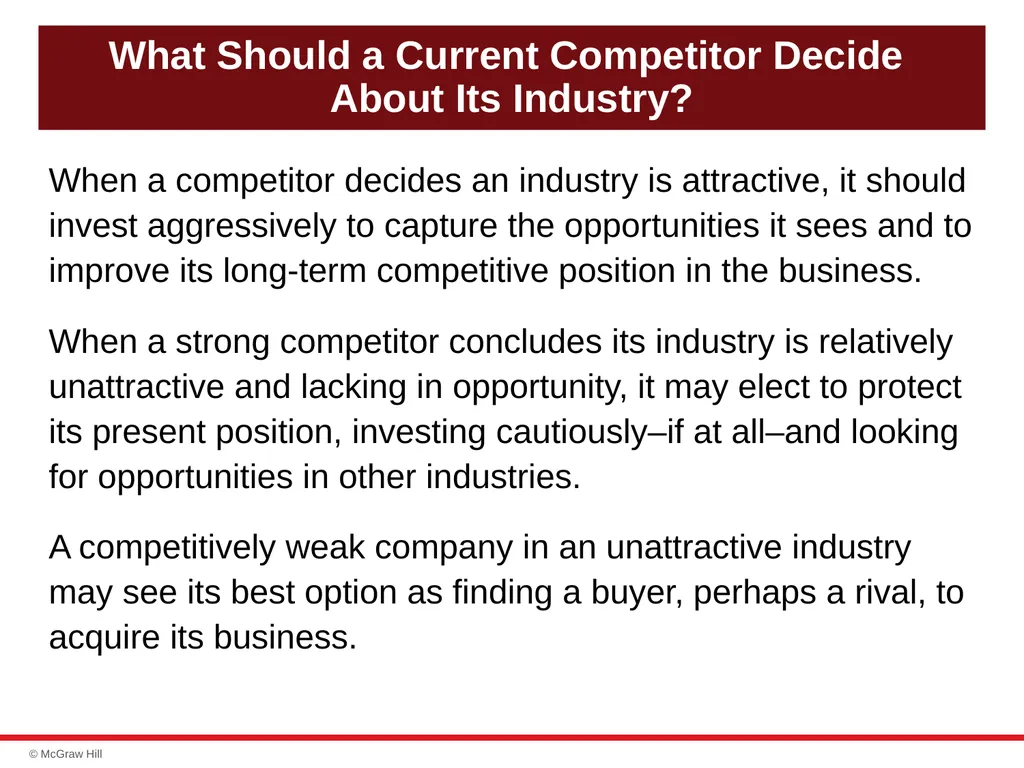
About Its Industry? When a competitor decides an industry is attractive, it should invest aggressively to capture the opportunities it sees and to improve its long-term competitive position in the business.
When a strong competitor concludes its industry is relatively unattractive and lacking in opportunity, it may elect to protect its present position, investing cautiously–if at all–and looking for opportunities in other industries.
A competitively weak company in an unattractive industry may see its best option as finding a buyer, perhaps a rival, to acquire its business.<br>
When a strong competitor concludes its industry is relatively unattractive and lacking in opportunity, it may elect to protect its present position, investing cautiously–if at all–and looking for opportunities in other industries.
A competitively weak company in an unattractive industry may see its best option as finding a buyer, perhaps a rival, to acquire its business.<br>
45
End of Main Section. © 2022 McGraw Hill. All rights reserved. Authorized only for instructor use in the classroom.
No reproduction or further distribution permitted without the prior written consent of McGraw Hill.<br>
No reproduction or further distribution permitted without the prior written consent of McGraw Hill.<br>
46
TEXT ALTERNATIVES FOR SLIDE IMAGES<br>
47
Figure 3.1: From Analyzing Company’s Situation to Choosing a Strategy, Text Alternative Return to slide Thinking strategically about a company's external (Chapter 3) and internal (Chapter 4) environments helps to:
Form a strategic vision of where the company needs to head.
Identify promising strategic options for the company.
Select the best strategy and business model for the company. Return to slide.<br>
Form a strategic vision of where the company needs to head.
Identify promising strategic options for the company.
Select the best strategy and business model for the company. Return to slide.<br>
48
Figure 3.2: The Components of a Company’s Macro-Environment, Text Alternative Return to slide. A company's macroenvironment includes the economic conditions, sociocultural forces, environmental forces, legal and regulatory forces, and political forces.
The immediate industry and competitive environment includes the company, suppliers, substitute products, buyers, new entrants, and rival firms. Return to slide.<br>
The immediate industry and competitive environment includes the company, suppliers, substitute products, buyers, new entrants, and rival firms. Return to slide.<br>
49
Figure 3.4: Factors Affecting the Strength of Rivalry, Text Alternative Rivalry increases and becomes a stronger force when:
Buyer demand is growing slowly.
Buyer costs to switch brands are low.
The products of industry members are commodities or else weakly differentiated.
The firms in the industry have excess production capacity or inventory.
The firms in the industry have high fixed costs or high storage costs.
Competitors are numerous or are of roughly equal size and competitive strength.
Rivals have diverse objectives, strategies, or countries of origin.
Rivals have emotional stakes in the business or face high exit barriers.
Rivalry decreases and becomes a weaker force under the opposite conditions. Return to slide.<br>
Buyer demand is growing slowly.
Buyer costs to switch brands are low.
The products of industry members are commodities or else weakly differentiated.
The firms in the industry have excess production capacity or inventory.
The firms in the industry have high fixed costs or high storage costs.
Competitors are numerous or are of roughly equal size and competitive strength.
Rivals have diverse objectives, strategies, or countries of origin.
Rivals have emotional stakes in the business or face high exit barriers.
Rivalry decreases and becomes a weaker force under the opposite conditions. Return to slide.<br>
50
Figure 3.3: The Five-Forces Model of Competition: A Key Analytical Tool, Text Alternative Return to slide. Rivalry among competing sellers is at the center of the graphic. The text reads, “Competitive pressures come from other firms in the industry.” Surrounding this are four other types of forces and their competitive pressures.
Firms in other industries offering substitute products and competitive pressures coming from the producers of substitute products.
Buyers: competitive pressures stemming from buyer bargaining power.
Potential new entrants: competitive pressures coming from the threat of entry of new rivals.
Suppliers: competitive pressures stemming from supplier bargaining power.
All four forces have arrows pointing toward the center’s rivalry among competing sellers. In turn, rivalry among competing sellers has two arrows pointing outward, one toward buyers, and one toward suppliers. Return to slide.<br>
Firms in other industries offering substitute products and competitive pressures coming from the producers of substitute products.
Buyers: competitive pressures stemming from buyer bargaining power.
Potential new entrants: competitive pressures coming from the threat of entry of new rivals.
Suppliers: competitive pressures stemming from supplier bargaining power.
All four forces have arrows pointing toward the center’s rivalry among competing sellers. In turn, rivalry among competing sellers has two arrows pointing outward, one toward buyers, and one toward suppliers. Return to slide.<br>
51
Figure 3.5: Factors Affecting the Threat of Entry, Text Alternative Return to the slide. The five-forces model of competition is displayed. Within the box, Competitive Pressures from Potential Entrants, is text which reads: “threat of entry is a stronger force when incumbents are unlikely to make retaliatory moves against new entrants and entry barriers are low.” Entry barriers are high (and threat of entry is low) when:
Incumbents have large cost advantages over potential entrants due to high economies of scale; significant experience-based cost advantages or learning curve effects; and other cost advantages (e.g., favorable access to inputs, technology, location, or low fixed costs).
Customers have strong brand preferences and/or loyalty to incumbent sellers.
Patents and other forms of intellectual property protection are in place.
There are strong network effects.
Capital requirements are high.
There is limited new access to distribution channels and shelf space.
Government policies are restrictive.
There are restrictive trade policies. Return to slide.<br>
Incumbents have large cost advantages over potential entrants due to high economies of scale; significant experience-based cost advantages or learning curve effects; and other cost advantages (e.g., favorable access to inputs, technology, location, or low fixed costs).
Customers have strong brand preferences and/or loyalty to incumbent sellers.
Patents and other forms of intellectual property protection are in place.
There are strong network effects.
Capital requirements are high.
There is limited new access to distribution channels and shelf space.
Government policies are restrictive.
There are restrictive trade policies. Return to slide.<br>
52
Figure 3.6: Factors Affecting Competition from Substitute Products, Text Alternative Return to slide. Competitive pressures from substitutes are stronger when:
Good substitutes are readily available and attractively priced.
Substitutes have comparable or better performance features.
Buyers have low costs in switching to substitutes.
Competitive pressures from substitutes are weaker under the opposite conditions.
Signs that competition from substitutes is strong:
Sales of substitutes are growing faster than sales of the industry being analyzed.
Producers of substitutes are moving to add new capacity.
Profits of the producers of substitutes are on the rise. Return to slide.<br>
Good substitutes are readily available and attractively priced.
Substitutes have comparable or better performance features.
Buyers have low costs in switching to substitutes.
Competitive pressures from substitutes are weaker under the opposite conditions.
Signs that competition from substitutes is strong:
Sales of substitutes are growing faster than sales of the industry being analyzed.
Producers of substitutes are moving to add new capacity.
Profits of the producers of substitutes are on the rise. Return to slide.<br>
53
Figure 3.7: Factors Affecting the Bargaining Power of Suppliers, Text Alternative Return to slide. Supplier bargaining power is stronger when:
Suppliers’ products and or services are in short supply.
Suppliers’ products and or services are differentiated.
Industry members incur high costs in switching their purchases to alternative suppliers.
The supplier industry is more concentrated than the industry it sells to and is dominated by a few large companies.
Industry members do not have the potential to integrate backward in order to self-manufacture their own inputs.
Suppliers’ products do not account for more than a small fraction of the total costs of the industry’s products.
There are no good substitutes for what the suppliers provide.
Industry members do not account for a big fraction of suppliers’ sales.
Supplier bargaining power is weaker under the opposite conditions. Return to slide.<br>
Suppliers’ products and or services are in short supply.
Suppliers’ products and or services are differentiated.
Industry members incur high costs in switching their purchases to alternative suppliers.
The supplier industry is more concentrated than the industry it sells to and is dominated by a few large companies.
Industry members do not have the potential to integrate backward in order to self-manufacture their own inputs.
Suppliers’ products do not account for more than a small fraction of the total costs of the industry’s products.
There are no good substitutes for what the suppliers provide.
Industry members do not account for a big fraction of suppliers’ sales.
Supplier bargaining power is weaker under the opposite conditions. Return to slide.<br>
54
Figure 3.8: Factors Affecting the Bargaining Power of Buyers, Text Alternative Return to slide. Competitive pressures from buyers increase when they have strong bargaining power and are price-sensitive. Buyer bargaining power is stronger when:
Buyer demand is weak in relation to industry supply.
The industry’s products are standardized or undifferentiated.
Buyer costs of switching to competing products are low.
Buyers are large and few in number relative to the number of industry sellers.
Buyers pose a credible threat of integrating backward into the business of sellers.
Buyers are well informed about the quality, prices, and costs of sellers.
Buyers have the ability to postpone purchases.
Buyers are price-sensitive and increase competitive pressures when:
Buyers earn low profits or low income.
The product represents a significant fraction of their purchases.
Competitive pressures from buyers decrease and become a weaker force under the opposite conditions. Return to slide.<br>
Buyer demand is weak in relation to industry supply.
The industry’s products are standardized or undifferentiated.
Buyer costs of switching to competing products are low.
Buyers are large and few in number relative to the number of industry sellers.
Buyers pose a credible threat of integrating backward into the business of sellers.
Buyers are well informed about the quality, prices, and costs of sellers.
Buyers have the ability to postpone purchases.
Buyers are price-sensitive and increase competitive pressures when:
Buyers earn low profits or low income.
The product represents a significant fraction of their purchases.
Competitive pressures from buyers decrease and become a weaker force under the opposite conditions. Return to slide.<br>
55
Illustration Capsule 3.2: Comparative Market Positions of Selected Firms in the Pizza Chain Industry: A Strategic Group Map Example, Text Alternative Return to slide. A four-by-four grid is displayed. The vertical axis, labeled “Price/Service/ Restaurant ambiance,” is labeled “Low” at its base and “High” at its top. The horizontal axis, “Geographic Coverage,” is labeled “High” at left, “Moderate” at the axis midpoint, and “Low” at right.
Circles labeled with the names of pizza chain firms are placed throughout the grid. One strategic group with members of varying levels of Price/Service/ Ambiance is clustered at the left of Geographic Coverage, meaning they have a large geographic region covered. This group consists of Pizza Hut, Papa John’s, Dominos, and Little Caesar’s.
A second strategic group is generally located at the midpoint of Geographic Coverage with no firm in the group reaching the upper area of the Price/Service/ambiance scale. This group consists of Cici’s, Hungry Howie’s, and Sbarro.
A third group is high in price, service, and ambiance, and low in coverage. This group consists of California Pizza Kitchen and Mellow Mushroom.
The sizes of the labeled circles are roughly proportional to the sizes of the rival chains based on revenues. The proportional sizes of firms within all groups (based on revenues) varies from large to small. Return to slide.<br>
Circles labeled with the names of pizza chain firms are placed throughout the grid. One strategic group with members of varying levels of Price/Service/ Ambiance is clustered at the left of Geographic Coverage, meaning they have a large geographic region covered. This group consists of Pizza Hut, Papa John’s, Dominos, and Little Caesar’s.
A second strategic group is generally located at the midpoint of Geographic Coverage with no firm in the group reaching the upper area of the Price/Service/ambiance scale. This group consists of Cici’s, Hungry Howie’s, and Sbarro.
A third group is high in price, service, and ambiance, and low in coverage. This group consists of California Pizza Kitchen and Mellow Mushroom.
The sizes of the labeled circles are roughly proportional to the sizes of the rival chains based on revenues. The proportional sizes of firms within all groups (based on revenues) varies from large to small. Return to slide.<br>
56
Figure 3.10: The SOAR Framework for Competitor Analysis, Text Alternative Return to the slide. There are four indicators of a rival’s likely strategic moves and countermoves.
Strategy. How the rival company is competing currently.
Resources and Capabilities. The rival’s key strengths and weaknesses.
Objectives. The rival’s strategic and performance objectives.
Assumptions. What the rival believes about itself and the industry. Return to slide.<br>
Strategy. How the rival company is competing currently.
Resources and Capabilities. The rival’s key strengths and weaknesses.
Objectives. The rival’s strategic and performance objectives.
Assumptions. What the rival believes about itself and the industry. Return to slide.<br>