
Chapter 5: Net present value and other investment






Description: Chapter 5: Net present value and other investment rules Corporate Finance Outline 1. Net present value (NPV) 2. The payback period method 3. The discounted payback period method 4. The Internal rate of return (IRR) 5. The profitability
Related Topics
Download Presentation
"Chapter 5: Net present value and other investment" is the property of its rightful owner. Permission is granted to download and print the materials on this website for personal, non-commercial use only, and to display it on your personal computer provided you do not modify the materials and that you retain all copyright notices contained in the materials. By downloading content from our website, you accept the terms of this agreement.
Presentation Transcript
slide1. Chapter 5: Net present value and other investment rules Corporate Finance<br>
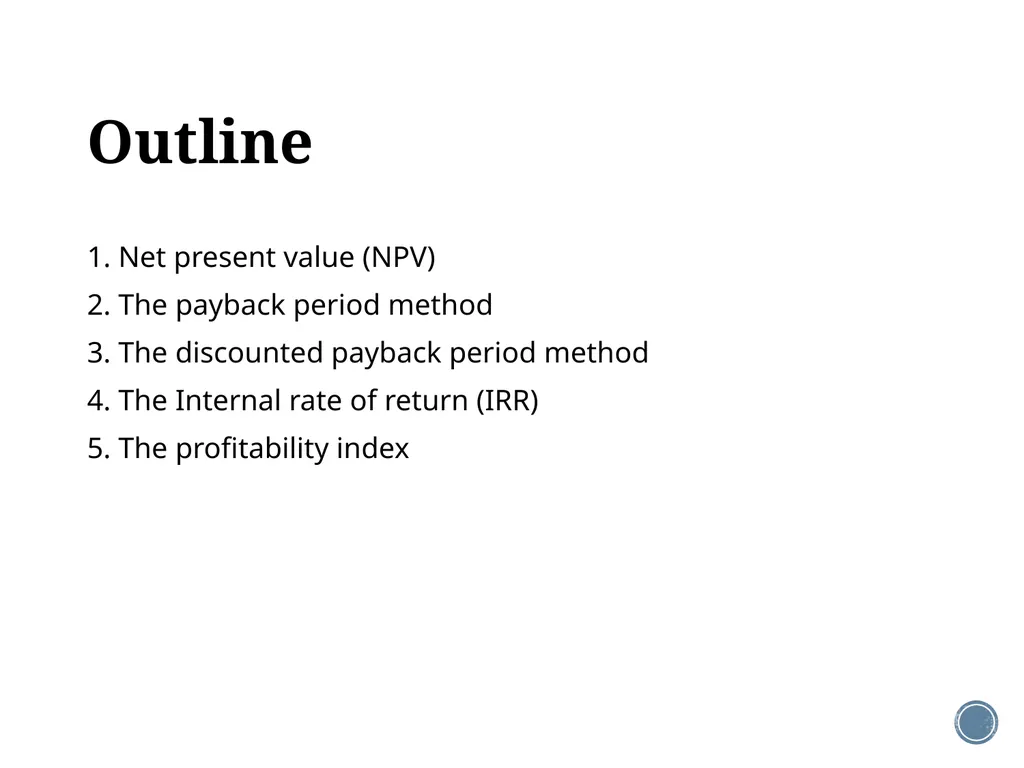
slide2. Outline 1. Net present value (NPV)
2. The payback period method
3. The discounted payback period method
4. The Internal rate of return (IRR)
5. The profitability index<br>
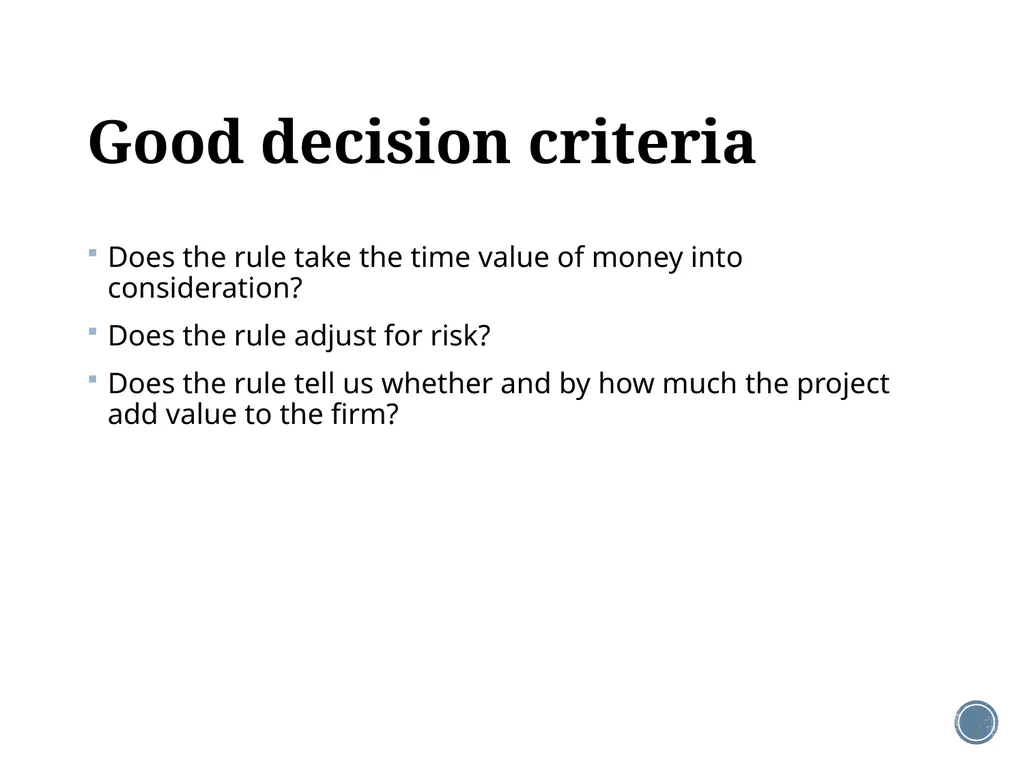
slide3. Good decision criteria Does the rule take the time value of money into consideration?
Does the rule adjust for risk?
Does the rule tell us whether and by how much the project add value to the firm?<br>
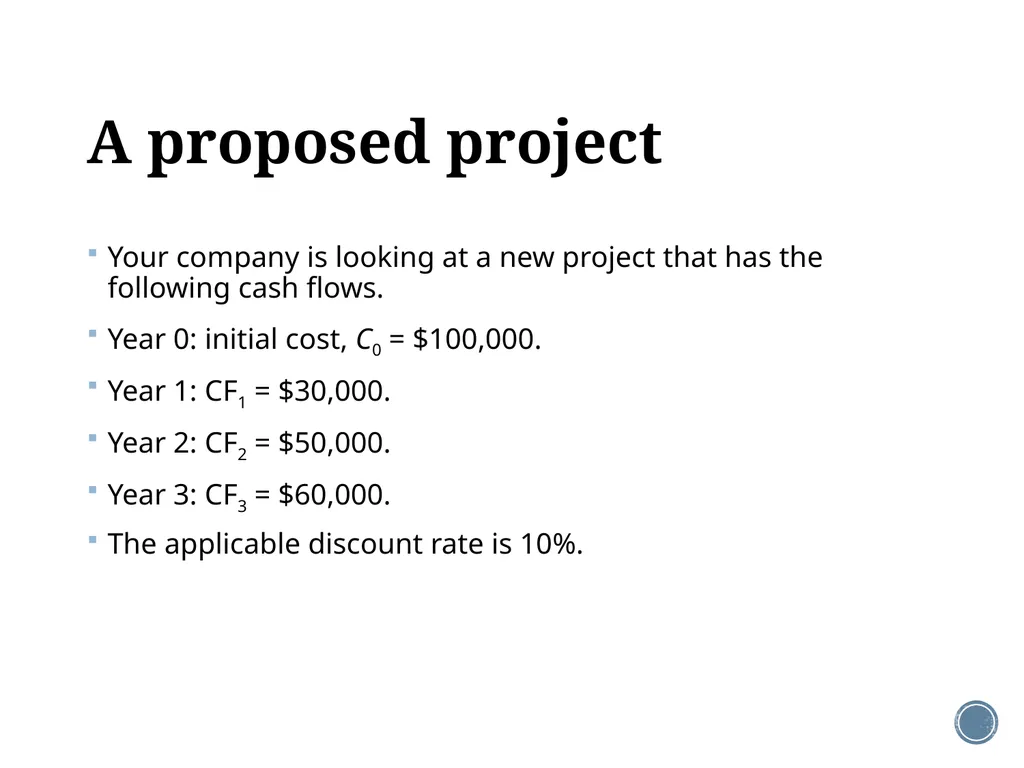
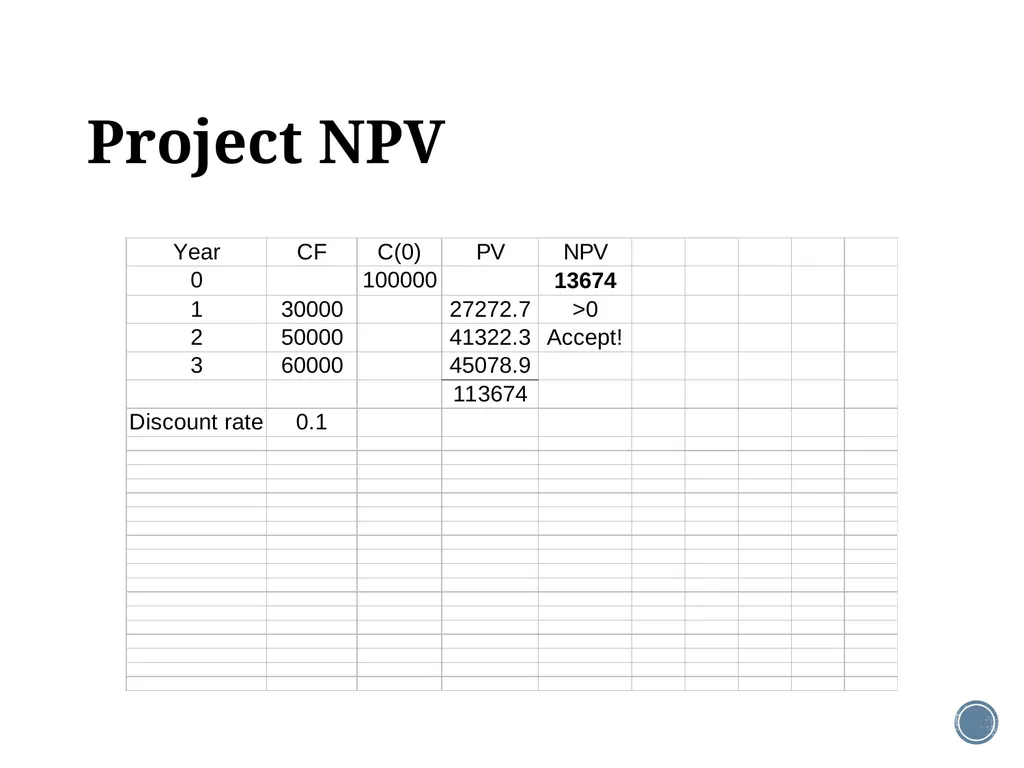
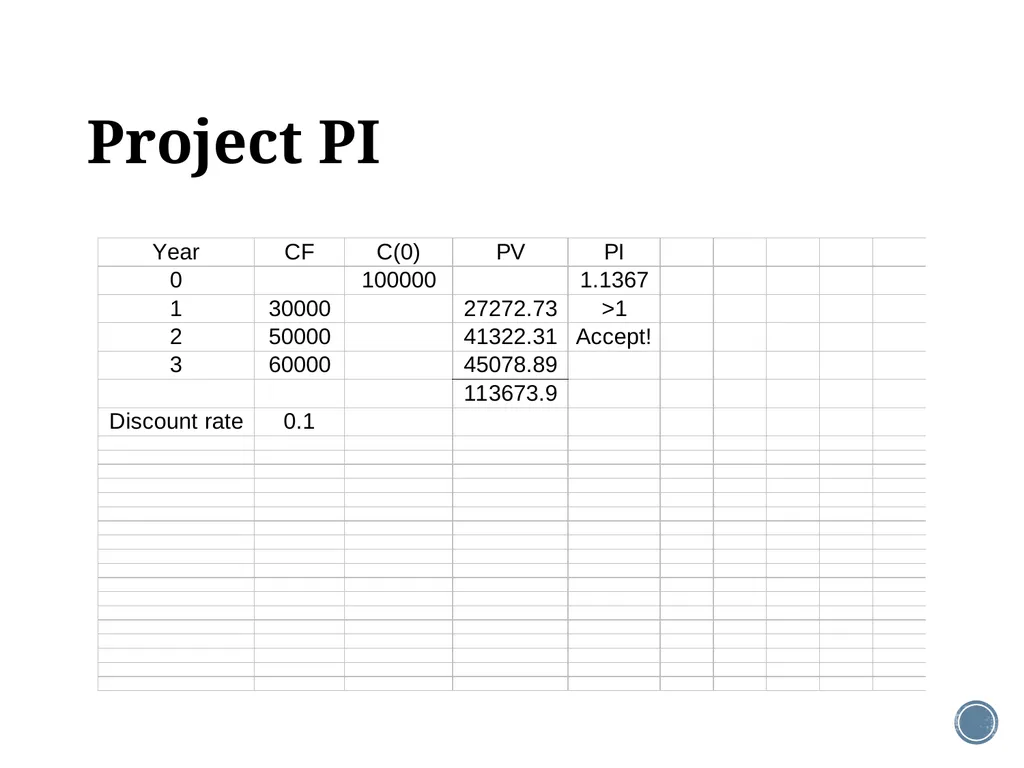
slide4. A proposed project Your company is looking at a new project that has the following cash flows.
Year 0: initial cost, C0 = $100,000.
Year 1: CF1 = $30,000.
Year 2: CF2 = $50,000.
Year 3: CF3 = $60,000.
The applicable discount rate is 10%.<br>
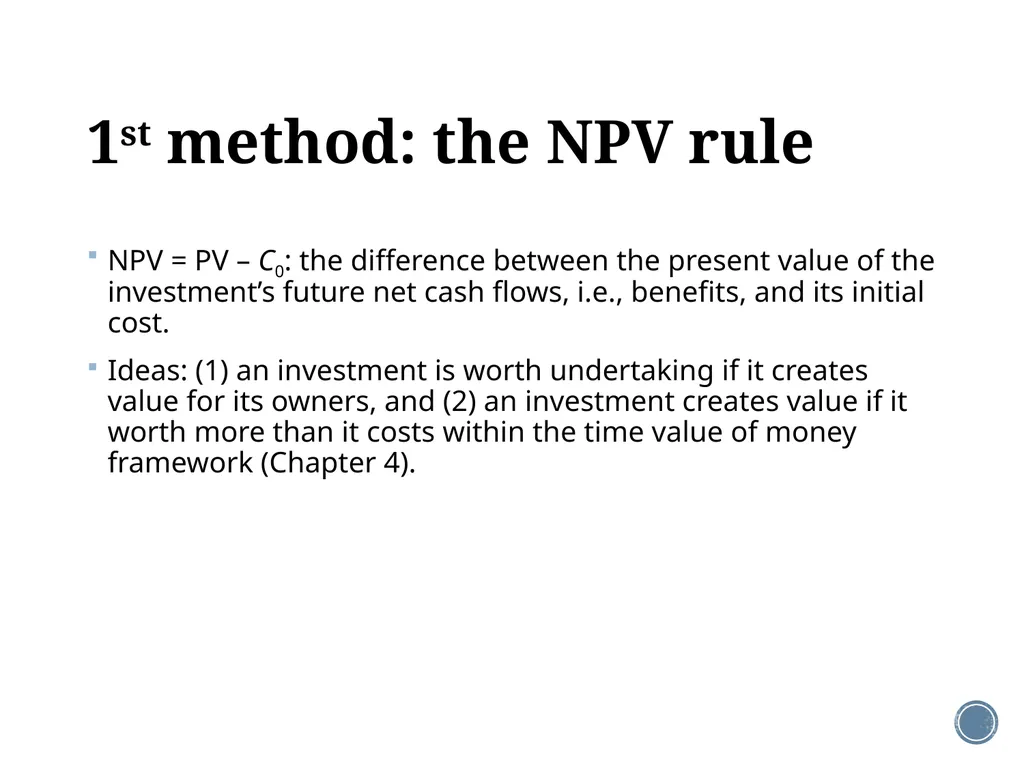
slide5. 1st method: the NPV rule NPV = PV – C0: the difference between the present value of the investment’s future net cash flows, i.e., benefits, and its initial cost.
Ideas: (1) an investment is worth undertaking if it creates value for its owners, and (2) an investment creates value if it worth more than it costs within the time value of money framework (Chapter 4).<br>
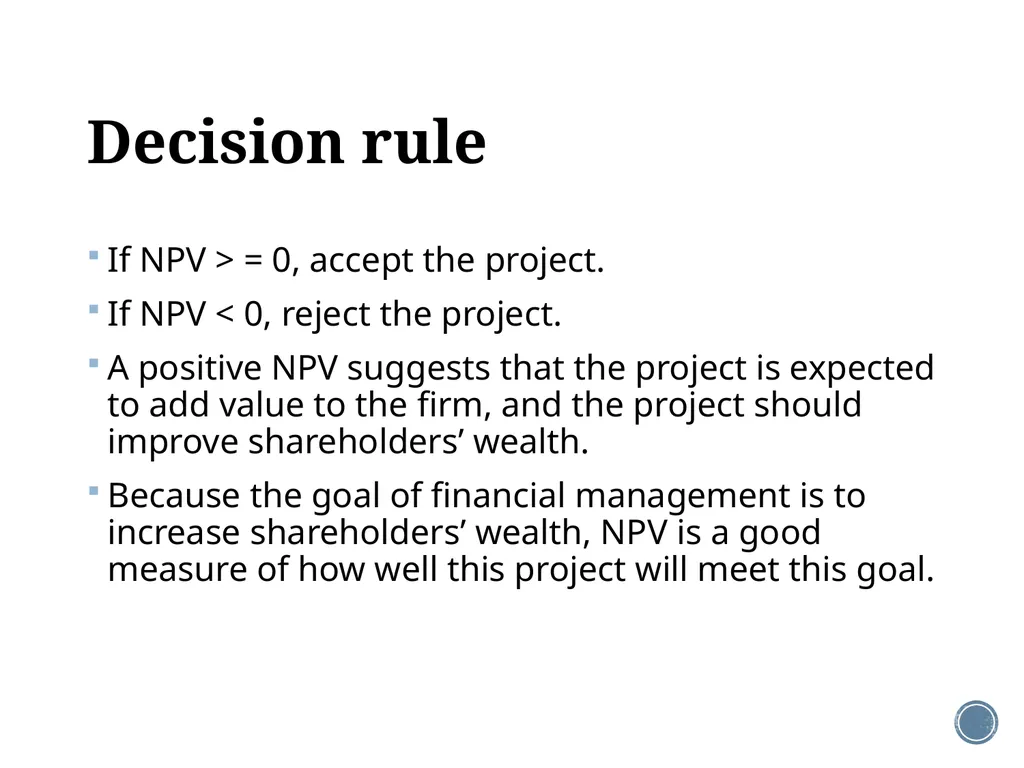
slide6. Decision rule If NPV > = 0, accept the project.
If NPV < 0, reject the project.
A positive NPV suggests that the project is expected to add value to the firm, and the project should improve shareholders’ wealth.
Because the goal of financial management is to increase shareholders’ wealth, NPV is a good measure of how well this project will meet this goal.<br>
slide7. Project NPV<br>
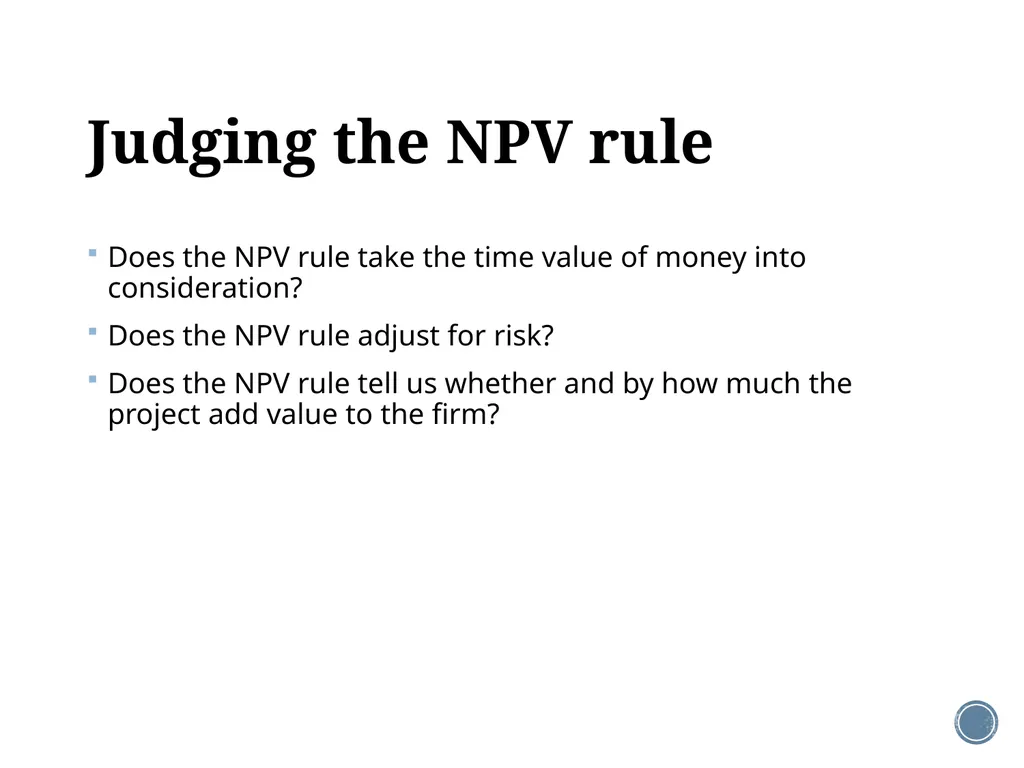
slide8. Judging the NPV rule Does the NPV rule take the time value of money into consideration?
Does the NPV rule adjust for risk?
Does the NPV rule tell us whether and by how much the project add value to the firm?<br>
slide9. Finally, they listen CFOs are using what academics consider better measures in their capital-budgeting analysis. According to a recent survey, more than 85 percent say they use net present value (NPV) analysis in at least three out of four decisions…."Finance textbooks have taught for years that NPV is superior, but this is the first known survey to show it's the preferred tool," says co-author Patricia A. Ryan, a professor of corporate finance at Colorado State University.
Source: CFO.com.<br>
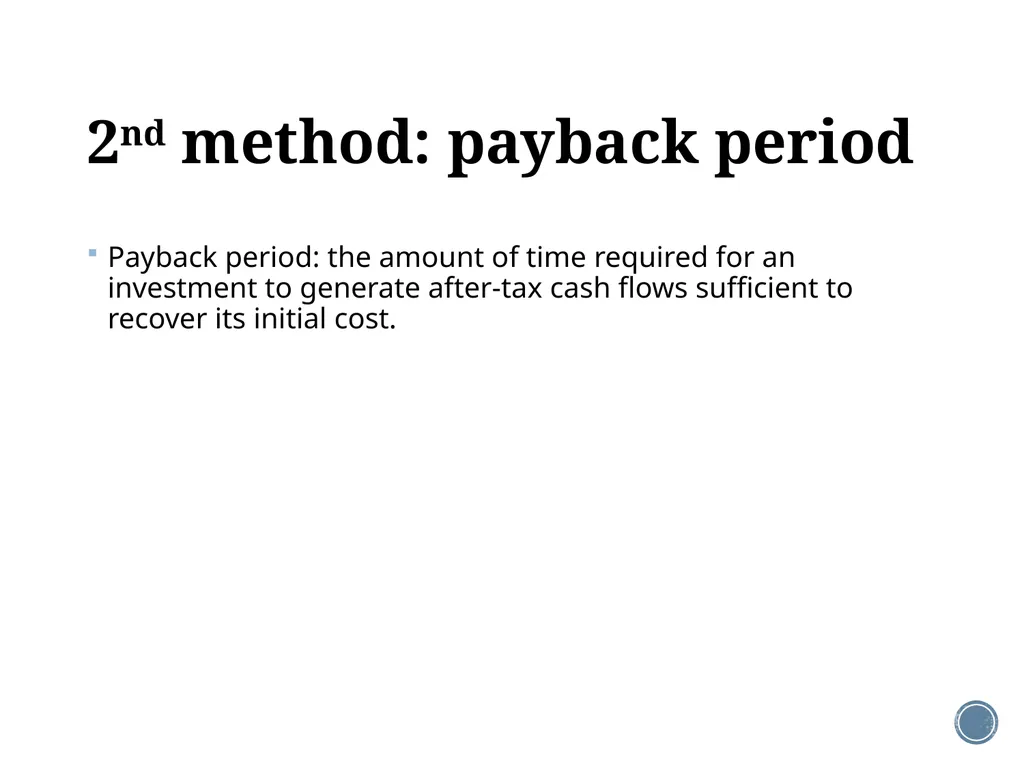
slide10. 2nd method: payback period Payback period: the amount of time required for an investment to generate after-tax cash flows sufficient to recover its initial cost.<br>
slide11. Decision rule An investment is accepted (rejected), if payback period < (>) some specified number of time period.
The cutoff is arbitrarily chosen by the manager or the entrepreneur.<br>
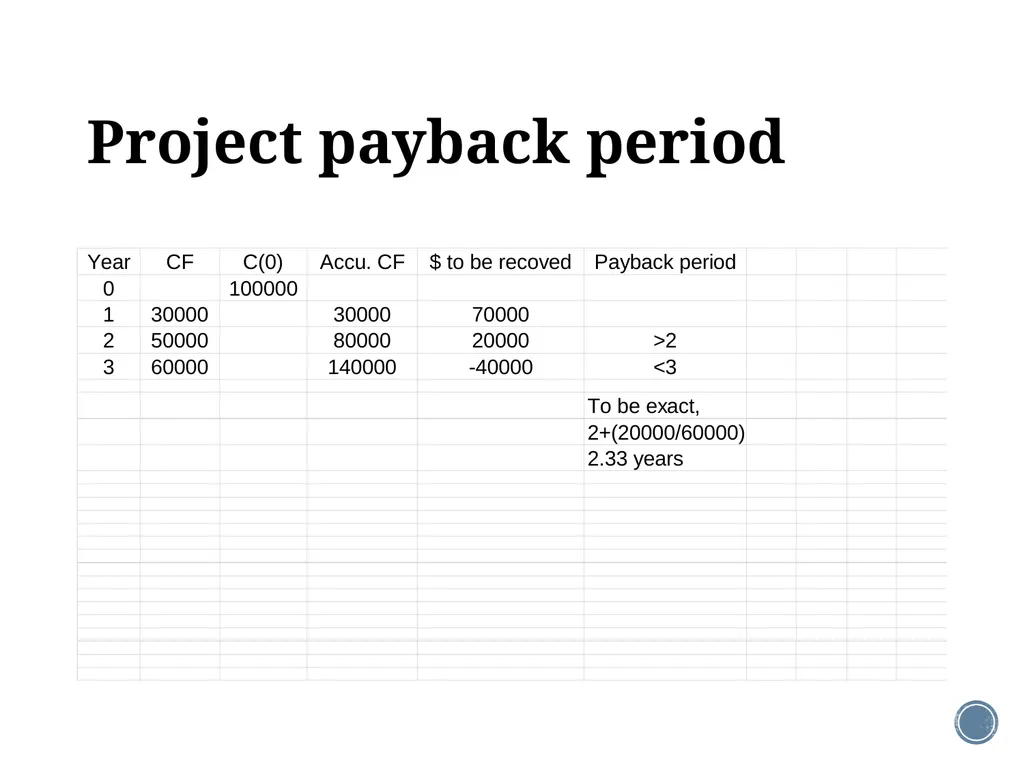
slide12. Project payback period<br>
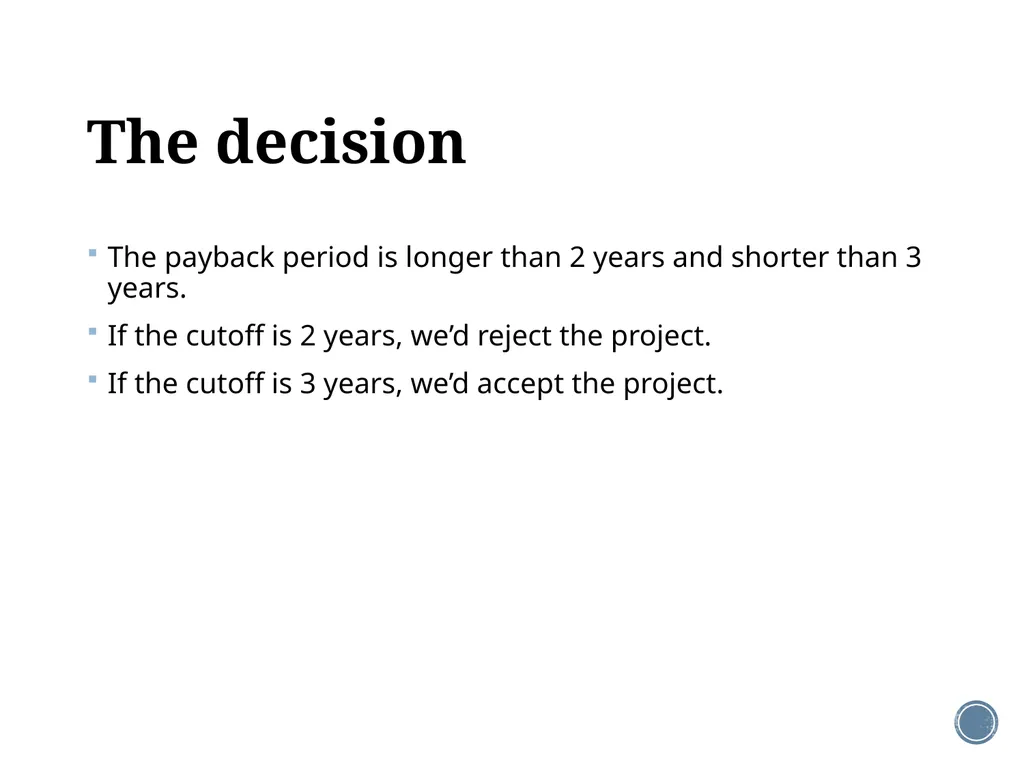
slide13. The decision The payback period is longer than 2 years and shorter than 3 years.
If the cutoff is 2 years, we’d reject the project.
If the cutoff is 3 years, we’d accept the project.<br>
slide14. Judging the payback period rule Does the payback period rule take the time value of money into consideration?
Does the payback period rule adjust for risk?
Does the payback period rule tell us whether and by how much the project add value to the firm?<br>
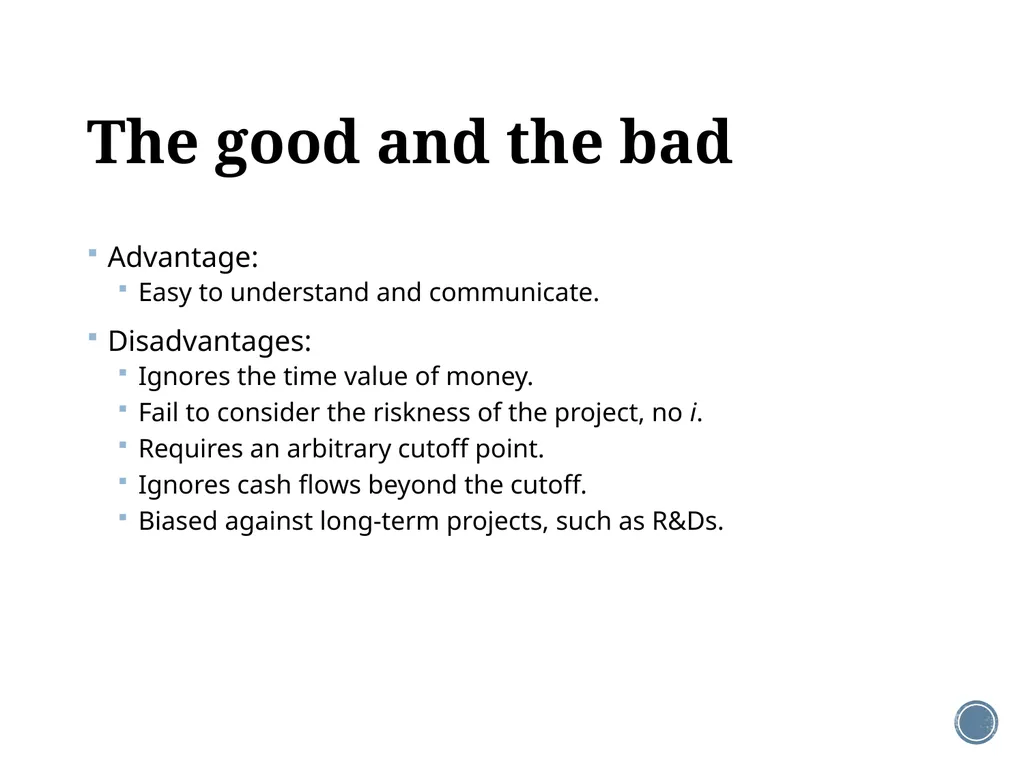
slide15. The good and the bad Advantage:
Easy to understand and communicate.
Disadvantages:
Ignores the time value of money.
Fail to consider the riskness of the project, no i.
Requires an arbitrary cutoff point.
Ignores cash flows beyond the cutoff.
Biased against long-term projects, such as R&Ds.<br>
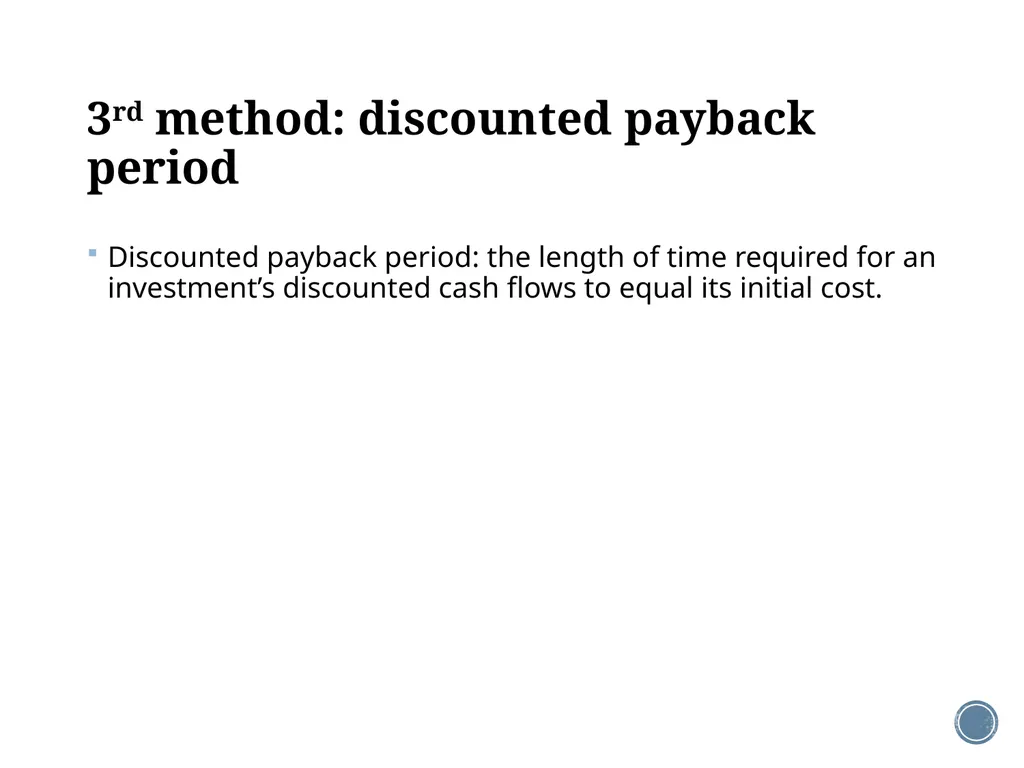
slide16. 3rd method: discounted payback period Discounted payback period: the length of time required for an investment’s discounted cash flows to equal its initial cost.<br>
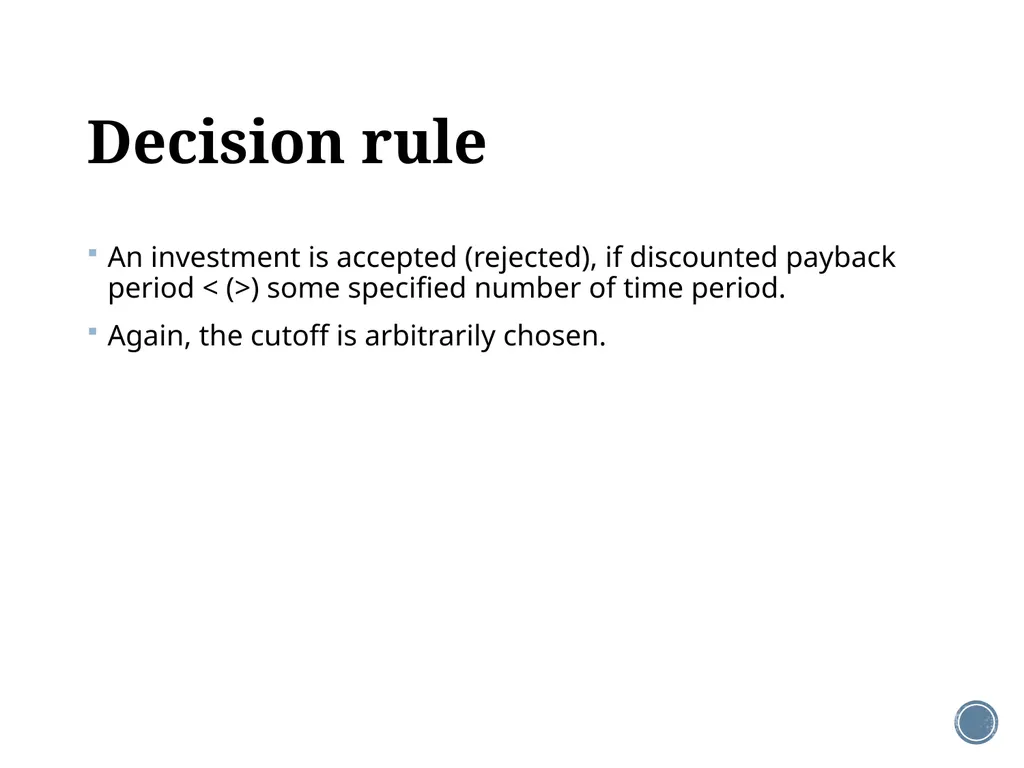
slide17. Decision rule An investment is accepted (rejected), if discounted payback period < (>) some specified number of time period.
Again, the cutoff is arbitrarily chosen.<br>
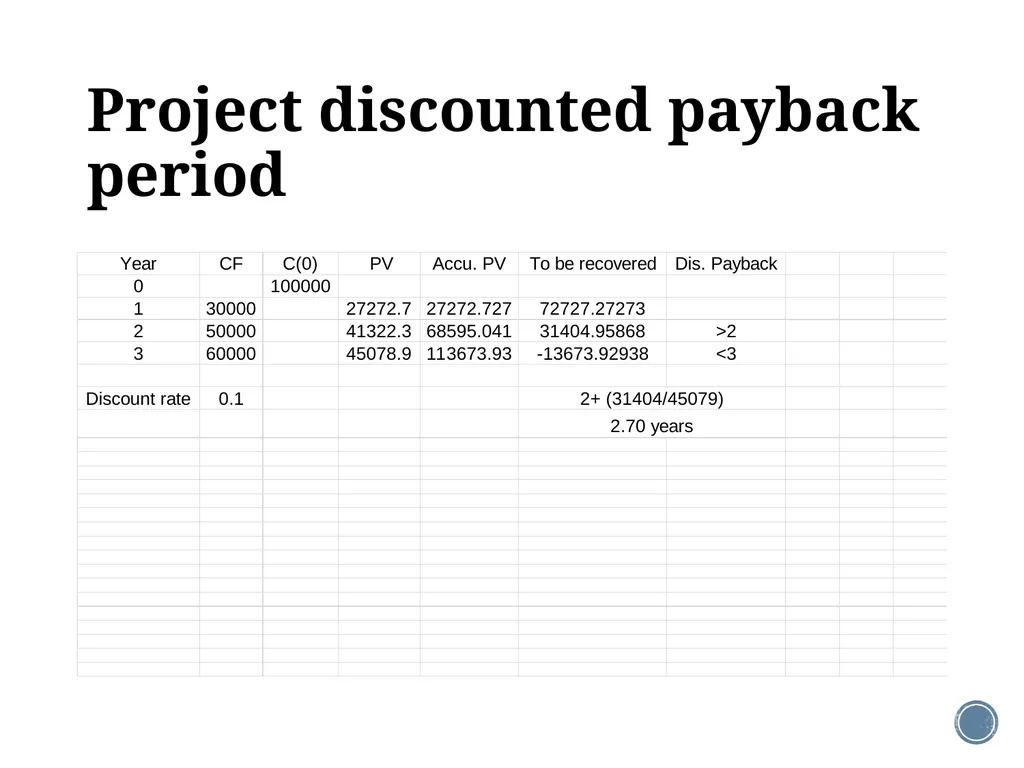
slide18. Project discounted payback period<br>
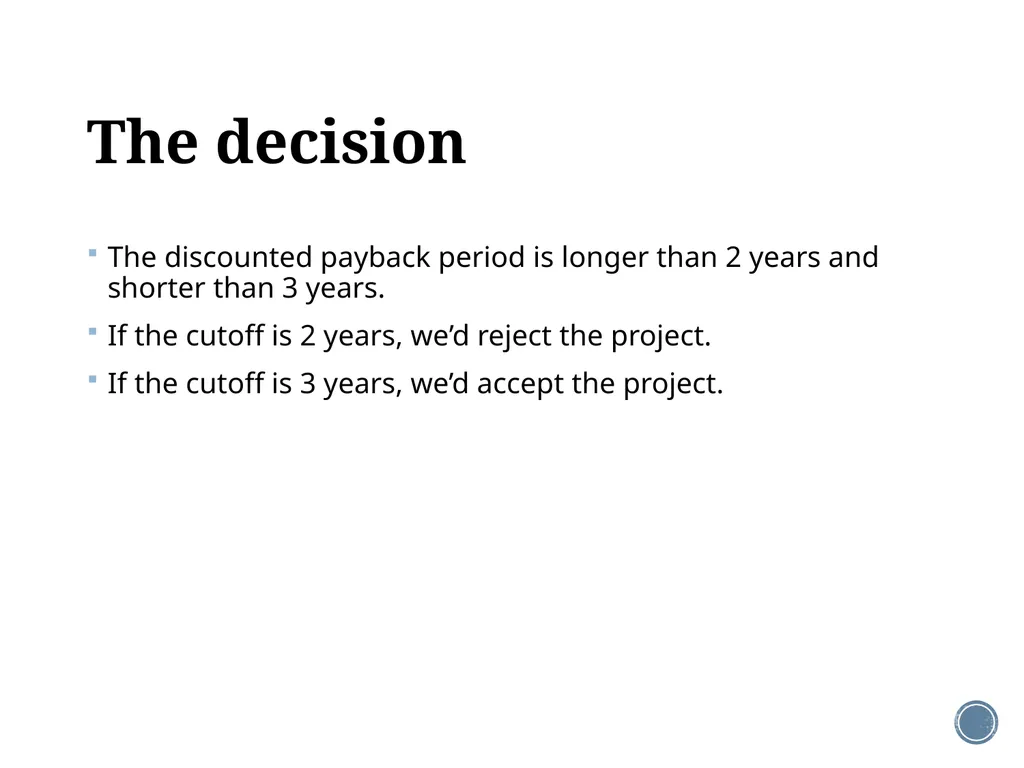
slide19. The decision The discounted payback period is longer than 2 years and shorter than 3 years.
If the cutoff is 2 years, we’d reject the project.
If the cutoff is 3 years, we’d accept the project.<br>
slide20. Judging discounted payback period Does the payback period rule take the time value of money into consideration?
Does the payback period rule adjust for risk?
Does the payback period rule tell us whether and by how much the project add value to the firm?<br>
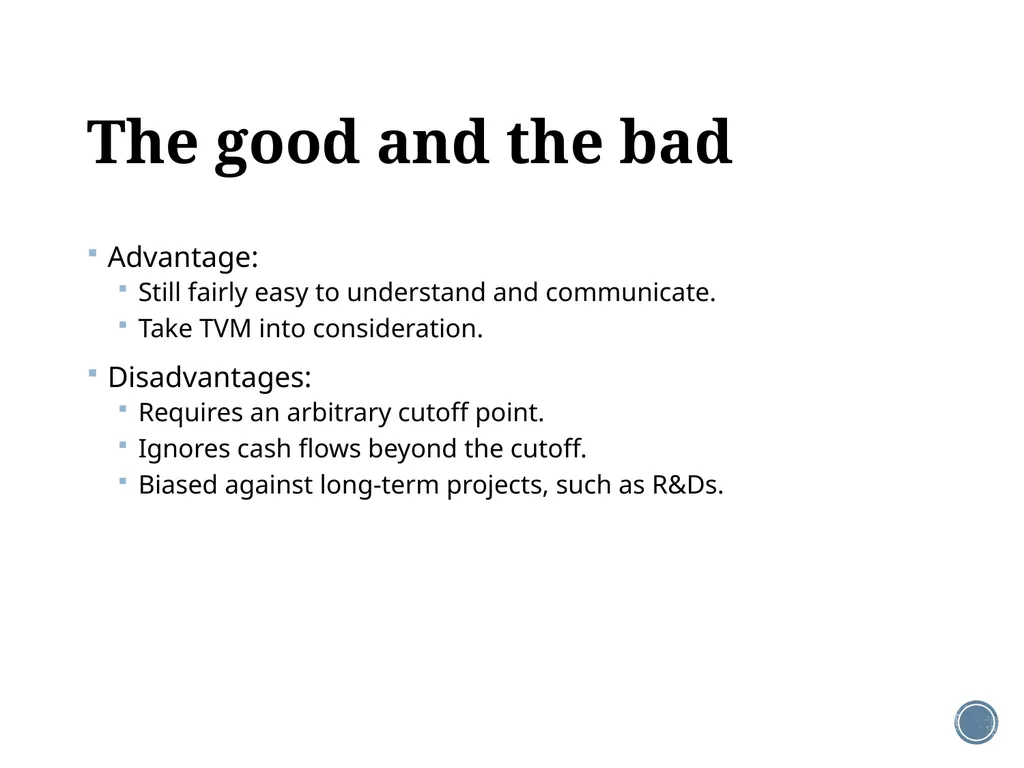
slide21. The good and the bad Advantage:
Still fairly easy to understand and communicate.
Take TVM into consideration.
Disadvantages:
Requires an arbitrary cutoff point.
Ignores cash flows beyond the cutoff.
Biased against long-term projects, such as R&Ds.<br>
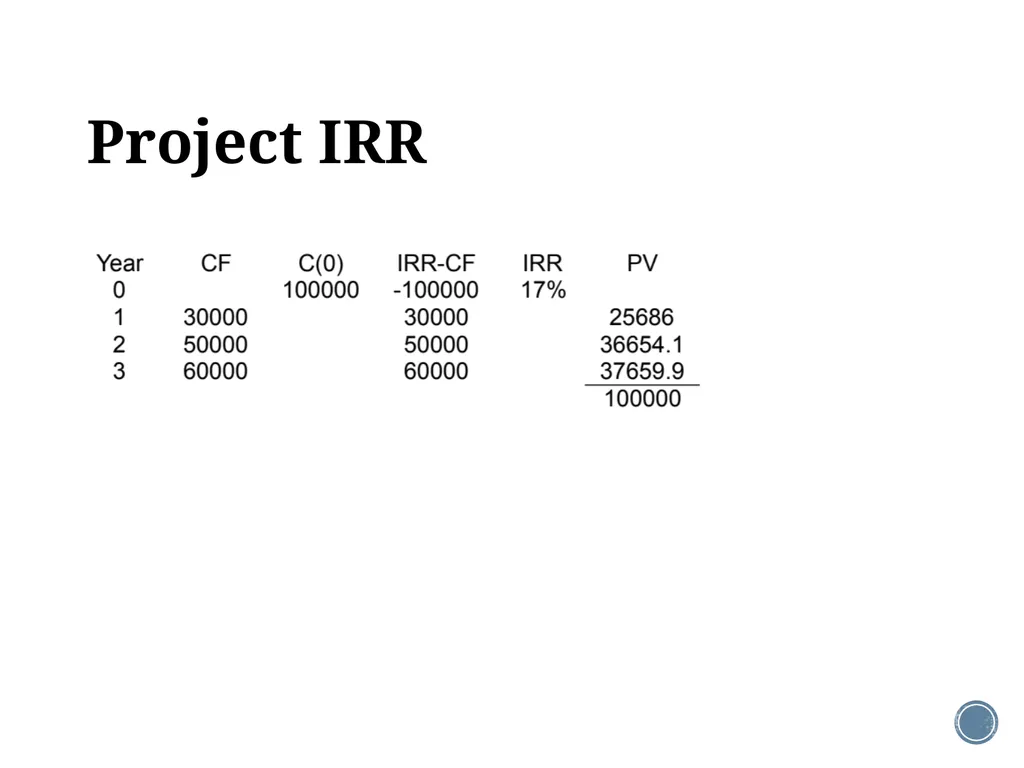
slide22. 4th method: IRR IRR (internal rate of return): the discounted rate that makes the NPV of an investment zero.<br>
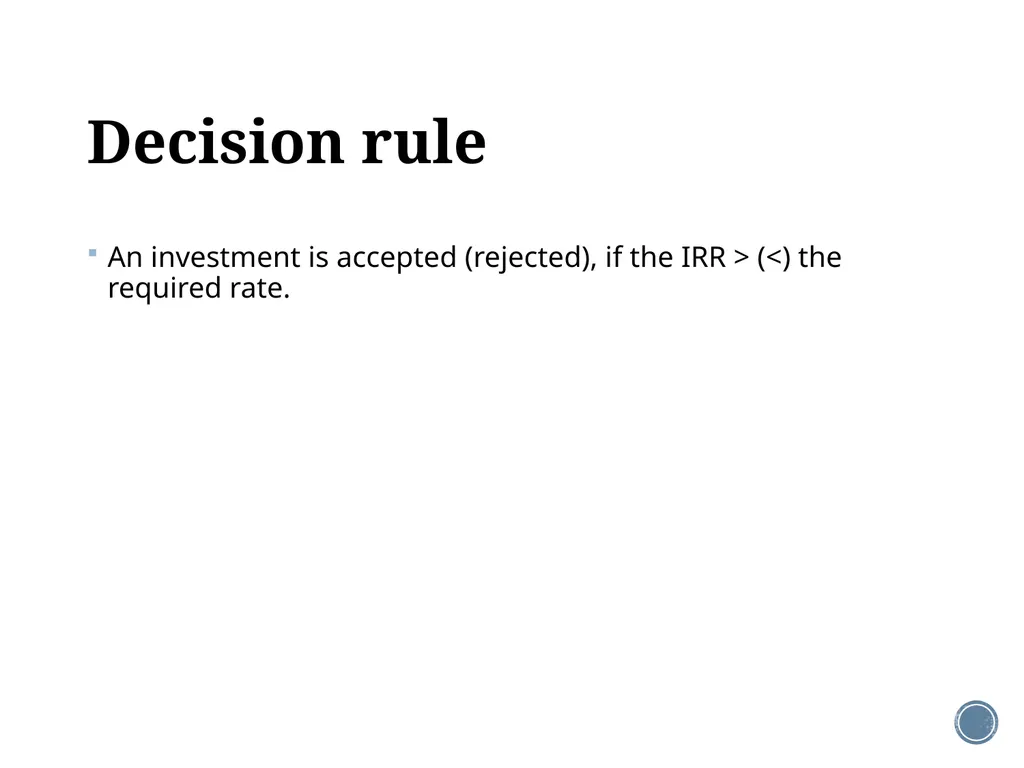
slide23. Decision rule An investment is accepted (rejected), if the IRR > (<) the required rate.<br>
slide24. Project IRR<br>
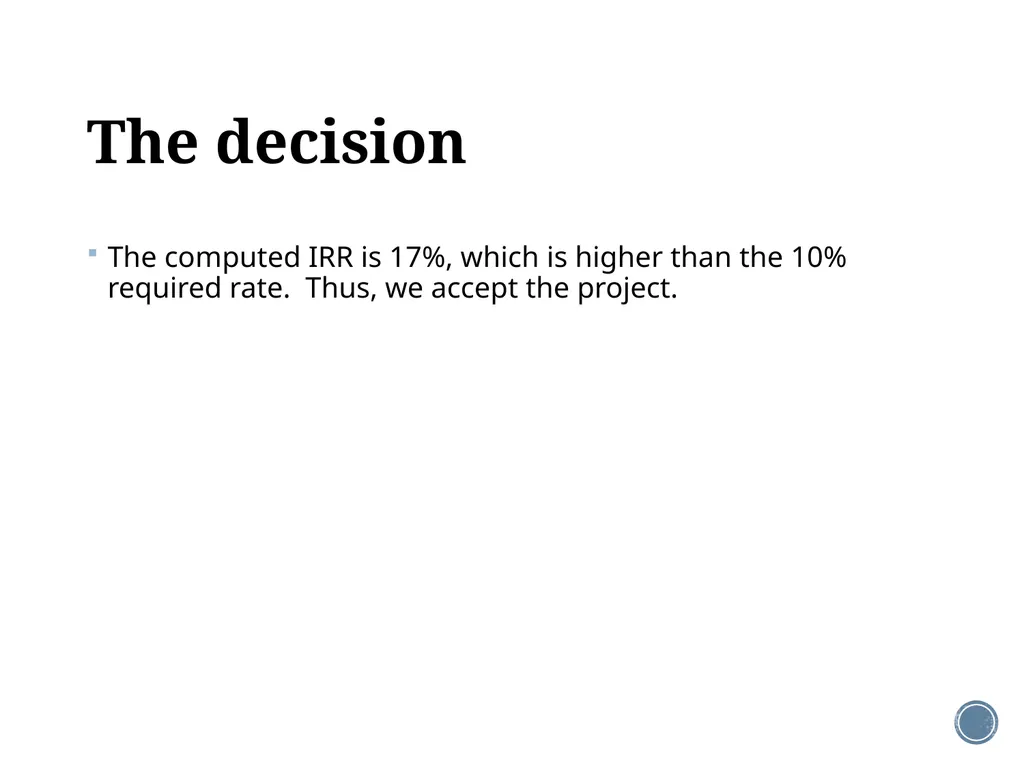
slide25. The decision The computed IRR is 17%, which is higher than the 10% required rate. Thus, we accept the project.<br>
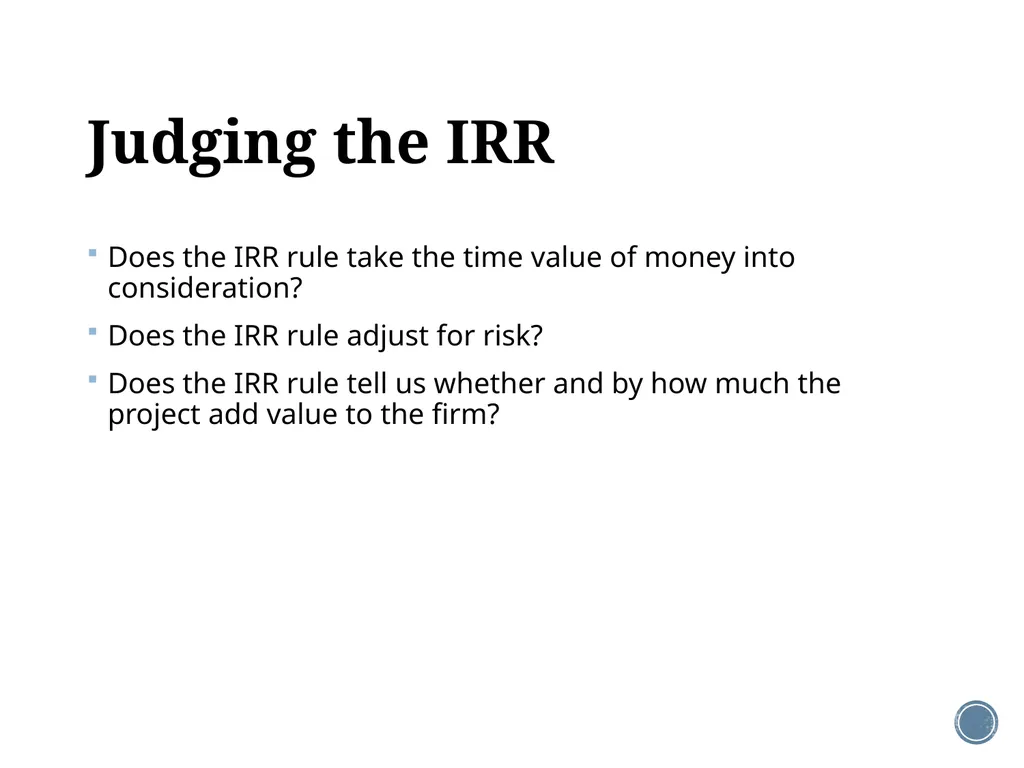
slide26. Judging the IRR Does the IRR rule take the time value of money into consideration?
Does the IRR rule adjust for risk?
Does the IRR rule tell us whether and by how much the project add value to the firm?<br>
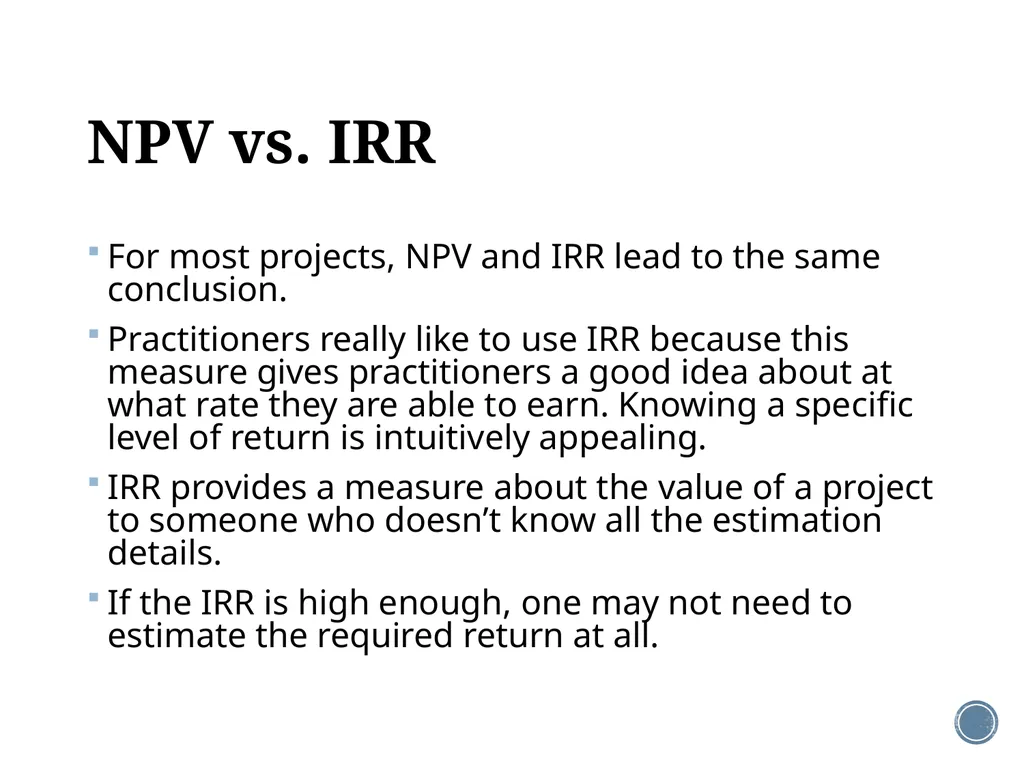
slide27. NPV vs. IRR For most projects, NPV and IRR lead to the same conclusion.
Practitioners really like to use IRR because this measure gives practitioners a good idea about at what rate they are able to earn. Knowing a specific level of return is intuitively appealing.
IRR provides a measure about the value of a project to someone who doesn’t know all the estimation details.
If the IRR is high enough, one may not need to estimate the required return at all.<br>
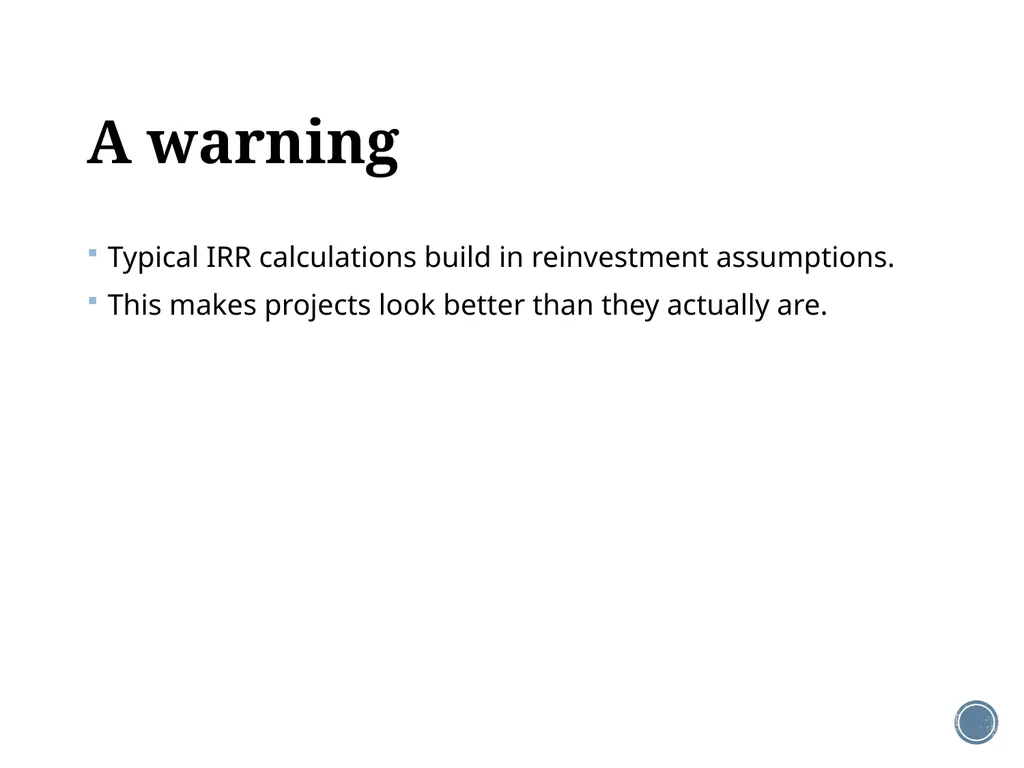
slide28. A warning Typical IRR calculations build in reinvestment assumptions.
This makes projects look better than they actually are.<br>
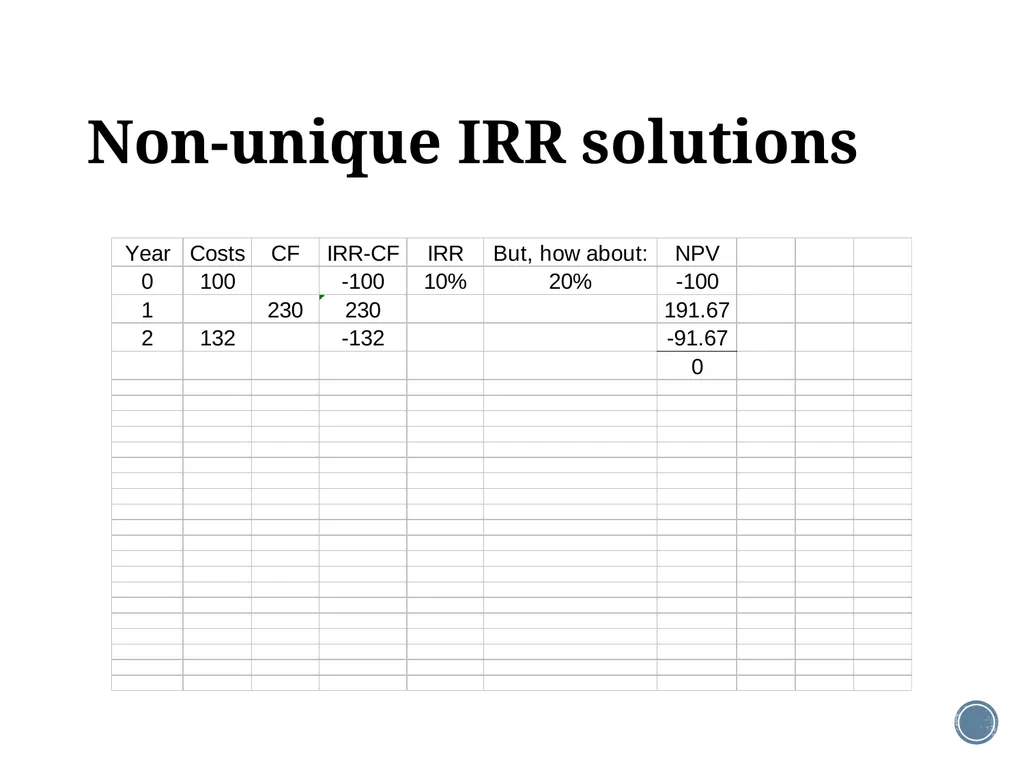
slide29. Non-unique IRR solutions<br>
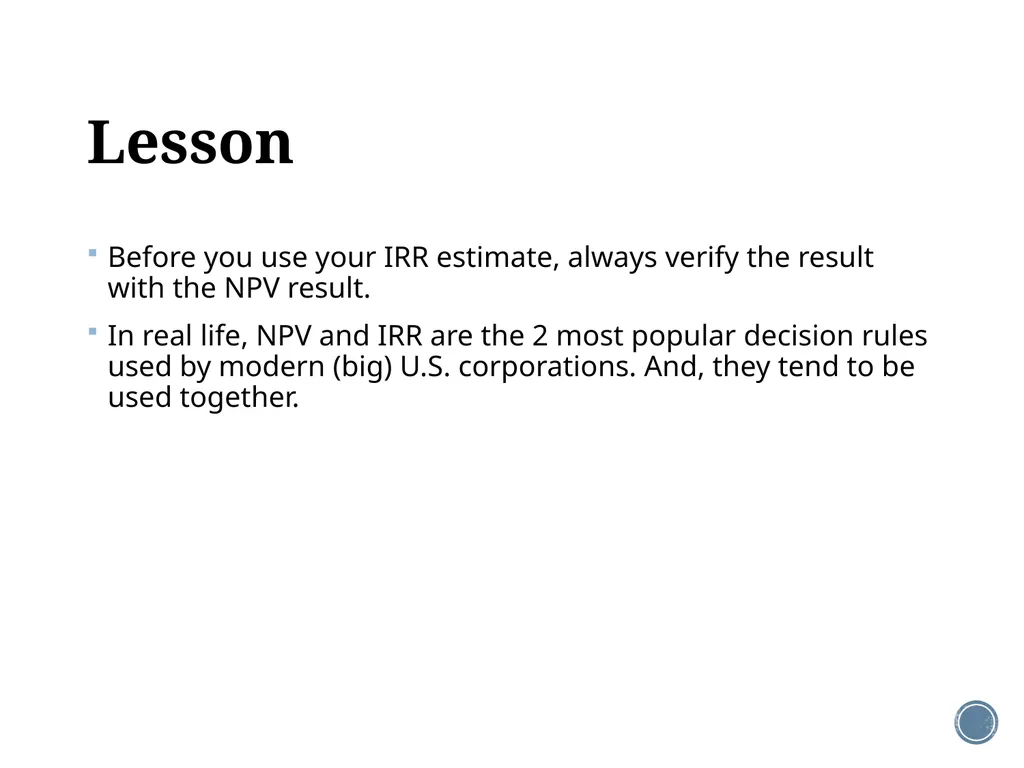
slide30. Lesson Before you use your IRR estimate, always verify the result with the NPV result.
In real life, NPV and IRR are the 2 most popular decision rules used by modern (big) U.S. corporations. And, they tend to be used together.<br>
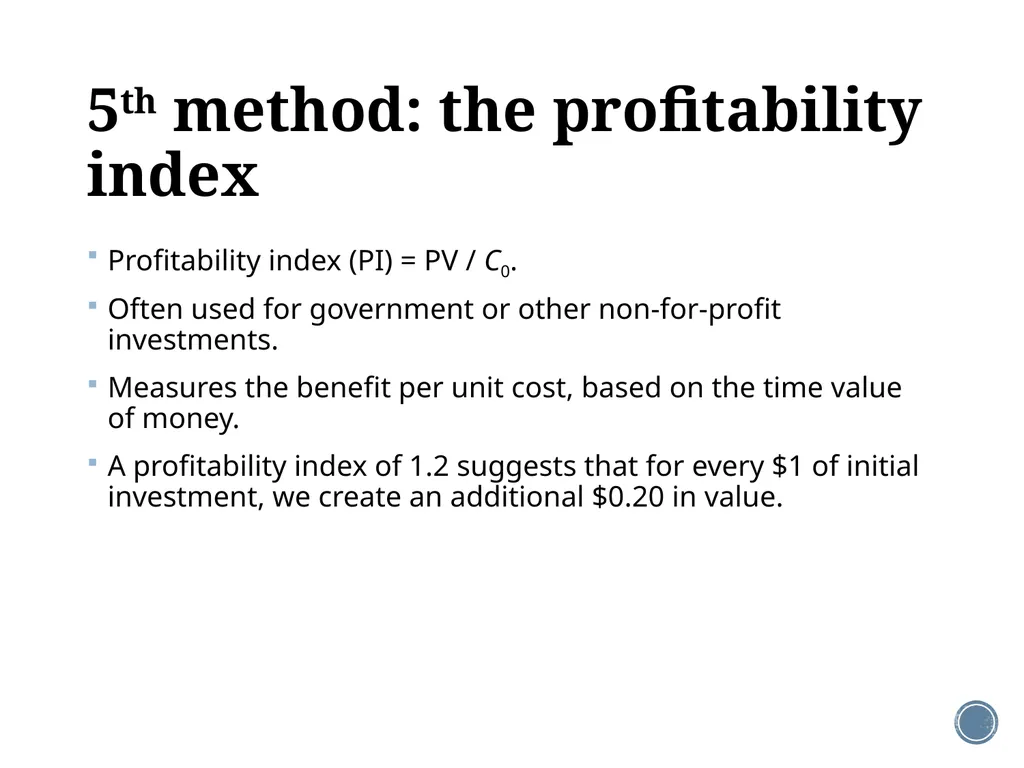
slide31. 5th method: the profitability index Profitability index (PI) = PV / C0.
Often used for government or other non-for-profit investments.
Measures the benefit per unit cost, based on the time value of money.
A profitability index of 1.2 suggests that for every $1 of initial investment, we create an additional $0.20 in value.<br>
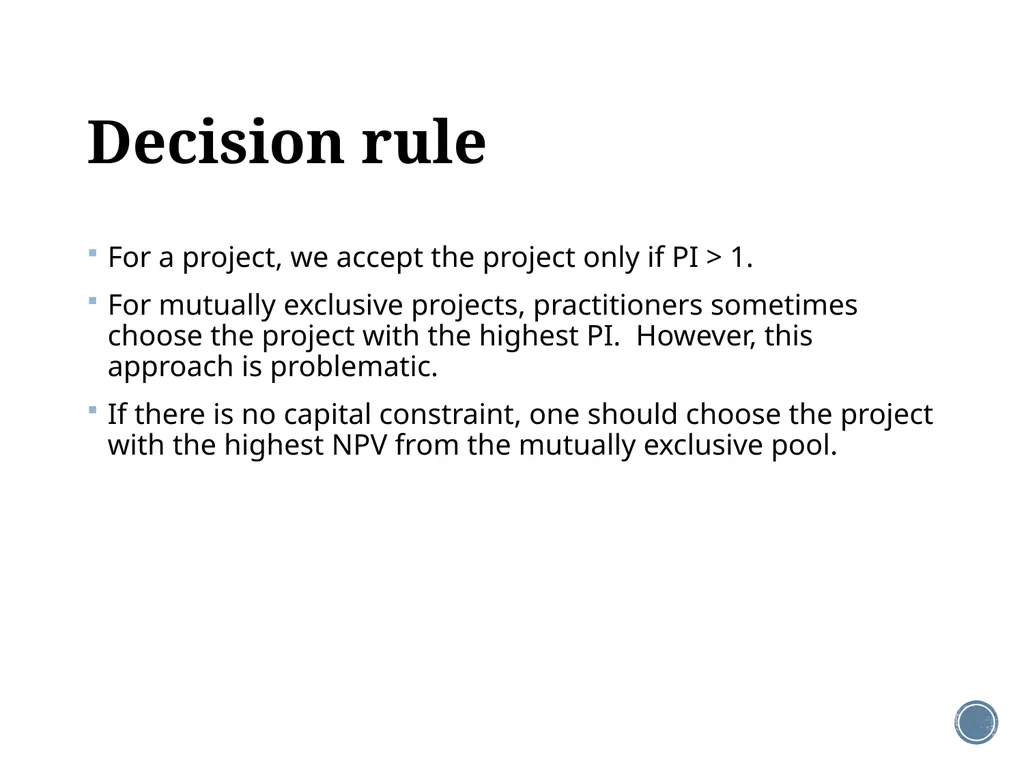
slide32. Decision rule For a project, we accept the project only if PI > 1.
For mutually exclusive projects, practitioners sometimes choose the project with the highest PI. However, this approach is problematic.
If there is no capital constraint, one should choose the project with the highest NPV from the mutually exclusive pool.<br>
slide33. Project PI<br>
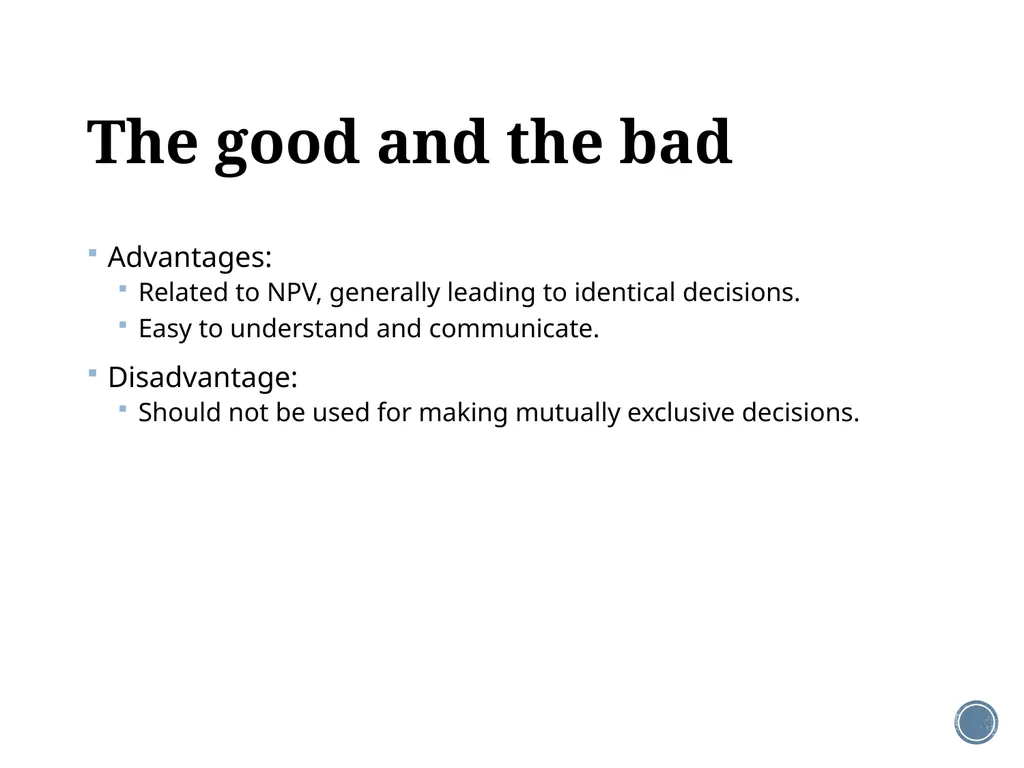
slide34. The good and the bad Advantages:
Related to NPV, generally leading to identical decisions.
Easy to understand and communicate.
Disadvantage:
Should not be used for making mutually exclusive decisions.<br>
slide35. Real options [extra] So far, you know that NPV is the best criterion; IRR is another almost equally good and important one.
But these analyses mainly address independent projects whose acceptance or rejection has no implications on the acceptance or rejection of other projects.
When projects have (real) options, NPV and IRR may perform poorly.<br>
slide36. An example: timing option Suppose that the NPV for a developer to built a building on a vacant land now is positive. The simple version of the NPV rule would lead to the conclusion that the developer should build the building now.
In real life, the developer may choose to wait. For instance, the developer may believe that this is not the best timing (although the NPV is positive). The developer may want to wait for another few years when the real estate market is stronger to realize a much larger NPV at that time.<br>
slide37. More real options In real life, there are several more types of real options that will make capital budgeting a even more complex task.
Chapter 7, pp. 218-222 has an introduction to another two types of real options: (1) the option to expand, and (2) the option to abandon.
I bet these will be treated in your intermediate corporate finance course.<br>
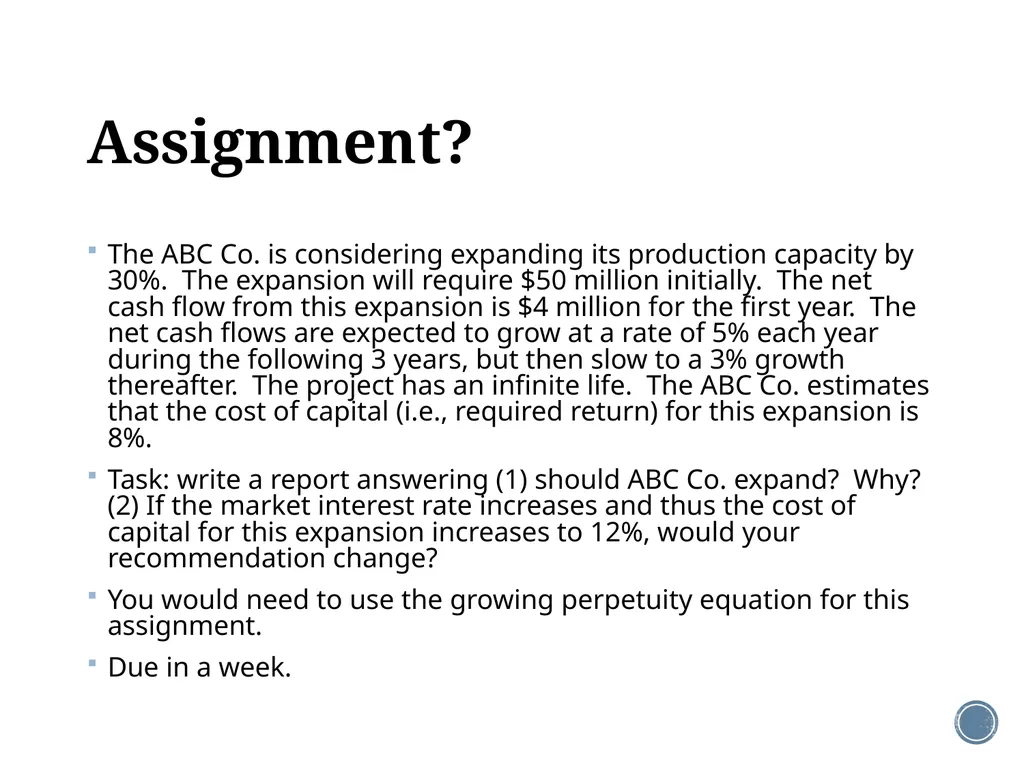
slide38. Assignment? The ABC Co. is considering expanding its production capacity by 30%. The expansion will require $50 million initially. The net cash flow from this expansion is $4 million for the first year. The net cash flows are expected to grow at a rate of 5% each year during the following 3 years, but then slow to a 3% growth thereafter. The project has an infinite life. The ABC Co. estimates that the cost of capital (i.e., required return) for this expansion is 8%.
Task: write a report answering (1) should ABC Co. expand? Why? (2) If the market interest rate increases and thus the cost of capital for this expansion increases to 12%, would your recommendation change?
You would need to use the growing perpetuity equation for this assignment.
Due in a week.<br>
slide39. Assignment? Please read “The art of capital allocation” by Pidun and Stange as a starting point and research the state of capital budgeting.
Write a report, 2-5 pages, that contains (1) a summary of the article, and (2) your research findings and reflections.
The report is due in a week.<br>
slide40. End-of-chapter Concept questions: 1-11, 13, and 14.
Questions and problems: 1-4, 7-9, 12, 14(a), 14(b), 15, 16(a), 16(b), 17, 18(a), and 18(b).<br>
slide2. Outline 1. Net present value (NPV)
2. The payback period method
3. The discounted payback period method
4. The Internal rate of return (IRR)
5. The profitability index<br>
slide3. Good decision criteria Does the rule take the time value of money into consideration?
Does the rule adjust for risk?
Does the rule tell us whether and by how much the project add value to the firm?<br>
slide4. A proposed project Your company is looking at a new project that has the following cash flows.
Year 0: initial cost, C0 = $100,000.
Year 1: CF1 = $30,000.
Year 2: CF2 = $50,000.
Year 3: CF3 = $60,000.
The applicable discount rate is 10%.<br>
slide5. 1st method: the NPV rule NPV = PV – C0: the difference between the present value of the investment’s future net cash flows, i.e., benefits, and its initial cost.
Ideas: (1) an investment is worth undertaking if it creates value for its owners, and (2) an investment creates value if it worth more than it costs within the time value of money framework (Chapter 4).<br>
slide6. Decision rule If NPV > = 0, accept the project.
If NPV < 0, reject the project.
A positive NPV suggests that the project is expected to add value to the firm, and the project should improve shareholders’ wealth.
Because the goal of financial management is to increase shareholders’ wealth, NPV is a good measure of how well this project will meet this goal.<br>
slide7. Project NPV<br>
slide8. Judging the NPV rule Does the NPV rule take the time value of money into consideration?
Does the NPV rule adjust for risk?
Does the NPV rule tell us whether and by how much the project add value to the firm?<br>
slide9. Finally, they listen CFOs are using what academics consider better measures in their capital-budgeting analysis. According to a recent survey, more than 85 percent say they use net present value (NPV) analysis in at least three out of four decisions…."Finance textbooks have taught for years that NPV is superior, but this is the first known survey to show it's the preferred tool," says co-author Patricia A. Ryan, a professor of corporate finance at Colorado State University.
Source: CFO.com.<br>
slide10. 2nd method: payback period Payback period: the amount of time required for an investment to generate after-tax cash flows sufficient to recover its initial cost.<br>
slide11. Decision rule An investment is accepted (rejected), if payback period < (>) some specified number of time period.
The cutoff is arbitrarily chosen by the manager or the entrepreneur.<br>
slide12. Project payback period<br>
slide13. The decision The payback period is longer than 2 years and shorter than 3 years.
If the cutoff is 2 years, we’d reject the project.
If the cutoff is 3 years, we’d accept the project.<br>
slide14. Judging the payback period rule Does the payback period rule take the time value of money into consideration?
Does the payback period rule adjust for risk?
Does the payback period rule tell us whether and by how much the project add value to the firm?<br>
slide15. The good and the bad Advantage:
Easy to understand and communicate.
Disadvantages:
Ignores the time value of money.
Fail to consider the riskness of the project, no i.
Requires an arbitrary cutoff point.
Ignores cash flows beyond the cutoff.
Biased against long-term projects, such as R&Ds.<br>
slide16. 3rd method: discounted payback period Discounted payback period: the length of time required for an investment’s discounted cash flows to equal its initial cost.<br>
slide17. Decision rule An investment is accepted (rejected), if discounted payback period < (>) some specified number of time period.
Again, the cutoff is arbitrarily chosen.<br>
slide18. Project discounted payback period<br>
slide19. The decision The discounted payback period is longer than 2 years and shorter than 3 years.
If the cutoff is 2 years, we’d reject the project.
If the cutoff is 3 years, we’d accept the project.<br>
slide20. Judging discounted payback period Does the payback period rule take the time value of money into consideration?
Does the payback period rule adjust for risk?
Does the payback period rule tell us whether and by how much the project add value to the firm?<br>
slide21. The good and the bad Advantage:
Still fairly easy to understand and communicate.
Take TVM into consideration.
Disadvantages:
Requires an arbitrary cutoff point.
Ignores cash flows beyond the cutoff.
Biased against long-term projects, such as R&Ds.<br>
slide22. 4th method: IRR IRR (internal rate of return): the discounted rate that makes the NPV of an investment zero.<br>
slide23. Decision rule An investment is accepted (rejected), if the IRR > (<) the required rate.<br>
slide24. Project IRR<br>
slide25. The decision The computed IRR is 17%, which is higher than the 10% required rate. Thus, we accept the project.<br>
slide26. Judging the IRR Does the IRR rule take the time value of money into consideration?
Does the IRR rule adjust for risk?
Does the IRR rule tell us whether and by how much the project add value to the firm?<br>
slide27. NPV vs. IRR For most projects, NPV and IRR lead to the same conclusion.
Practitioners really like to use IRR because this measure gives practitioners a good idea about at what rate they are able to earn. Knowing a specific level of return is intuitively appealing.
IRR provides a measure about the value of a project to someone who doesn’t know all the estimation details.
If the IRR is high enough, one may not need to estimate the required return at all.<br>
slide28. A warning Typical IRR calculations build in reinvestment assumptions.
This makes projects look better than they actually are.<br>
slide29. Non-unique IRR solutions<br>
slide30. Lesson Before you use your IRR estimate, always verify the result with the NPV result.
In real life, NPV and IRR are the 2 most popular decision rules used by modern (big) U.S. corporations. And, they tend to be used together.<br>
slide31. 5th method: the profitability index Profitability index (PI) = PV / C0.
Often used for government or other non-for-profit investments.
Measures the benefit per unit cost, based on the time value of money.
A profitability index of 1.2 suggests that for every $1 of initial investment, we create an additional $0.20 in value.<br>
slide32. Decision rule For a project, we accept the project only if PI > 1.
For mutually exclusive projects, practitioners sometimes choose the project with the highest PI. However, this approach is problematic.
If there is no capital constraint, one should choose the project with the highest NPV from the mutually exclusive pool.<br>
slide33. Project PI<br>
slide34. The good and the bad Advantages:
Related to NPV, generally leading to identical decisions.
Easy to understand and communicate.
Disadvantage:
Should not be used for making mutually exclusive decisions.<br>
slide35. Real options [extra] So far, you know that NPV is the best criterion; IRR is another almost equally good and important one.
But these analyses mainly address independent projects whose acceptance or rejection has no implications on the acceptance or rejection of other projects.
When projects have (real) options, NPV and IRR may perform poorly.<br>
slide36. An example: timing option Suppose that the NPV for a developer to built a building on a vacant land now is positive. The simple version of the NPV rule would lead to the conclusion that the developer should build the building now.
In real life, the developer may choose to wait. For instance, the developer may believe that this is not the best timing (although the NPV is positive). The developer may want to wait for another few years when the real estate market is stronger to realize a much larger NPV at that time.<br>
slide37. More real options In real life, there are several more types of real options that will make capital budgeting a even more complex task.
Chapter 7, pp. 218-222 has an introduction to another two types of real options: (1) the option to expand, and (2) the option to abandon.
I bet these will be treated in your intermediate corporate finance course.<br>
slide38. Assignment? The ABC Co. is considering expanding its production capacity by 30%. The expansion will require $50 million initially. The net cash flow from this expansion is $4 million for the first year. The net cash flows are expected to grow at a rate of 5% each year during the following 3 years, but then slow to a 3% growth thereafter. The project has an infinite life. The ABC Co. estimates that the cost of capital (i.e., required return) for this expansion is 8%.
Task: write a report answering (1) should ABC Co. expand? Why? (2) If the market interest rate increases and thus the cost of capital for this expansion increases to 12%, would your recommendation change?
You would need to use the growing perpetuity equation for this assignment.
Due in a week.<br>
slide39. Assignment? Please read “The art of capital allocation” by Pidun and Stange as a starting point and research the state of capital budgeting.
Write a report, 2-5 pages, that contains (1) a summary of the article, and (2) your research findings and reflections.
The report is due in a week.<br>
slide40. End-of-chapter Concept questions: 1-11, 13, and 14.
Questions and problems: 1-4, 7-9, 12, 14(a), 14(b), 15, 16(a), 16(b), 17, 18(a), and 18(b).<br>