
Chapter 6: Forecasting Ownership Benefits and






Description: Chapter 6: Forecasting Ownership Benefits and Value: Market Research Copyright 2013 by The McGraw-Hill Companies, Inc. All rights reserved. McGraw-HillIrwin Multiple Factors Affect Real Estate Demand Needs for access (linkages)
Related Topics
Download Presentation
"Chapter 6: Forecasting Ownership Benefits and" is the property of its rightful owner. Permission is granted to download and print the materials on this website for personal, non-commercial use only, and to display it on your personal computer provided you do not modify the materials and that you retain all copyright notices contained in the materials. By downloading content from our website, you accept the terms of this agreement.
Presentation Transcript
slide1. Chapter 6: Forecasting Ownership Benefits and Value: Market Research Copyright © 2013 by The McGraw-Hill Companies, Inc. All rights reserved. McGraw-Hill/Irwin<br>
slide2. Multiple Factors Affect Real Estate Demand Needs for access (“linkages”)
“location, location, and location”
Non-locational factors
Housing (style, design, size; financing available)
Commercial (tenant mix and character; parking facilities)
Offices (style, design, floor plate size; amenities and services; electrical and communications service) 6-2<br>
slide3. Market Segmentation Market segmentation: Differences in preferences or needs among market subgroups
Implication of market segmentation: Market research must focus on relevant market segments
Corollary 1: Most real estate data is irrelevant in studying any particular property
Corollary 2: Most important data for a particular market segment may not be readily available 6-3<br>
slide4. Challenges Posed by Market Segmentation Market segmentation is an empirical notion:
Cannot be described without investigating first
Important facts of segmentation may vary with location and property type
Research process must recognize this challenge
No simple, universal procedure 6-4<br>
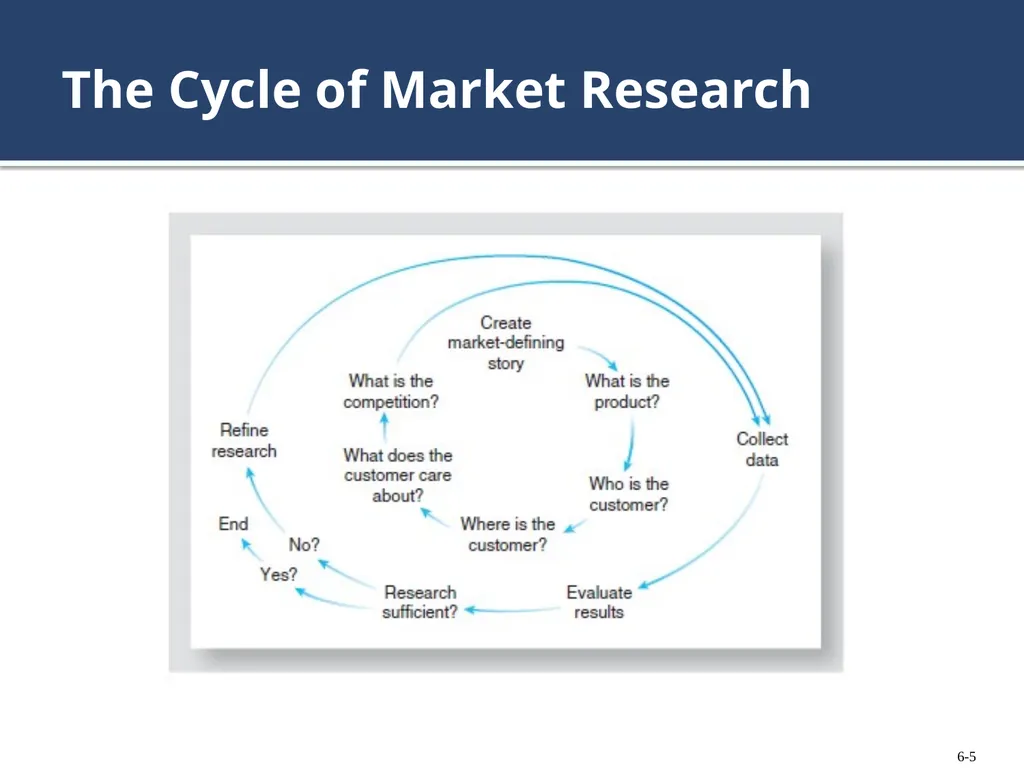
slide5. The Cycle of Market Research 6-5<br>
slide6. Writing a Market Story All market research is someone’s particular story (Best to write down the assumptions of the story)
Clues about market segments can come from industry literature (ex: Urban Land Institute)
Initial collection of data should depend on the assumptions about segmentation
Object: Estimate critical market parameters (rental rates, sales projections, etc.) 6-6<br>
slide7. Writing a Market Story (continued) First analysis
What range of critical parameters are implied by data?
Range narrow enough to be useful?
Refinement necessary?
Refining the research
What factors affect critical parameters the most?
What information illuminates those factors? 6-7<br>
slide8. Story Approach vs. Conventional Market Research Story approach begins with property and its market segments, and then builds links to larger economy
Conventional approach goes from the state of the world, to the nation, to the state, and then to the city, and finally to the property 6-8<br>
slide9. Three Examples of Property Market Research Elysian Forest – planned unit development
Palm Grove – proposed office building
Plane Vista – proposed apartment expansion
Why look only at development projects?
No difference in market analysis questions between existing and proposed properties
Much more market information for existing properties
Therefore, critical parameters should be clearer for existing properties
Development projects demonstrate more of the challenging data issues 6-9<br>
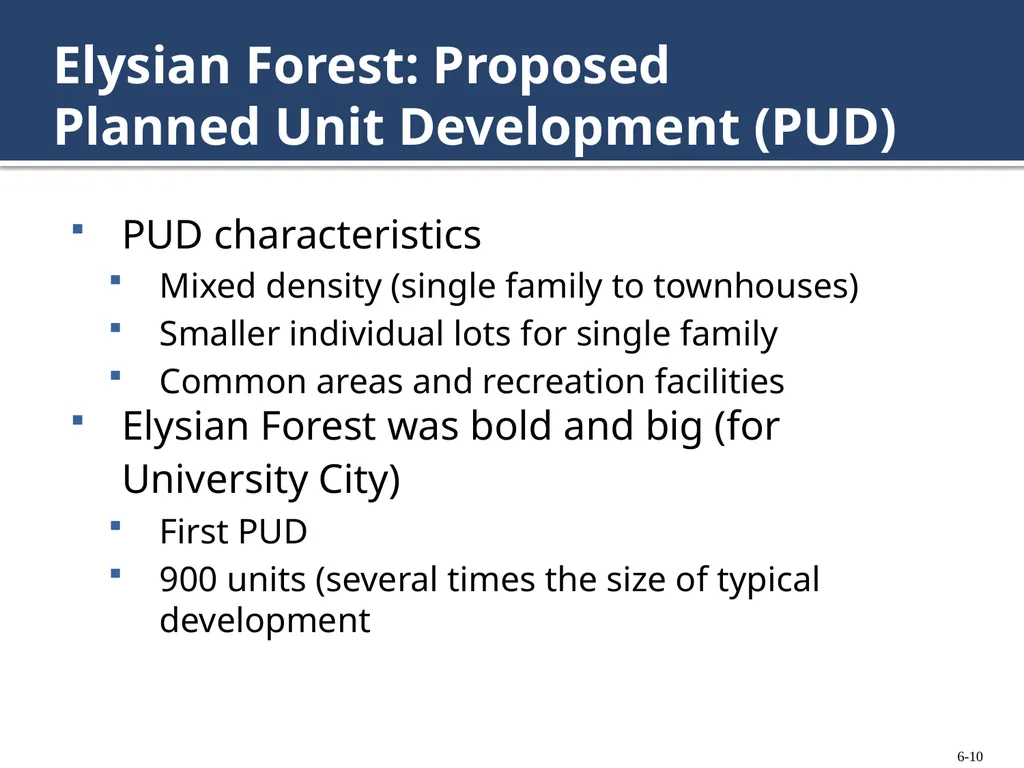
slide10. Elysian Forest: Proposed Planned Unit Development (PUD) PUD characteristics
Mixed density (single family to townhouses)
Smaller individual lots for single family
Common areas and recreation facilities
Elysian Forest was bold and big (for University City)
First PUD
900 units (several times the size of typical development 6-10<br>
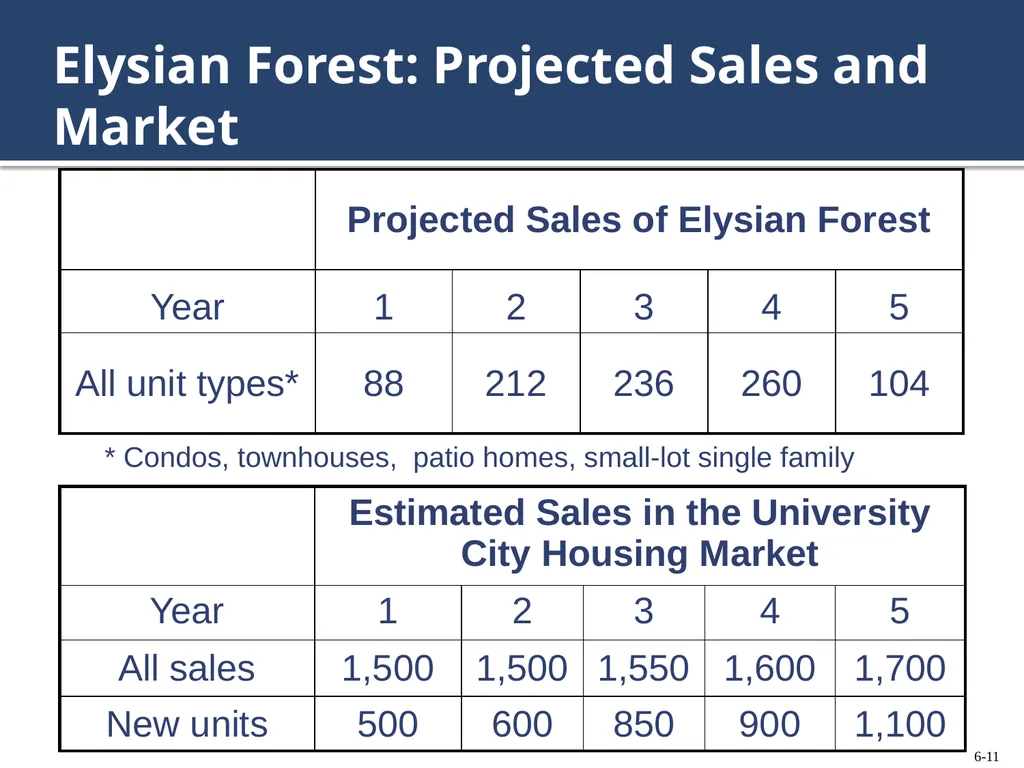
slide11. Elysian Forest: Projected Sales and Market * Condos, townhouses, patio homes, small-lot single family 6-11<br>
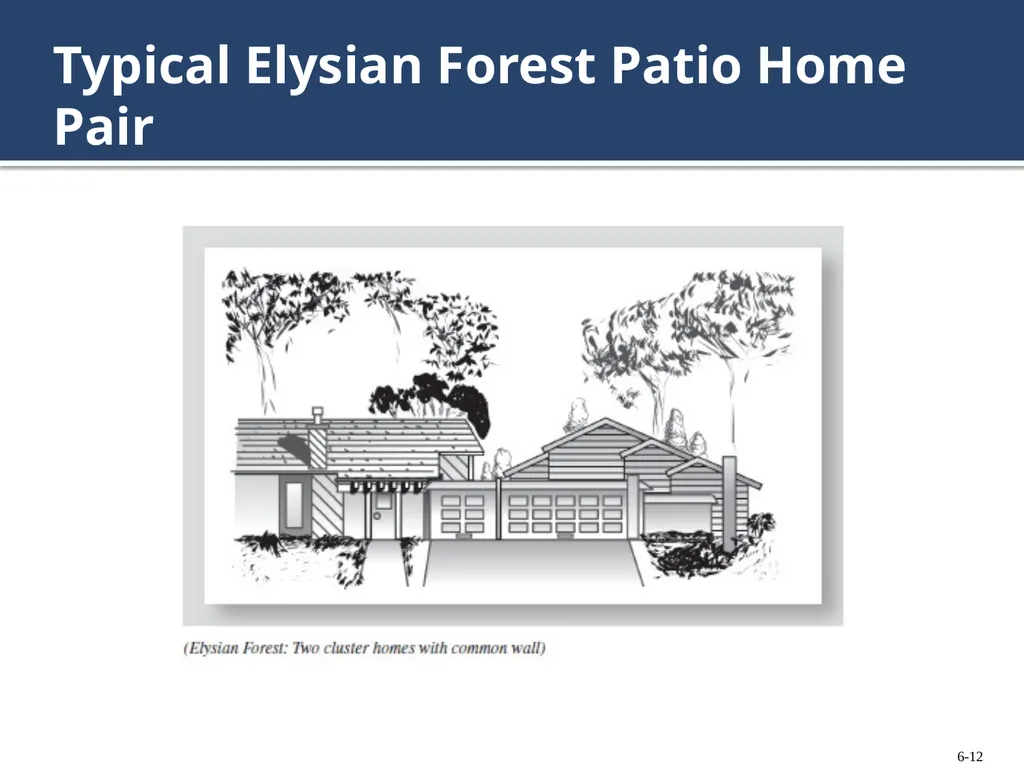
slide12. Typical Elysian Forest Patio Home Pair 6-12<br>
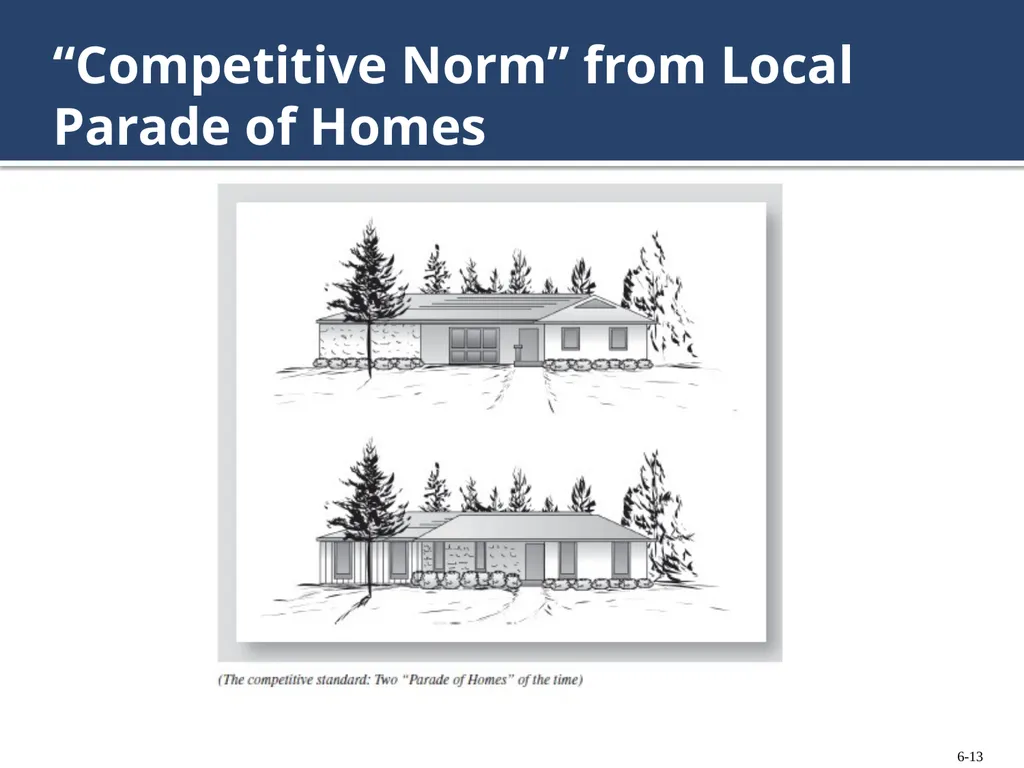
slide13. “Competitive Norm” from Local Parade of Homes 6-13<br>
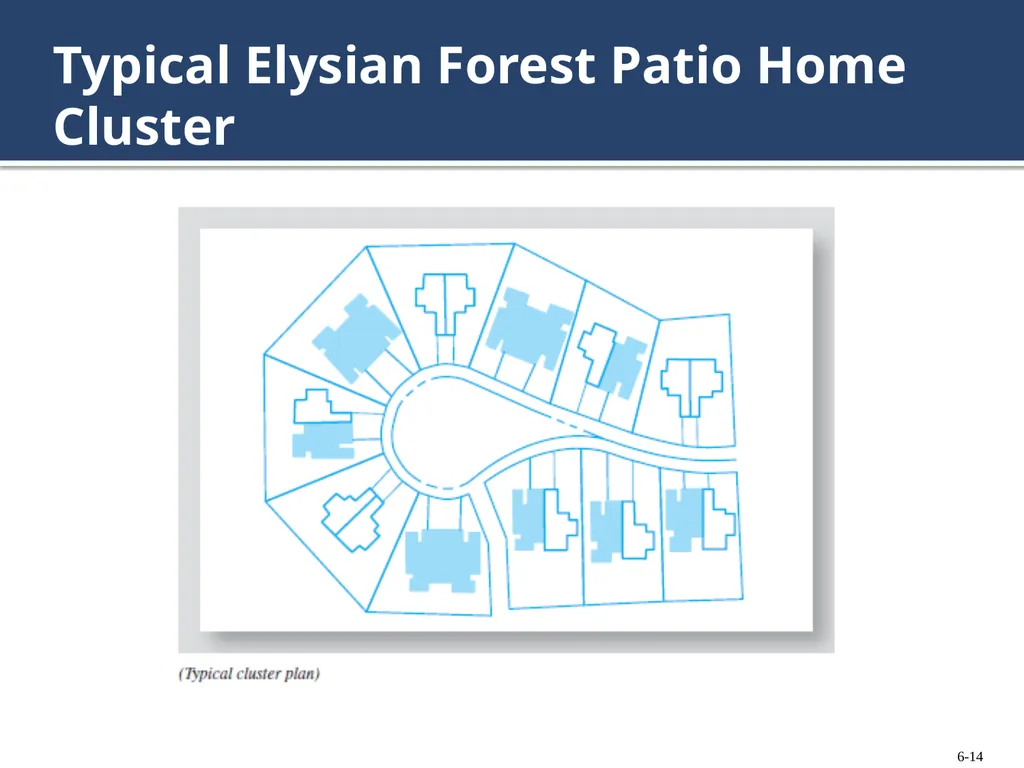
slide14. Typical Elysian Forest Patio Home Cluster 6-14<br>
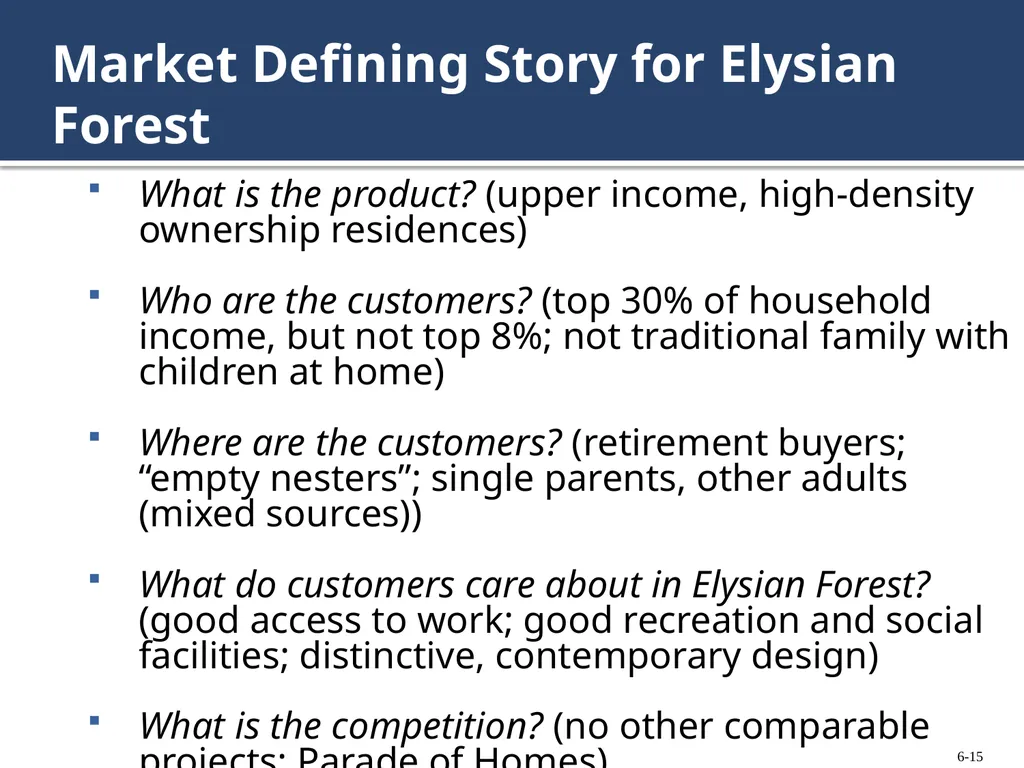
slide15. Market Defining Story for Elysian Forest What is the product? (upper income, high-density ownership residences)
Who are the customers? (top 30% of household income, but not top 8%; not traditional family with children at home)
Where are the customers? (retirement buyers; “empty nesters”; single parents, other adults (mixed sources))
What do customers care about in Elysian Forest? (good access to work; good recreation and social facilities; distinctive, contemporary design)
What is the competition? (no other comparable projects; Parade of Homes) 6-15<br>
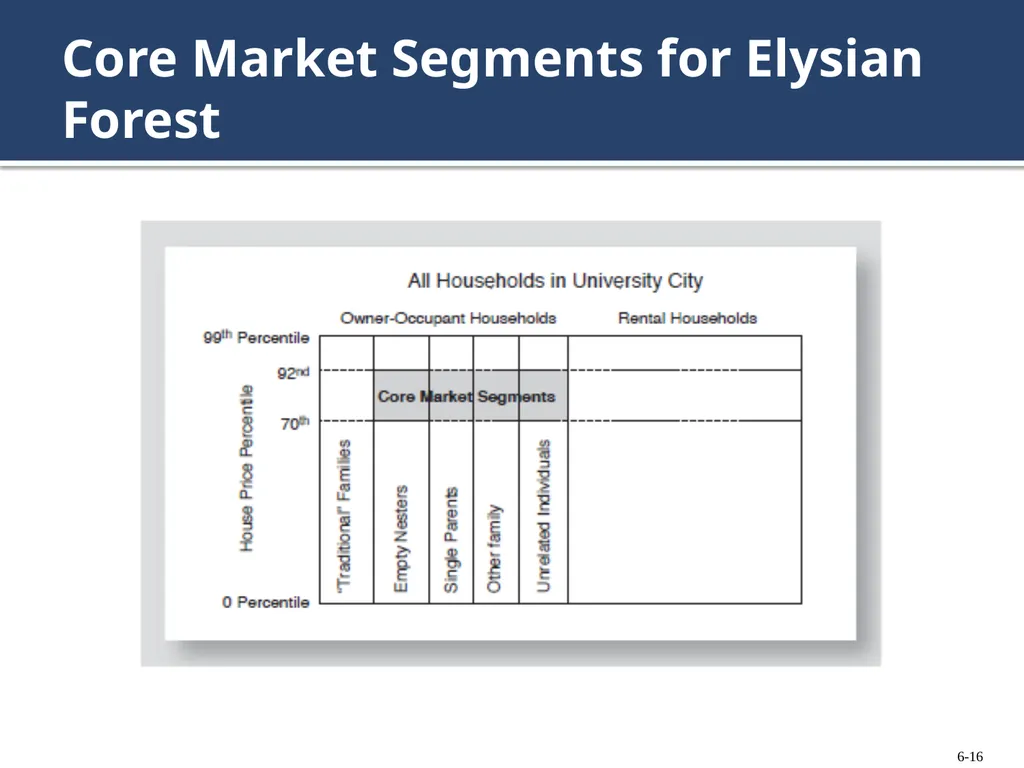
slide16. Core Market Segments for Elysian Forest 6-16<br>
slide17. Initial Data Collection Basic source: U.S. Census American Factfinder
Table B25118 Tenure by Household Income in the past 12 months (income intervals for the 22% of households targeted for Elysian Forest)
Table B19131 Family Type by Presence of Own Children Under 18 Years by Family Income in the past 12 months. (portion of each type of household that is income eligible; portion of traditional households with children at home) 6-17<br>
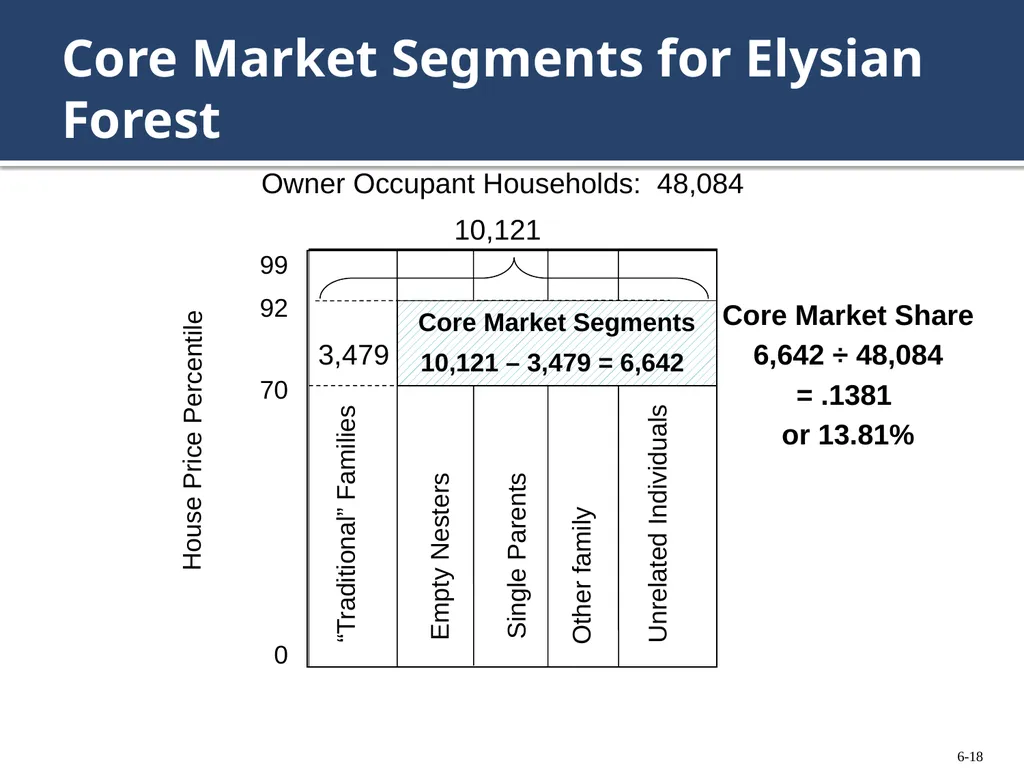
slide18. Core Market Segments for Elysian Forest Core Market Segments 0 99 House Price Percentile 92 70 “Traditional” Families Empty Nesters Single Parents Other family Unrelated Individuals Owner Occupant Households: 48,084 10,121 3,479 10,121 – 3,479 = 6,642 Core Market Share
6,642 ÷ 48,084
= .1381
or 13.81% 6-18<br>
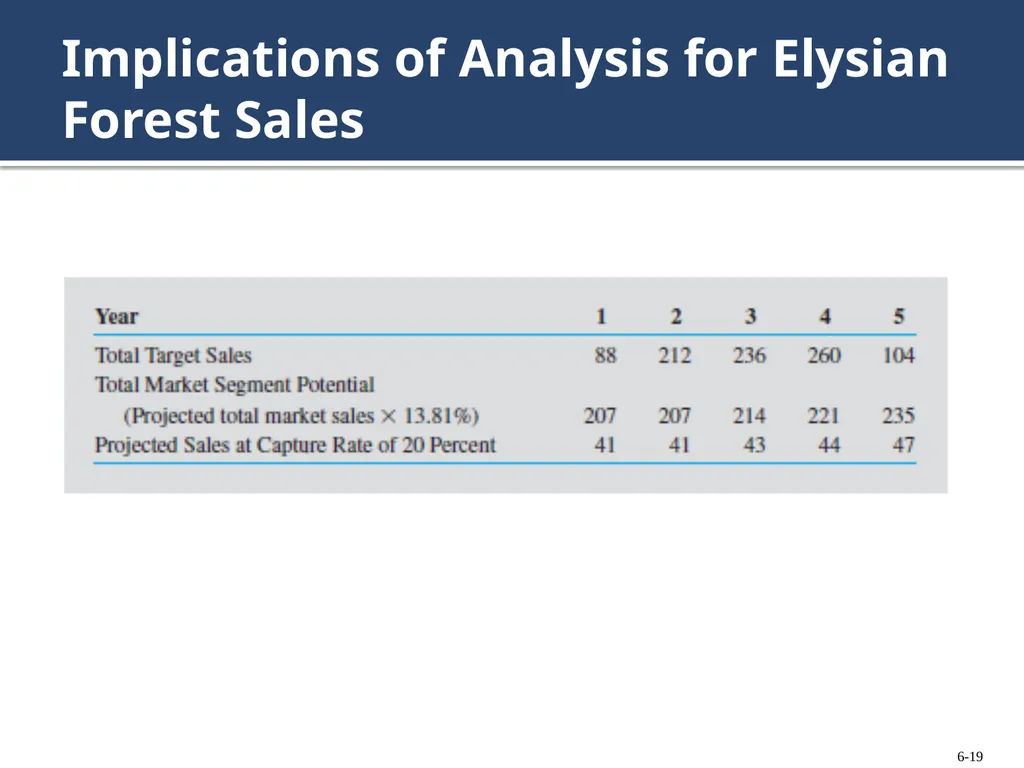
slide19. Implications of Analysis for Elysian Forest Sales 6-19<br>
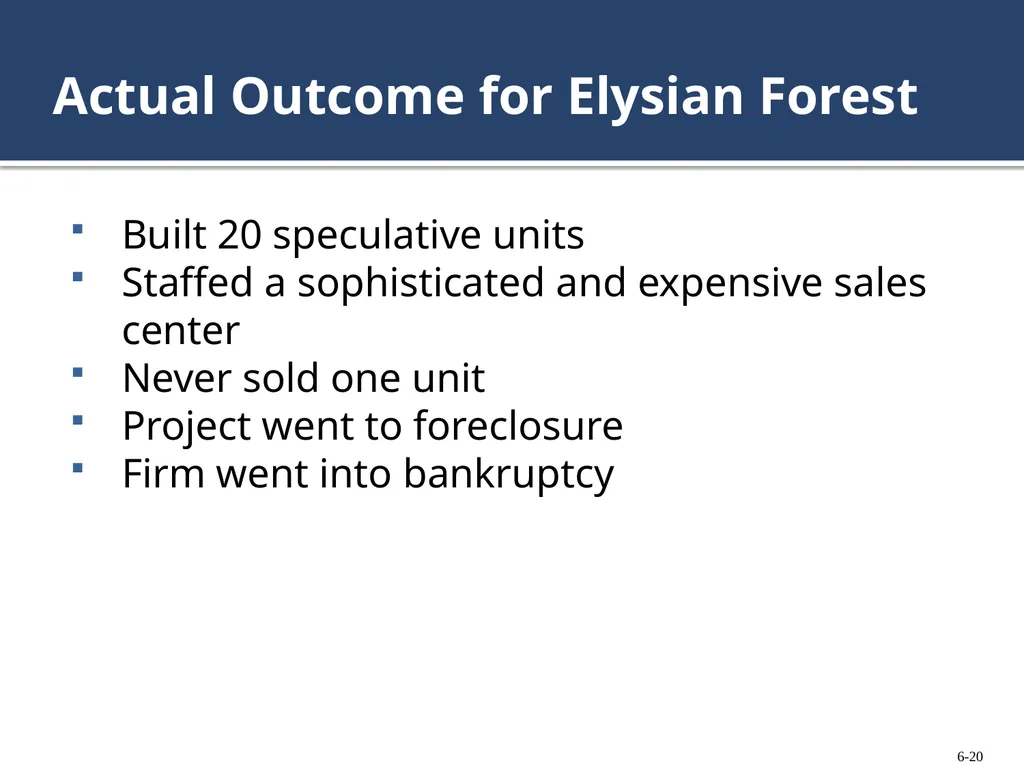
slide20. Actual Outcome for Elysian Forest Built 20 speculative units
Staffed a sophisticated and expensive sales center
Never sold one unit
Project went to foreclosure
Firm went into bankruptcy 6-20<br>
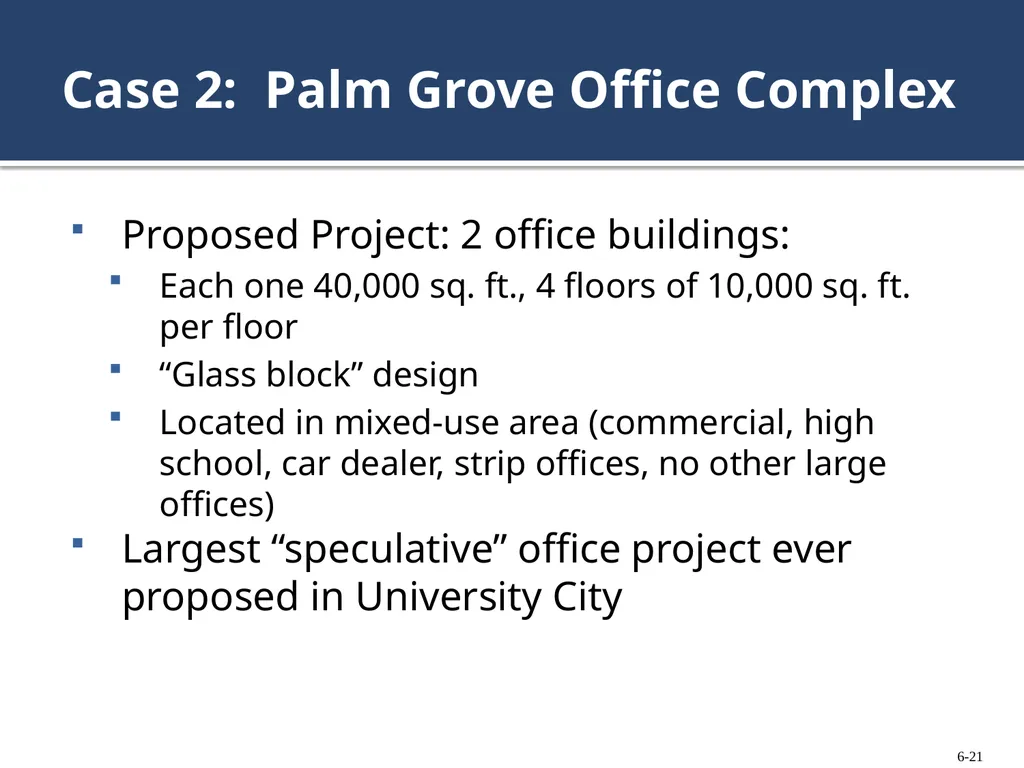
slide21. Case 2: Palm Grove Office Complex Proposed Project: 2 office buildings:
Each one 40,000 sq. ft., 4 floors of 10,000 sq. ft. per floor
“Glass block” design
Located in mixed-use area (commercial, high school, car dealer, strip offices, no other large offices)
Largest “speculative” office project ever proposed in University City 6-21<br>
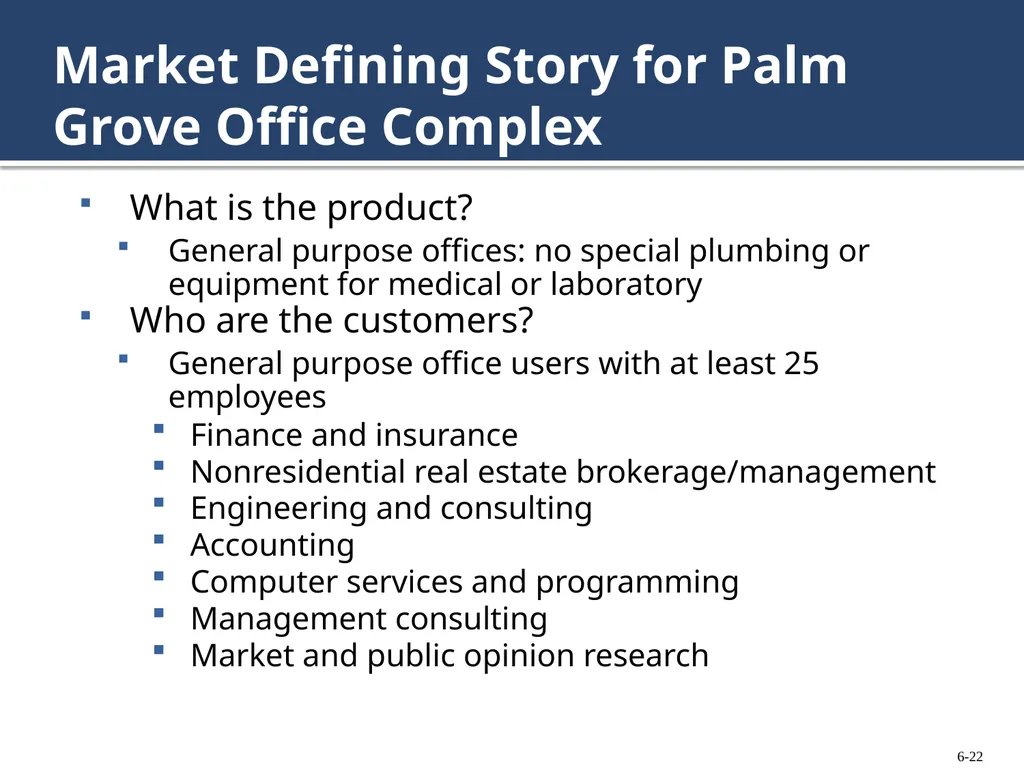
slide22. Market Defining Story for Palm Grove Office Complex What is the product?
General purpose offices: no special plumbing or equipment for medical or laboratory
Who are the customers?
General purpose office users with at least 25 employees
Finance and insurance
Nonresidential real estate brokerage/management
Engineering and consulting
Accounting
Computer services and programming
Management consulting
Market and public opinion research 6-22<br>
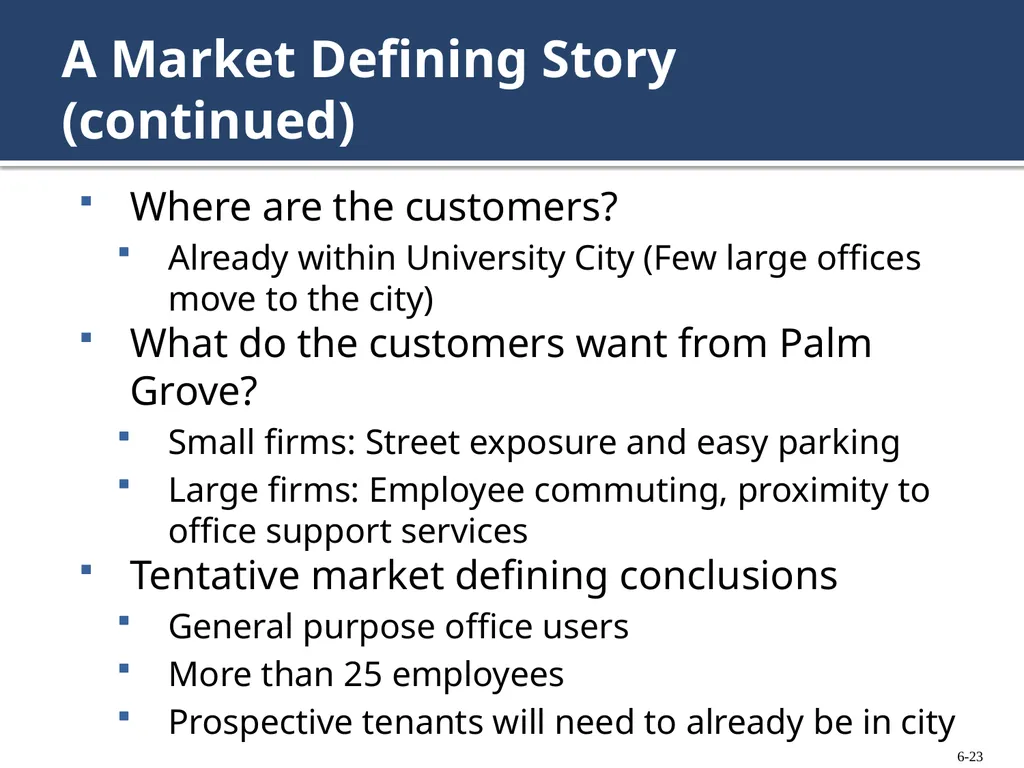
slide23. A Market Defining Story (continued) Where are the customers?
Already within University City (Few large offices move to the city)
What do the customers want from Palm Grove?
Small firms: Street exposure and easy parking
Large firms: Employee commuting, proximity to office support services
Tentative market defining conclusions
General purpose office users
More than 25 employees
Prospective tenants will need to already be in city 6-23<br>
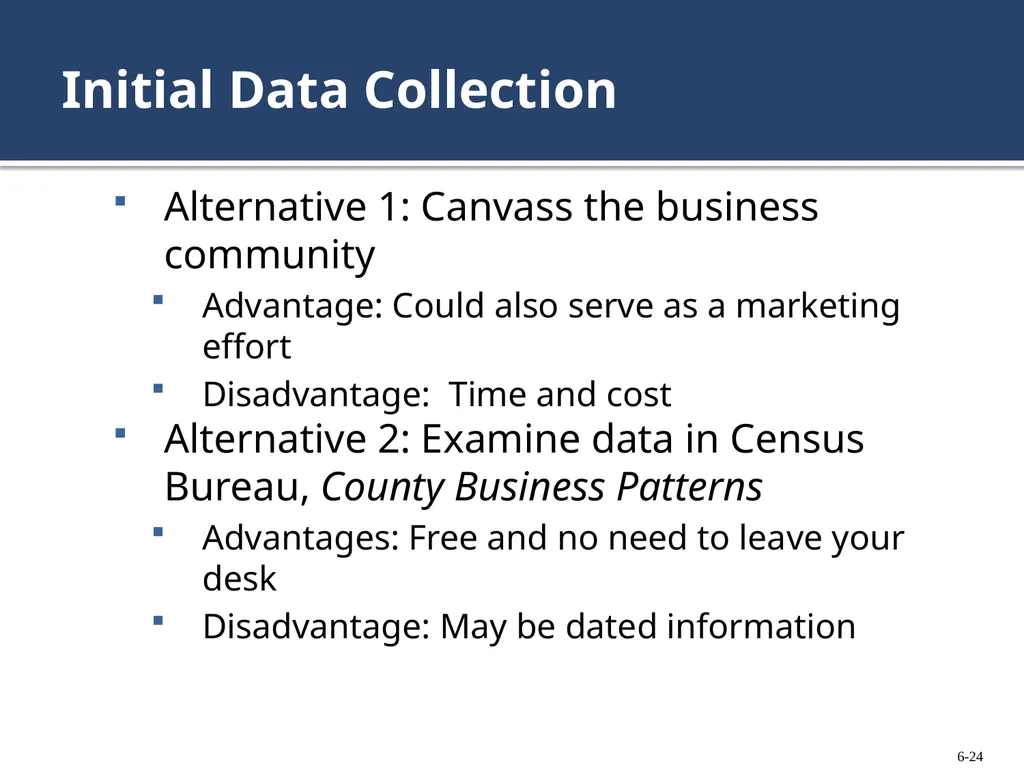
slide24. Initial Data Collection Alternative 1: Canvass the business community
Advantage: Could also serve as a marketing effort
Disadvantage: Time and cost
Alternative 2: Examine data in Census Bureau, County Business Patterns
Advantages: Free and no need to leave your desk
Disadvantage: May be dated information 6-24<br>
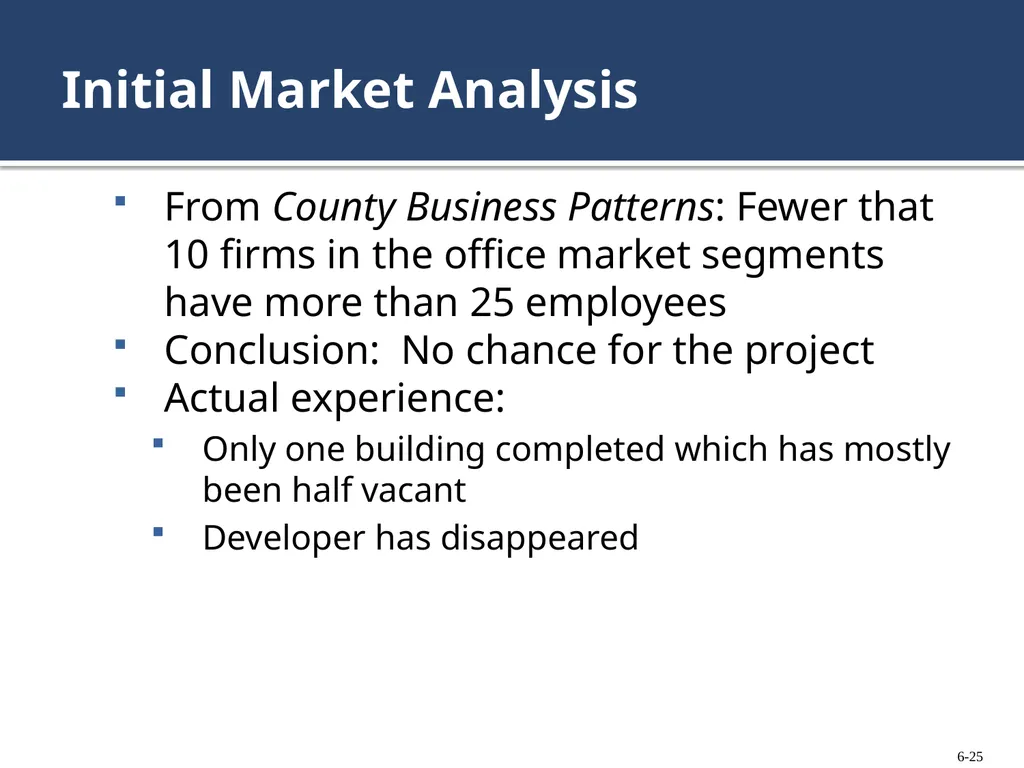
slide25. Initial Market Analysis From County Business Patterns: Fewer that 10 firms in the office market segments have more than 25 employees
Conclusion: No chance for the project
Actual experience:
Only one building completed which has mostly been half vacant
Developer has disappeared 6-25<br>
slide26. Case 3: Plane Vista Apartments Proposed project: Add 400 units to present 500 units.
Existing project:
Four years old
High quality, wide variety of floor plans
Indoor gymnasium with large weight room
Diverse mix of tenants
Location: Immediately north of Orlando airport
Weakness: Perimeter of city; no special amenities 6-26<br>
slide27. Location of Plane Vista in Orlando 6-27<br>
slide28. Market Defining Story for Plane Vista What is the product?
Standard design, broad appeal; high-quality apartments
Who are the customers?
Assume a broad spectrum of working rental households; upper third of rental household income distribution 6-28<br>
slide29. Market Defining Story for Plane Vista (continued) Where are the customers?
Initial assumption: Persons employed throughout east, south and central Orlando
Influenced by commuting distance to work
What do customers like about Plane Vista?
Should be well known from existing project 6-29<br>
slide30. Initial Data Collection Concerned with commuter access of Plane Vista relative to competing apartment projects
Must see: locations of new, high-quality apartments and where jobs are concentrated
Obtained apartment locations from dominant apartment market research firm in Orlando
No solid information on job locations 6-30<br>
slide31. Constructing Estimates of Job Locations Available job related data:
Property appraiser’s database on 43,000 business and government properties
Square footage of structures
Location by geographic coordinates
Classified by over 200 land use categories
U.S. Bureau of Labor Statistics website:
County employment by NAICS category 6-31<br>
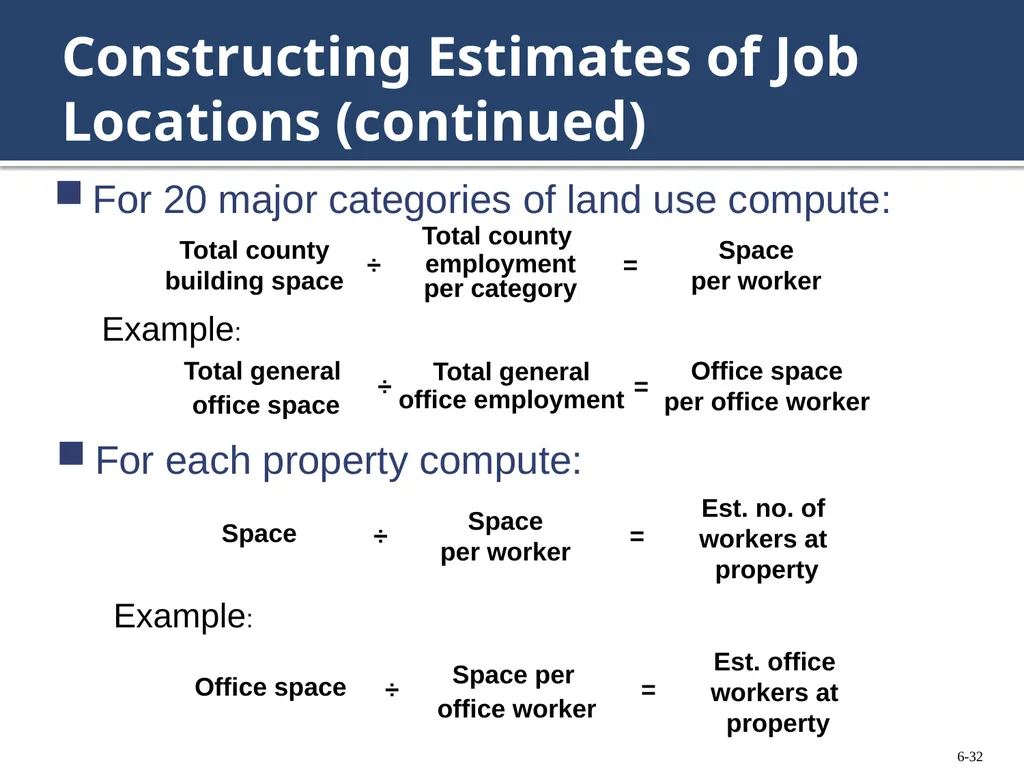
slide32. Constructing Estimates of Job Locations (continued) For 20 major categories of land use compute: Example: For each property compute: Example: 6-32<br>
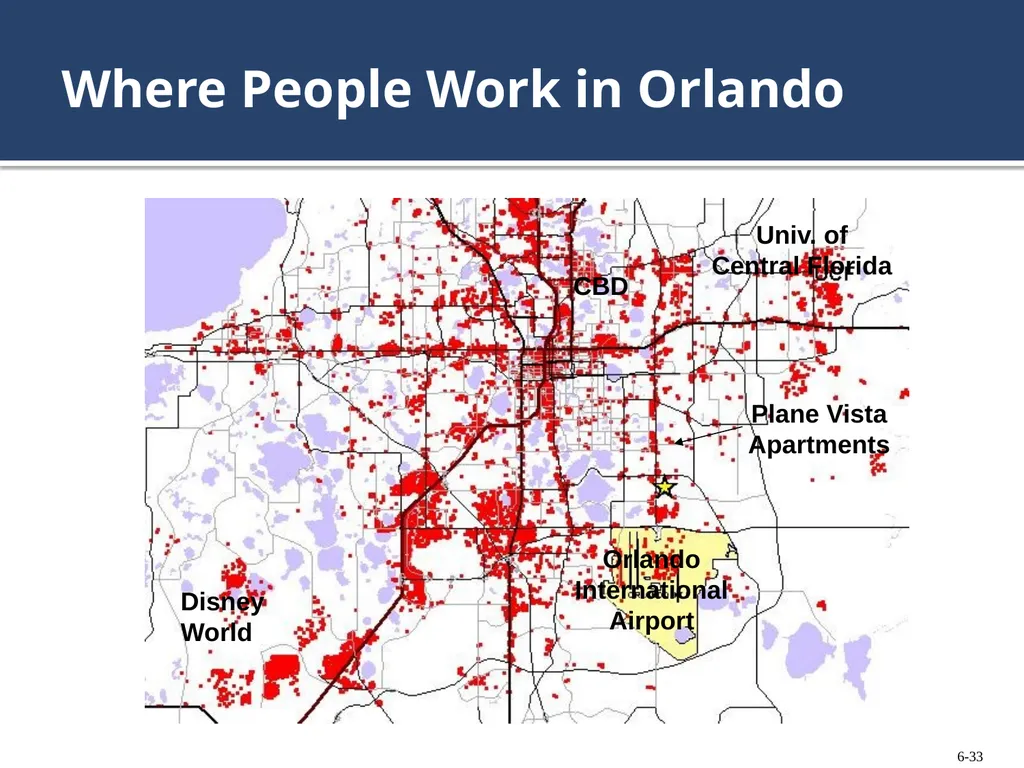
slide33. Where People Work in Orlando Disney World CBD Orlando International Airport Plane Vista Apartments Univ. of Central Florida 6-33<br>
slide34. Initial Market Analysis Distribution of new apartments shows a discrepancy between initial story and map:
Most new apartments are very distant from Plane Vista
Suggests that Plane Vista is isolation from larger Orlando market
Jobs map shows a similar clustering:
Jobs concentrated at airport and on the arterial leading north
Jobs scarce to south, west, and east 6-34<br>
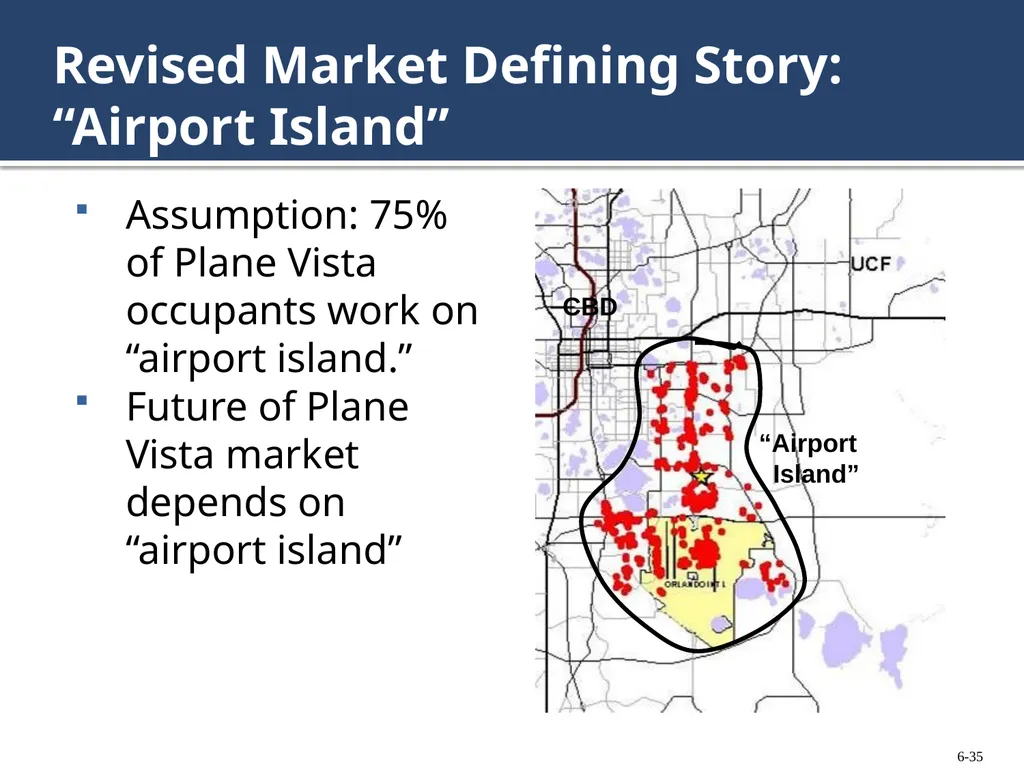
slide35. Revised Market Defining Story: “Airport Island” Assumption: 75% of Plane Vista occupants work on “airport island.”
Future of Plane Vista market depends on “airport island” 6-35<br>
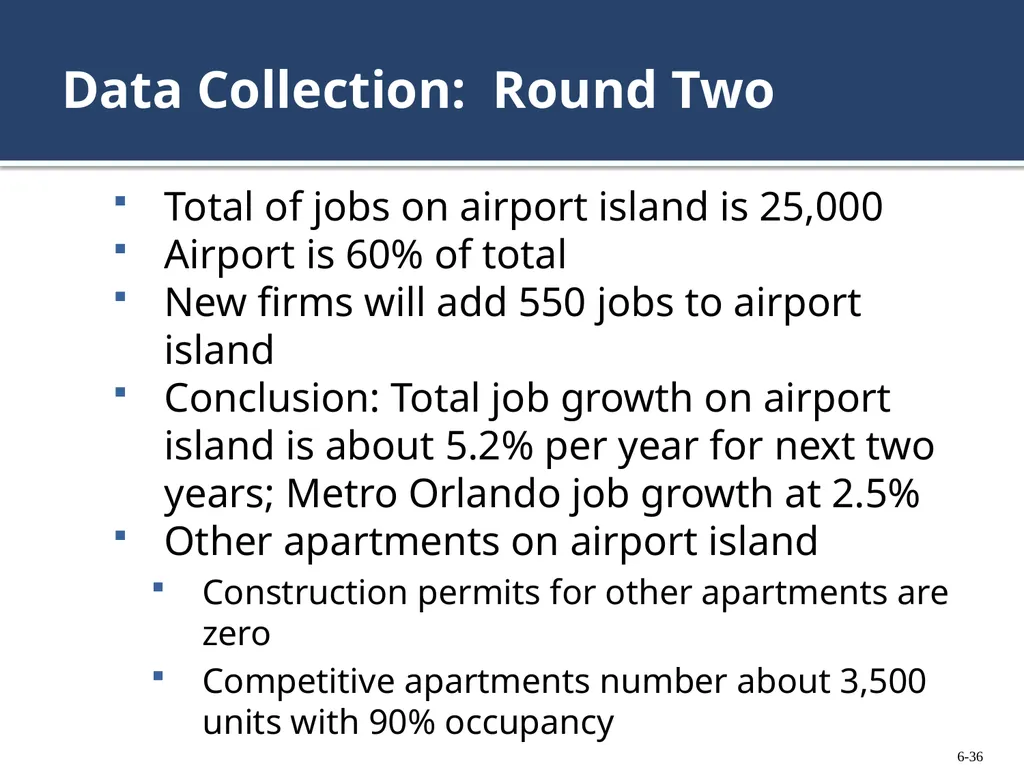
slide36. Data Collection: Round Two Total of jobs on airport island is 25,000
Airport is 60% of total
New firms will add 550 jobs to airport island
Conclusion: Total job growth on airport island is about 5.2% per year for next two years; Metro Orlando job growth at 2.5%
Other apartments on airport island
Construction permits for other apartments are zero
Competitive apartments number about 3,500 units with 90% occupancy 6-36<br>
slide37. Final Market Analysis: Key Assumptions All else equal, apartment rental rates grow at the rate of inflation
Job growth drives apartment demand on airport island
No other new apartments for two years 6-37<br>
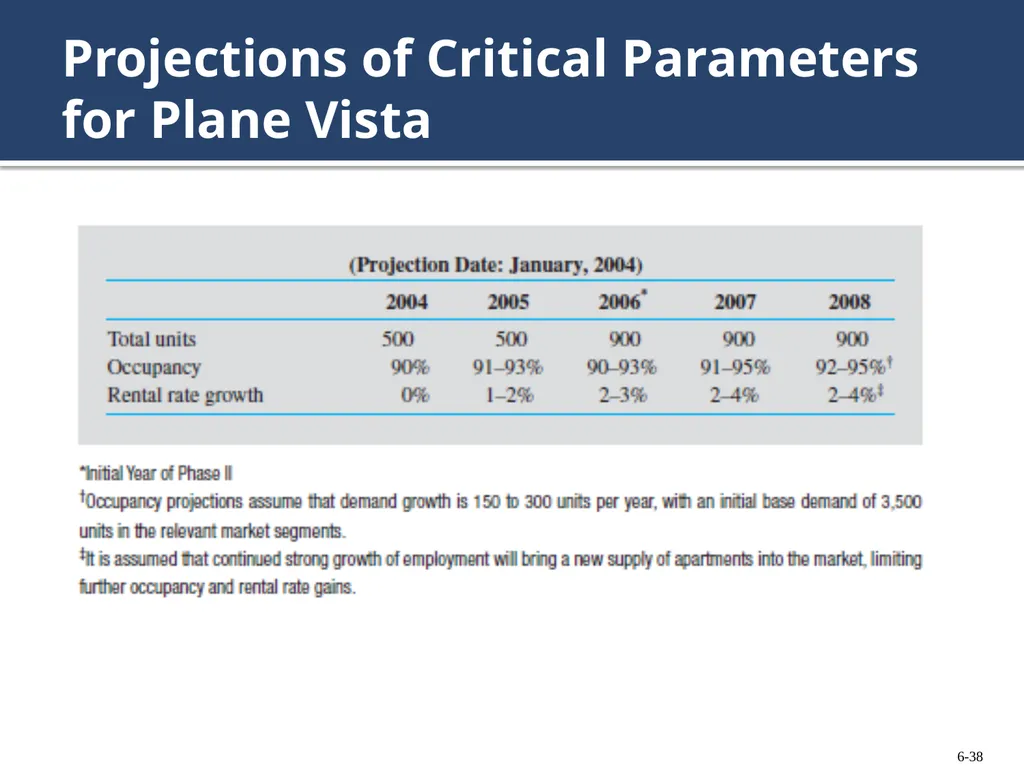
slide38. Projections of Critical Parameters for Plane Vista 6-38<br>
slide39. Questions about the Plane Vista Analysis Which of the key assumptions seems most vulnerable to error?
What could be done to reduce it’s riskiness?
Does the projection of job growth on “Airport Island” seem safe? 6-39<br>
slide40. Some Final Observations on the Plane Vista Analysis A market analysis is always a story
No market analysis is purely numbers
Goal: Put together as much objective evidence as possible before making final judgments
Articulate the key assumptions as clearly as possible (Example: Airport growth was crucial to the Plane Vista story)
Next step: How to translate these into an estimate of value 6-40<br>
slide41. A Perspective on Real Estate Value James Graaskamp: “When you buy real estate, you are buying a set of assumptions about the future”
We have set out our assumptions about Plane Vista 6-41<br>
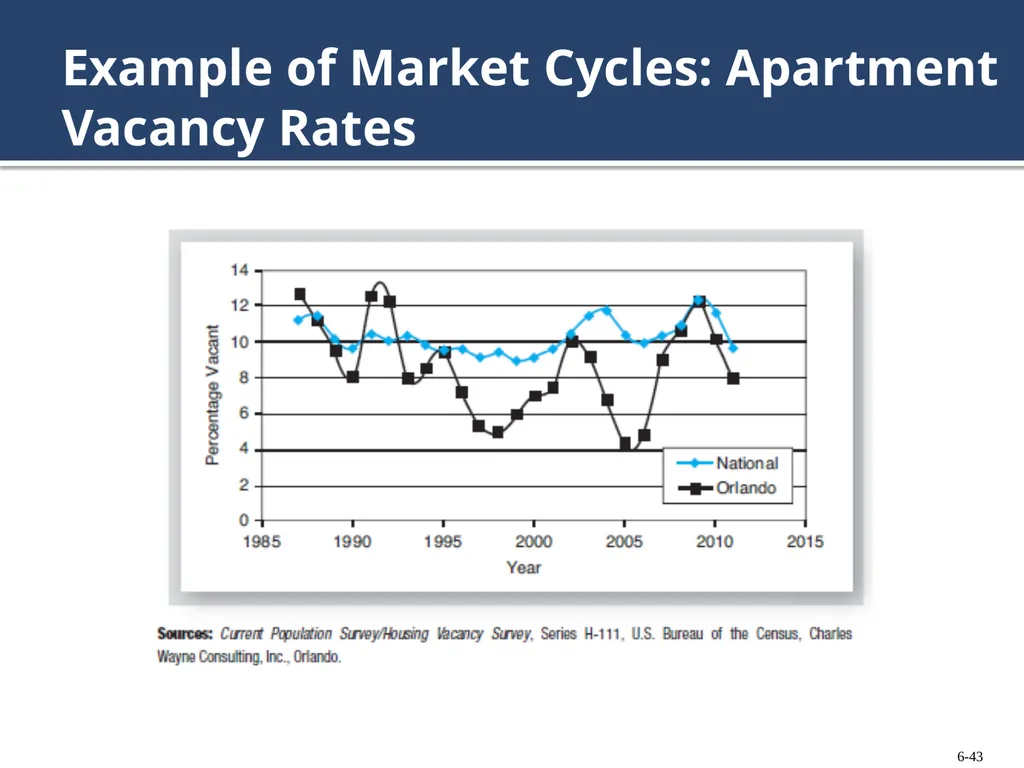
slide42. Some Points about Real Estate Market Cycles Real estate markets differ in cyclicality
Office demand follow business cycles, and is very cyclical
Apartments are less so since households must live somewhere
Longer construction lead time means more cyclicality
Poorer market information means more cyclicality 6-42<br>
slide43. Example of Market Cycles: Apartment Vacancy Rates 6-43<br>
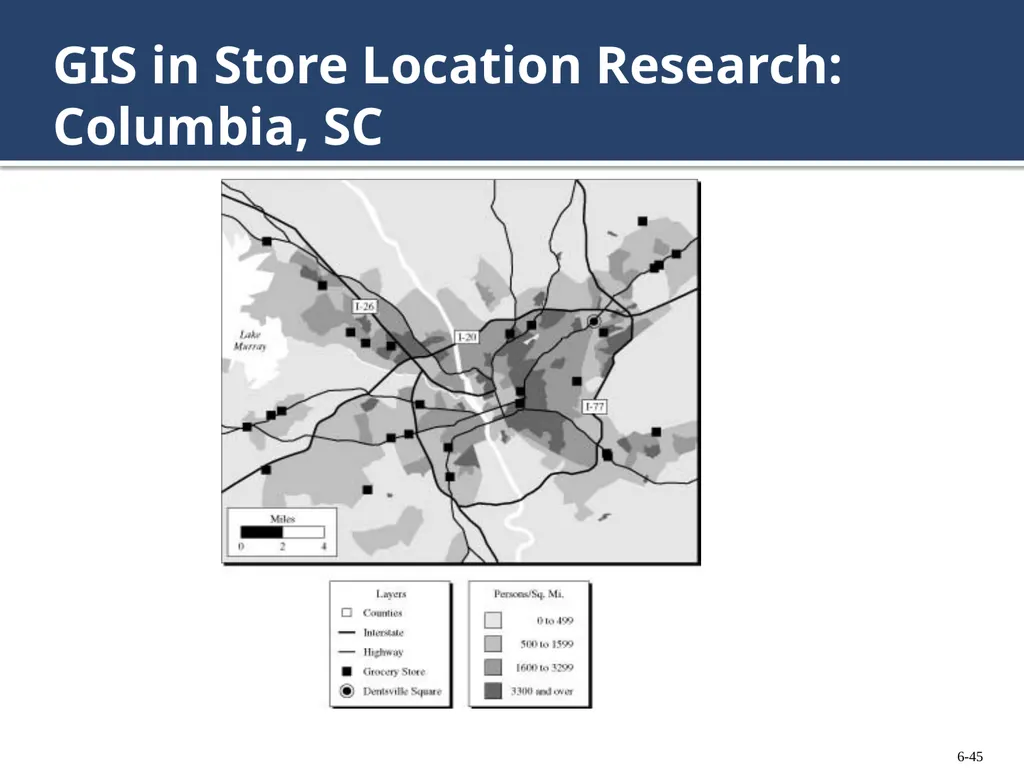
slide44. High-Tech Tools for Real Estate Market Research Geographic information systems (GIS)
Made analysis of Plane Vista possible
Widely used in store location research
Psychographics
Market segmentation research seeks to relate product preferences to “attitudes, interests, opinions, and values, and to demographics
Used to date in retail real estate, but may also apply to housing 6-44<br>
slide45. GIS in Store Location Research: Columbia, SC 6-45<br>
slide46. Survey Research Potentially powerful tool if used carefully
Example applications
Coastal Condo design: How many bedrooms do prospective buyers want?
Plane Vista: Where do current residents really work?
Risk: Ending up with meaningless questions or a meaningless sample
Key preventative tools:
Obtain review and advice from experienced survey researchers
Pretest 6-46<br>
slide47. End of Chapter 6 6-47<br>
slide2. Multiple Factors Affect Real Estate Demand Needs for access (“linkages”)
“location, location, and location”
Non-locational factors
Housing (style, design, size; financing available)
Commercial (tenant mix and character; parking facilities)
Offices (style, design, floor plate size; amenities and services; electrical and communications service) 6-2<br>
slide3. Market Segmentation Market segmentation: Differences in preferences or needs among market subgroups
Implication of market segmentation: Market research must focus on relevant market segments
Corollary 1: Most real estate data is irrelevant in studying any particular property
Corollary 2: Most important data for a particular market segment may not be readily available 6-3<br>
slide4. Challenges Posed by Market Segmentation Market segmentation is an empirical notion:
Cannot be described without investigating first
Important facts of segmentation may vary with location and property type
Research process must recognize this challenge
No simple, universal procedure 6-4<br>
slide5. The Cycle of Market Research 6-5<br>
slide6. Writing a Market Story All market research is someone’s particular story (Best to write down the assumptions of the story)
Clues about market segments can come from industry literature (ex: Urban Land Institute)
Initial collection of data should depend on the assumptions about segmentation
Object: Estimate critical market parameters (rental rates, sales projections, etc.) 6-6<br>
slide7. Writing a Market Story (continued) First analysis
What range of critical parameters are implied by data?
Range narrow enough to be useful?
Refinement necessary?
Refining the research
What factors affect critical parameters the most?
What information illuminates those factors? 6-7<br>
slide8. Story Approach vs. Conventional Market Research Story approach begins with property and its market segments, and then builds links to larger economy
Conventional approach goes from the state of the world, to the nation, to the state, and then to the city, and finally to the property 6-8<br>
slide9. Three Examples of Property Market Research Elysian Forest – planned unit development
Palm Grove – proposed office building
Plane Vista – proposed apartment expansion
Why look only at development projects?
No difference in market analysis questions between existing and proposed properties
Much more market information for existing properties
Therefore, critical parameters should be clearer for existing properties
Development projects demonstrate more of the challenging data issues 6-9<br>
slide10. Elysian Forest: Proposed Planned Unit Development (PUD) PUD characteristics
Mixed density (single family to townhouses)
Smaller individual lots for single family
Common areas and recreation facilities
Elysian Forest was bold and big (for University City)
First PUD
900 units (several times the size of typical development 6-10<br>
slide11. Elysian Forest: Projected Sales and Market * Condos, townhouses, patio homes, small-lot single family 6-11<br>
slide12. Typical Elysian Forest Patio Home Pair 6-12<br>
slide13. “Competitive Norm” from Local Parade of Homes 6-13<br>
slide14. Typical Elysian Forest Patio Home Cluster 6-14<br>
slide15. Market Defining Story for Elysian Forest What is the product? (upper income, high-density ownership residences)
Who are the customers? (top 30% of household income, but not top 8%; not traditional family with children at home)
Where are the customers? (retirement buyers; “empty nesters”; single parents, other adults (mixed sources))
What do customers care about in Elysian Forest? (good access to work; good recreation and social facilities; distinctive, contemporary design)
What is the competition? (no other comparable projects; Parade of Homes) 6-15<br>
slide16. Core Market Segments for Elysian Forest 6-16<br>
slide17. Initial Data Collection Basic source: U.S. Census American Factfinder
Table B25118 Tenure by Household Income in the past 12 months (income intervals for the 22% of households targeted for Elysian Forest)
Table B19131 Family Type by Presence of Own Children Under 18 Years by Family Income in the past 12 months. (portion of each type of household that is income eligible; portion of traditional households with children at home) 6-17<br>
slide18. Core Market Segments for Elysian Forest Core Market Segments 0 99 House Price Percentile 92 70 “Traditional” Families Empty Nesters Single Parents Other family Unrelated Individuals Owner Occupant Households: 48,084 10,121 3,479 10,121 – 3,479 = 6,642 Core Market Share
6,642 ÷ 48,084
= .1381
or 13.81% 6-18<br>
slide19. Implications of Analysis for Elysian Forest Sales 6-19<br>
slide20. Actual Outcome for Elysian Forest Built 20 speculative units
Staffed a sophisticated and expensive sales center
Never sold one unit
Project went to foreclosure
Firm went into bankruptcy 6-20<br>
slide21. Case 2: Palm Grove Office Complex Proposed Project: 2 office buildings:
Each one 40,000 sq. ft., 4 floors of 10,000 sq. ft. per floor
“Glass block” design
Located in mixed-use area (commercial, high school, car dealer, strip offices, no other large offices)
Largest “speculative” office project ever proposed in University City 6-21<br>
slide22. Market Defining Story for Palm Grove Office Complex What is the product?
General purpose offices: no special plumbing or equipment for medical or laboratory
Who are the customers?
General purpose office users with at least 25 employees
Finance and insurance
Nonresidential real estate brokerage/management
Engineering and consulting
Accounting
Computer services and programming
Management consulting
Market and public opinion research 6-22<br>
slide23. A Market Defining Story (continued) Where are the customers?
Already within University City (Few large offices move to the city)
What do the customers want from Palm Grove?
Small firms: Street exposure and easy parking
Large firms: Employee commuting, proximity to office support services
Tentative market defining conclusions
General purpose office users
More than 25 employees
Prospective tenants will need to already be in city 6-23<br>
slide24. Initial Data Collection Alternative 1: Canvass the business community
Advantage: Could also serve as a marketing effort
Disadvantage: Time and cost
Alternative 2: Examine data in Census Bureau, County Business Patterns
Advantages: Free and no need to leave your desk
Disadvantage: May be dated information 6-24<br>
slide25. Initial Market Analysis From County Business Patterns: Fewer that 10 firms in the office market segments have more than 25 employees
Conclusion: No chance for the project
Actual experience:
Only one building completed which has mostly been half vacant
Developer has disappeared 6-25<br>
slide26. Case 3: Plane Vista Apartments Proposed project: Add 400 units to present 500 units.
Existing project:
Four years old
High quality, wide variety of floor plans
Indoor gymnasium with large weight room
Diverse mix of tenants
Location: Immediately north of Orlando airport
Weakness: Perimeter of city; no special amenities 6-26<br>
slide27. Location of Plane Vista in Orlando 6-27<br>
slide28. Market Defining Story for Plane Vista What is the product?
Standard design, broad appeal; high-quality apartments
Who are the customers?
Assume a broad spectrum of working rental households; upper third of rental household income distribution 6-28<br>
slide29. Market Defining Story for Plane Vista (continued) Where are the customers?
Initial assumption: Persons employed throughout east, south and central Orlando
Influenced by commuting distance to work
What do customers like about Plane Vista?
Should be well known from existing project 6-29<br>
slide30. Initial Data Collection Concerned with commuter access of Plane Vista relative to competing apartment projects
Must see: locations of new, high-quality apartments and where jobs are concentrated
Obtained apartment locations from dominant apartment market research firm in Orlando
No solid information on job locations 6-30<br>
slide31. Constructing Estimates of Job Locations Available job related data:
Property appraiser’s database on 43,000 business and government properties
Square footage of structures
Location by geographic coordinates
Classified by over 200 land use categories
U.S. Bureau of Labor Statistics website:
County employment by NAICS category 6-31<br>
slide32. Constructing Estimates of Job Locations (continued) For 20 major categories of land use compute: Example: For each property compute: Example: 6-32<br>
slide33. Where People Work in Orlando Disney World CBD Orlando International Airport Plane Vista Apartments Univ. of Central Florida 6-33<br>
slide34. Initial Market Analysis Distribution of new apartments shows a discrepancy between initial story and map:
Most new apartments are very distant from Plane Vista
Suggests that Plane Vista is isolation from larger Orlando market
Jobs map shows a similar clustering:
Jobs concentrated at airport and on the arterial leading north
Jobs scarce to south, west, and east 6-34<br>
slide35. Revised Market Defining Story: “Airport Island” Assumption: 75% of Plane Vista occupants work on “airport island.”
Future of Plane Vista market depends on “airport island” 6-35<br>
slide36. Data Collection: Round Two Total of jobs on airport island is 25,000
Airport is 60% of total
New firms will add 550 jobs to airport island
Conclusion: Total job growth on airport island is about 5.2% per year for next two years; Metro Orlando job growth at 2.5%
Other apartments on airport island
Construction permits for other apartments are zero
Competitive apartments number about 3,500 units with 90% occupancy 6-36<br>
slide37. Final Market Analysis: Key Assumptions All else equal, apartment rental rates grow at the rate of inflation
Job growth drives apartment demand on airport island
No other new apartments for two years 6-37<br>
slide38. Projections of Critical Parameters for Plane Vista 6-38<br>
slide39. Questions about the Plane Vista Analysis Which of the key assumptions seems most vulnerable to error?
What could be done to reduce it’s riskiness?
Does the projection of job growth on “Airport Island” seem safe? 6-39<br>
slide40. Some Final Observations on the Plane Vista Analysis A market analysis is always a story
No market analysis is purely numbers
Goal: Put together as much objective evidence as possible before making final judgments
Articulate the key assumptions as clearly as possible (Example: Airport growth was crucial to the Plane Vista story)
Next step: How to translate these into an estimate of value 6-40<br>
slide41. A Perspective on Real Estate Value James Graaskamp: “When you buy real estate, you are buying a set of assumptions about the future”
We have set out our assumptions about Plane Vista 6-41<br>
slide42. Some Points about Real Estate Market Cycles Real estate markets differ in cyclicality
Office demand follow business cycles, and is very cyclical
Apartments are less so since households must live somewhere
Longer construction lead time means more cyclicality
Poorer market information means more cyclicality 6-42<br>
slide43. Example of Market Cycles: Apartment Vacancy Rates 6-43<br>
slide44. High-Tech Tools for Real Estate Market Research Geographic information systems (GIS)
Made analysis of Plane Vista possible
Widely used in store location research
Psychographics
Market segmentation research seeks to relate product preferences to “attitudes, interests, opinions, and values, and to demographics
Used to date in retail real estate, but may also apply to housing 6-44<br>
slide45. GIS in Store Location Research: Columbia, SC 6-45<br>
slide46. Survey Research Potentially powerful tool if used carefully
Example applications
Coastal Condo design: How many bedrooms do prospective buyers want?
Plane Vista: Where do current residents really work?
Risk: Ending up with meaningless questions or a meaningless sample
Key preventative tools:
Obtain review and advice from experienced survey researchers
Pretest 6-46<br>
slide47. End of Chapter 6 6-47<br>