
Forecasting Forecasting Problems and Methods New
MS
Published · 41 slides · 0 views
1 / 1

Description
Forecasting Forecasting Problems and Methods New product forecasting Forecasting using Diffusion Models (to forecast trial or adoption) Forecasting using Pre-Test Market Models (to forecast both trial and repeat purchase) Managerial Issues
Related Topics
Share
Embed code
Download this presentation From Below
"Forecasting Forecasting Problems and Methods New" is the property of its rightful owner. Permission is granted to download and print the materials on this website for personal, non-commercial use only, and to display it on your personal computer provided you do not modify the materials and that you retain all copyright notices contained in the materials. By downloading content from our website, you accept the terms of this agreement.
Presentation Transcript
01
Forecasting Forecasting Problems and Methods
New product forecasting
Forecasting using Diffusion Models (to forecast trial or adoption)
Forecasting using Pre-Test Market Models (to forecast both trial and repeat purchase)<br>
New product forecasting
Forecasting using Diffusion Models (to forecast trial or adoption)
Forecasting using Pre-Test Market Models (to forecast both trial and repeat purchase)<br>
02
Managerial Issues Related to
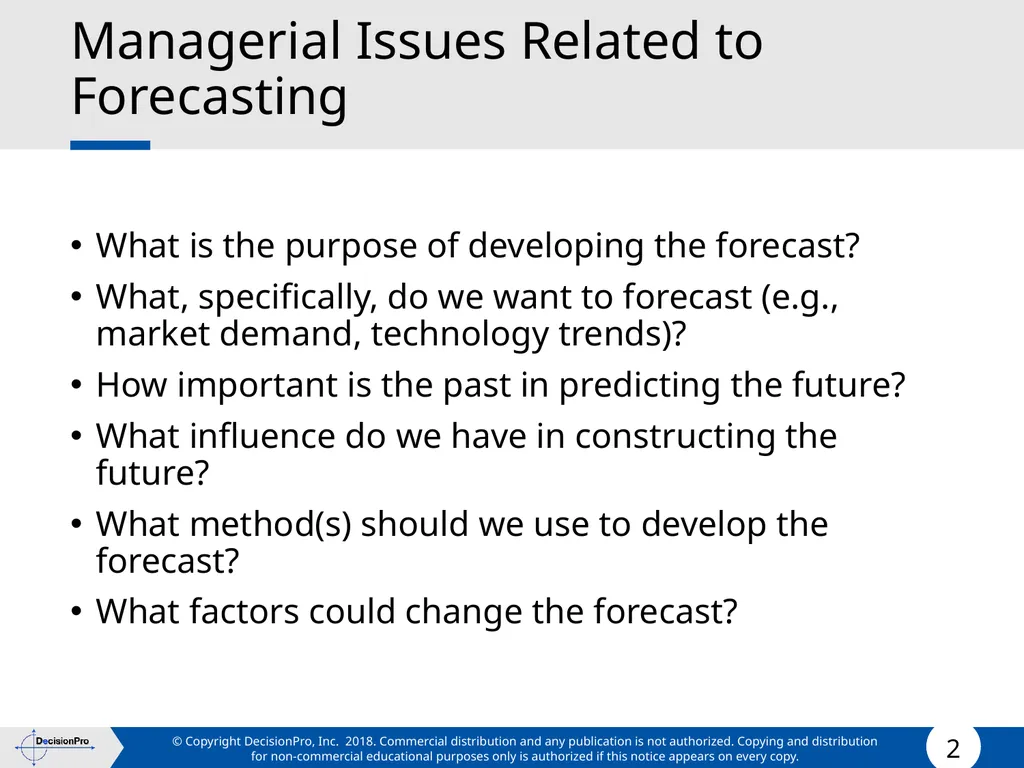
Forecasting What is the purpose of developing the forecast?
What, specifically, do we want to forecast (e.g., market demand, technology trends)?
How important is the past in predicting the future?
What influence do we have in constructing the future?
What method(s) should we use to develop the forecast?
What factors could change the forecast?<br>
What, specifically, do we want to forecast (e.g., market demand, technology trends)?
How important is the past in predicting the future?
What influence do we have in constructing the future?
What method(s) should we use to develop the forecast?
What factors could change the forecast?<br>
03
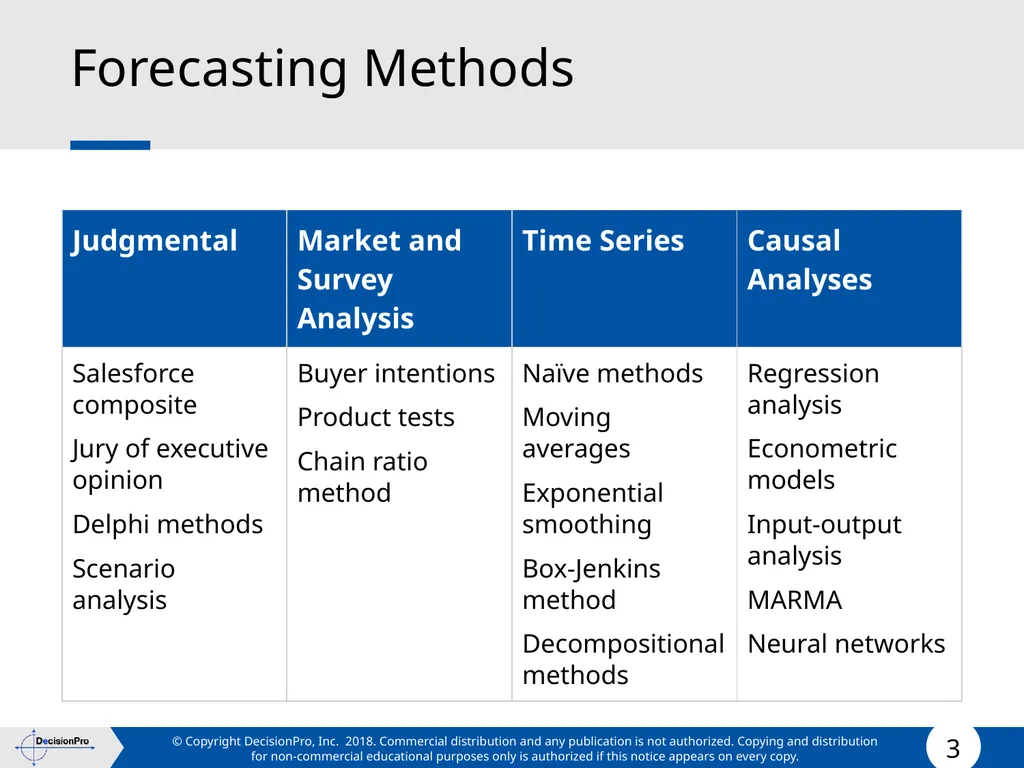
Forecasting Methods<br>
04
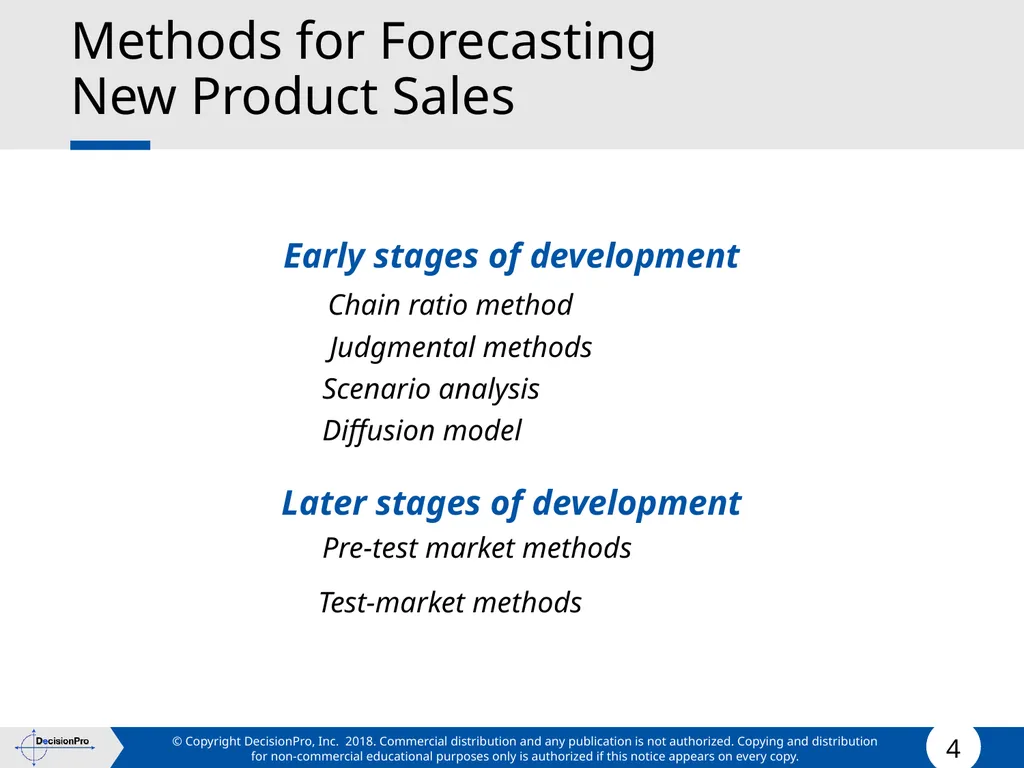
Methods for Forecasting
New Product Sales Early stages of development
Chain ratio method
Judgmental methods
Scenario analysis
Diffusion model
Later stages of development
Pre-test market methods Test-market methods<br>
Chain ratio method
Judgmental methods
Scenario analysis
Diffusion model
Later stages of development
Pre-test market methods Test-market methods<br>
05
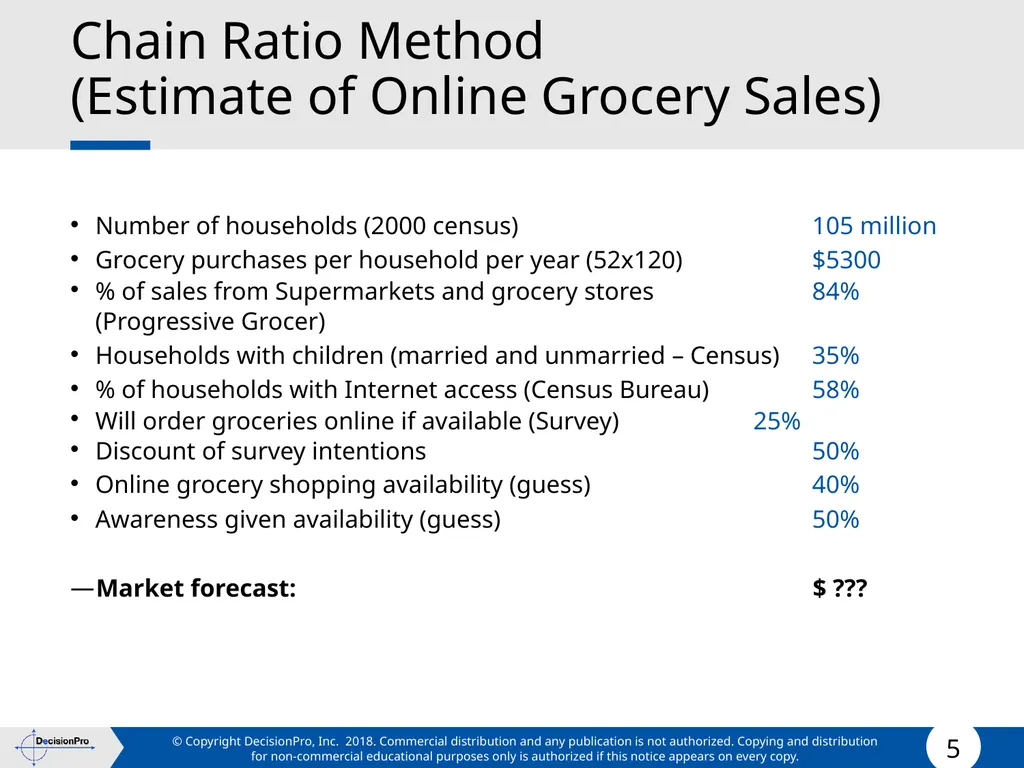
Chain Ratio Method
(Estimate of Online Grocery Sales) Number of households (2000 census) 105 million
Grocery purchases per household per year (52x120) $5300
% of sales from Supermarkets and grocery stores 84%
(Progressive Grocer)
Households with children (married and unmarried – Census) 35%
% of households with Internet access (Census Bureau) 58%
Will order groceries online if available (Survey) 25%
Discount of survey intentions 50%
Online grocery shopping availability (guess) 40%
Awareness given availability (guess) 50%
Market forecast: $ ???<br>
Grocery purchases per household per year (52x120) $5300
% of sales from Supermarkets and grocery stores 84%
(Progressive Grocer)
Households with children (married and unmarried – Census) 35%
% of households with Internet access (Census Bureau) 58%
Will order groceries online if available (Survey) 25%
Discount of survey intentions 50%
Online grocery shopping availability (guess) 40%
Awareness given availability (guess) 50%
Market forecast: $ ???<br>
06
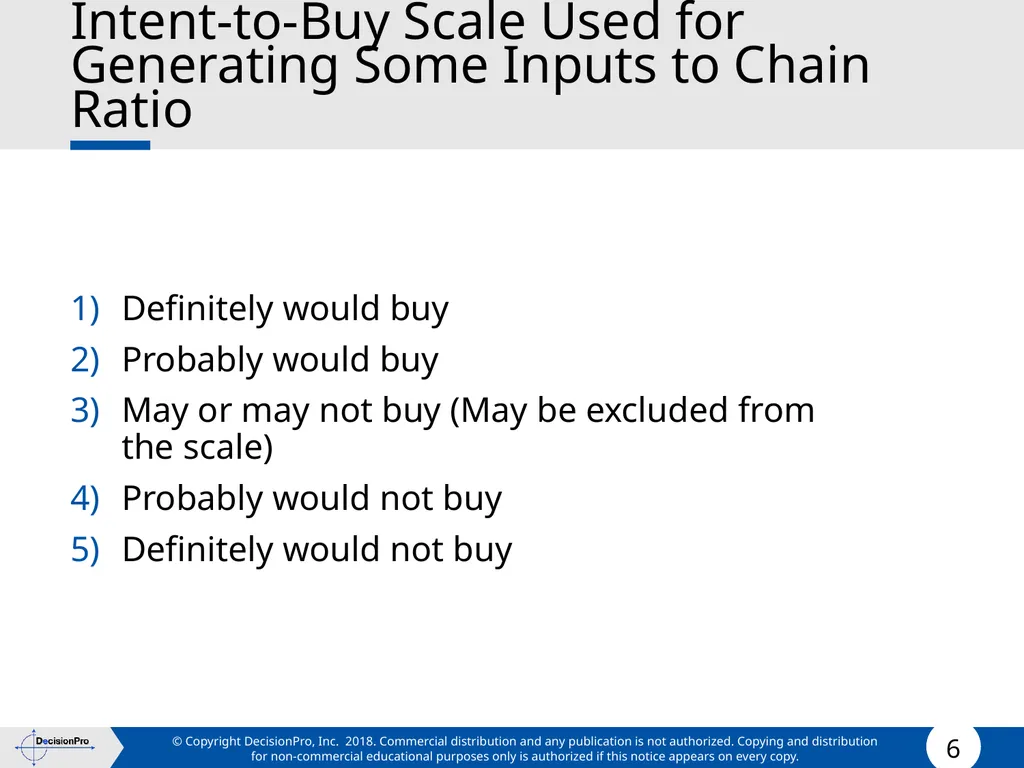
Intent-to-Buy Scale Used for Generating Some Inputs to Chain Ratio Definitely would buy
Probably would buy
May or may not buy (May be excluded from the scale)
Probably would not buy
Definitely would not buy<br>
Probably would buy
May or may not buy (May be excluded from the scale)
Probably would not buy
Definitely would not buy<br>
07
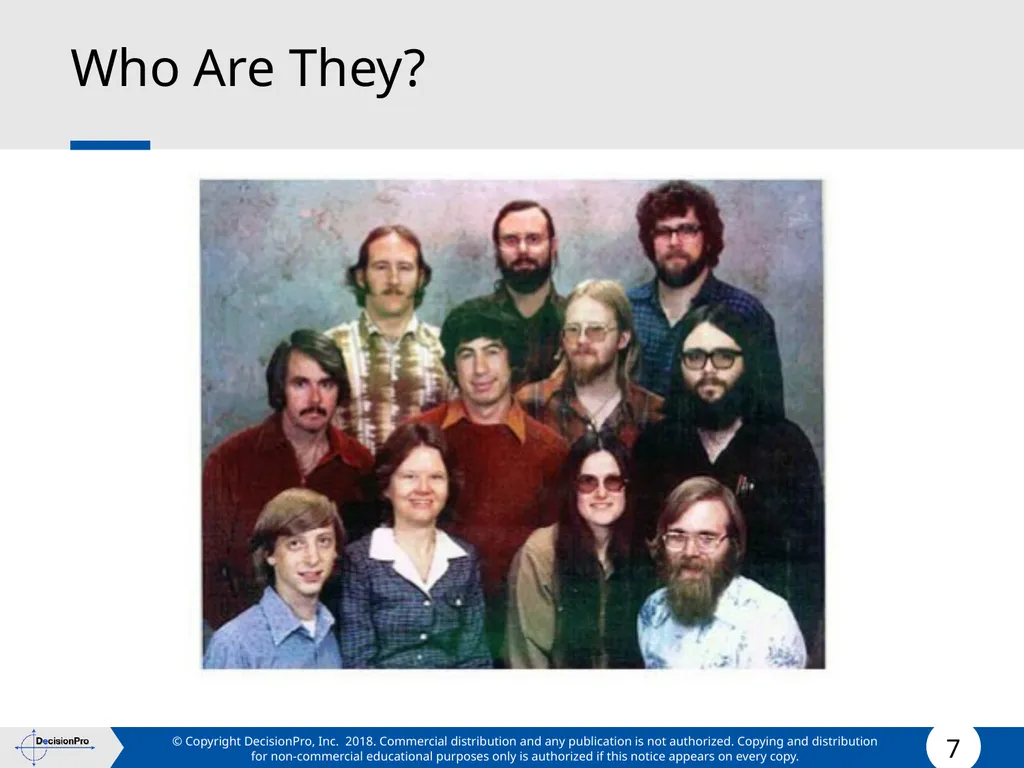
Who Are They?<br>
08
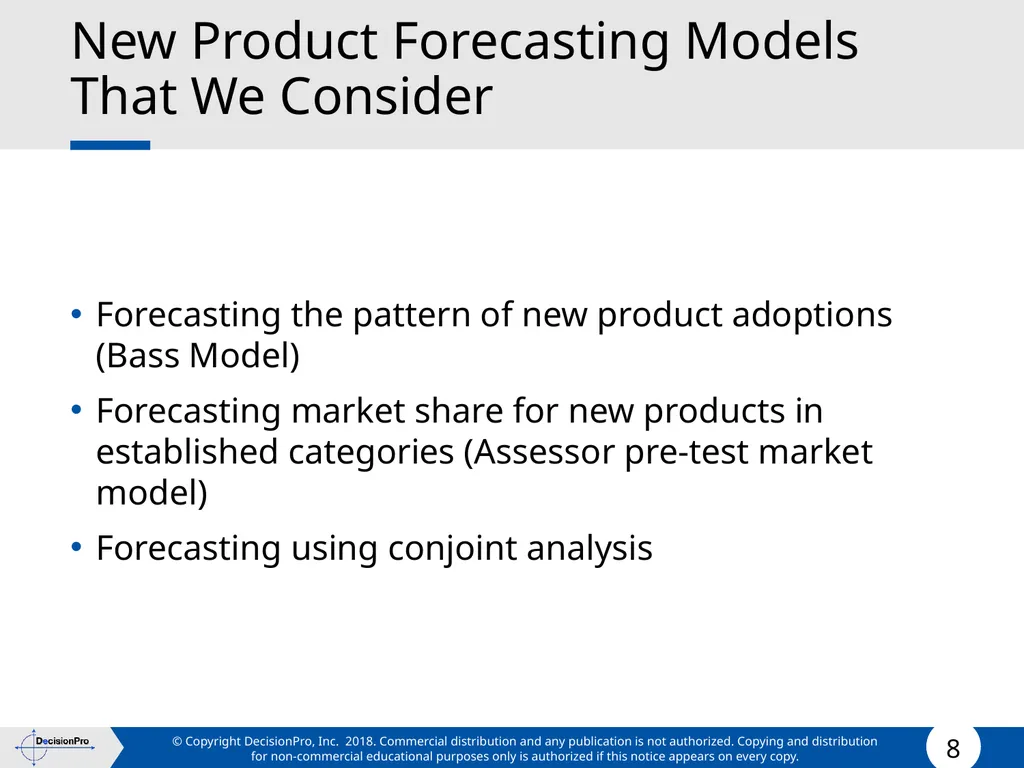
New Product Forecasting Models
That We Consider Forecasting the pattern of new product adoptions (Bass Model)
Forecasting market share for new products in established categories (Assessor pre-test market model)
Forecasting using conjoint analysis<br>
Forecasting market share for new products in established categories (Assessor pre-test market model)
Forecasting using conjoint analysis<br>
09
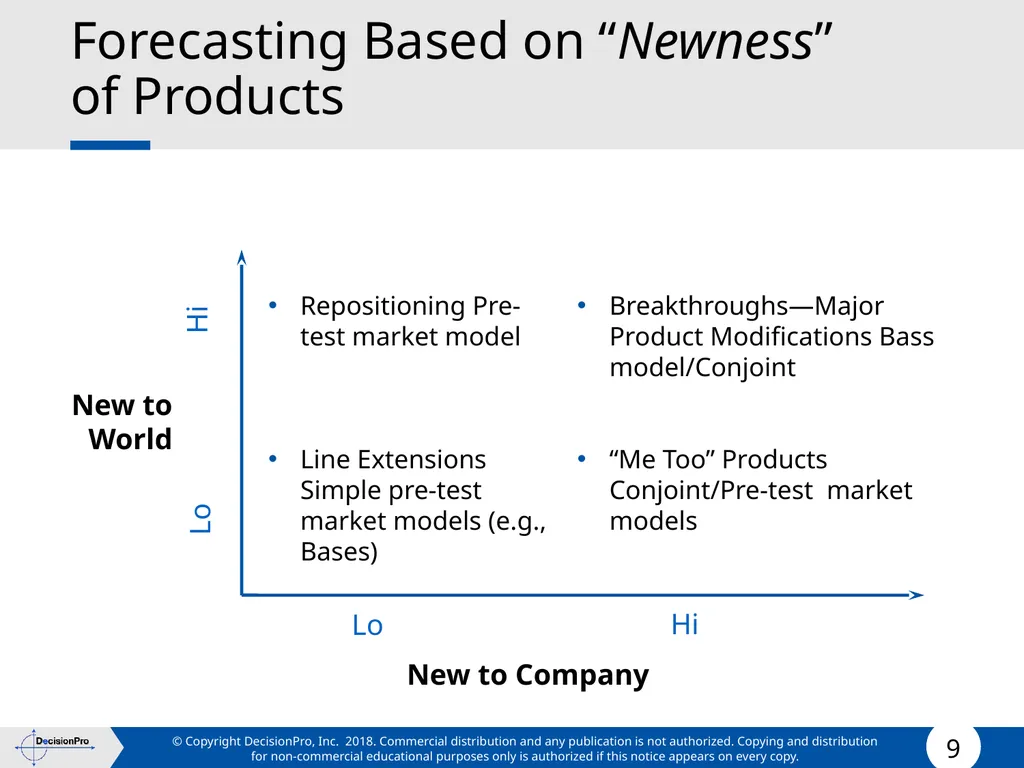
Forecasting Based on “Newness” of Products New to World New to Company Repositioning Pre-test market model
Line Extensions Simple pre-test market models (e.g., Bases) Breakthroughs—Major Product Modifications Bass model/Conjoint
“Me Too” Products Conjoint/Pre-test market models Lo Hi Lo Hi<br>
Line Extensions Simple pre-test market models (e.g., Bases) Breakthroughs—Major Product Modifications Bass model/Conjoint
“Me Too” Products Conjoint/Pre-test market models Lo Hi Lo Hi<br>
10
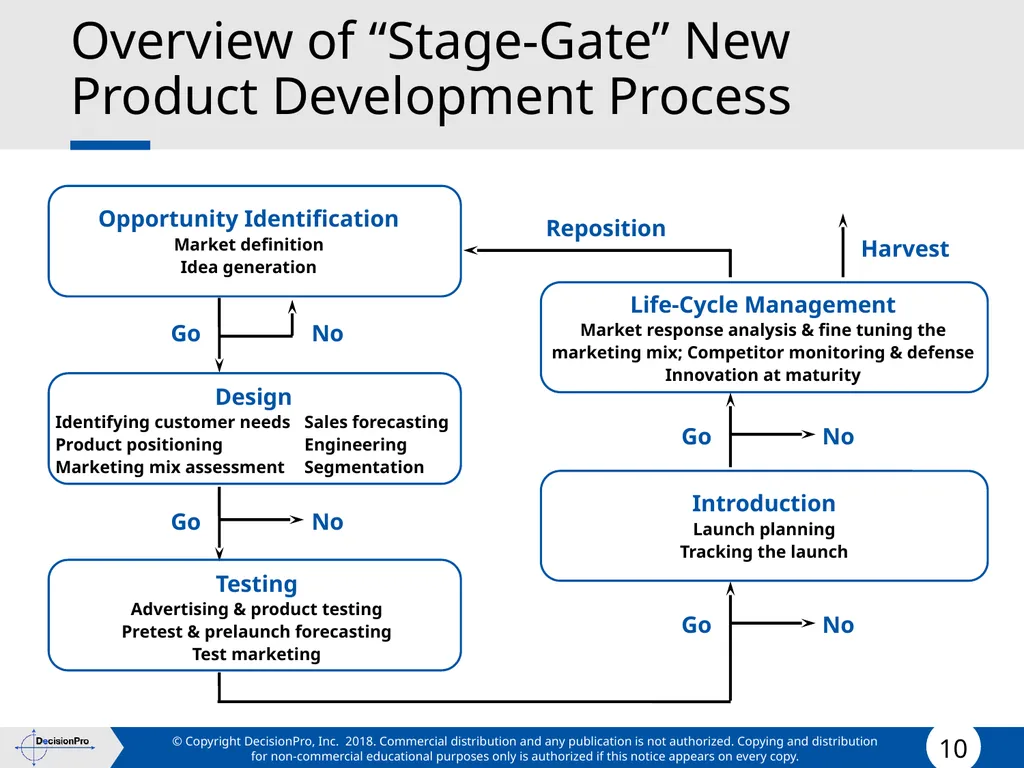
Overview of “Stage-Gate” New Product Development Process Design
Identifying customer needs Sales forecasting Product positioning Engineering Marketing mix assessment Segmentation Opportunity Identification
Market definition Idea generation Testing
Advertising & product testing Pretest & prelaunch forecasting Test marketing Introduction
Launch planning Tracking the launch Life-Cycle Management
Market response analysis & fine tuning the marketing mix; Competitor monitoring & defense Innovation at maturity Go No Go No Go No Go No Reposition Harvest<br>
Identifying customer needs Sales forecasting Product positioning Engineering Marketing mix assessment Segmentation Opportunity Identification
Market definition Idea generation Testing
Advertising & product testing Pretest & prelaunch forecasting Test marketing Introduction
Launch planning Tracking the launch Life-Cycle Management
Market response analysis & fine tuning the marketing mix; Competitor monitoring & defense Innovation at maturity Go No Go No Go No Go No Reposition Harvest<br>
11
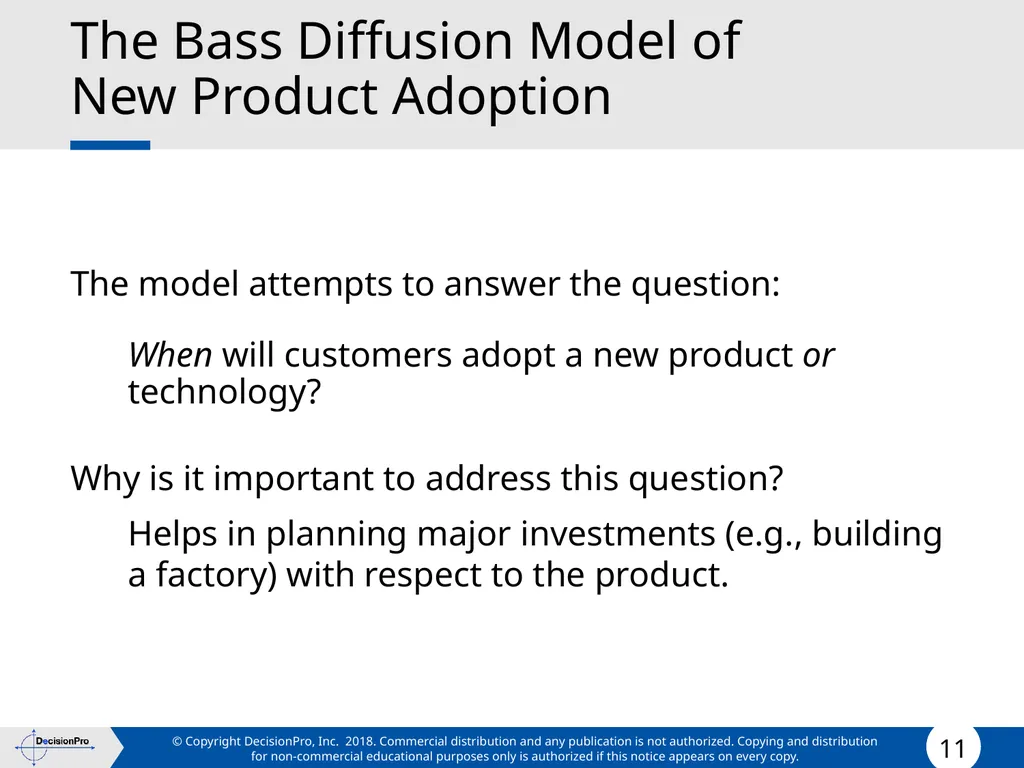
The Bass Diffusion Model of
New Product Adoption The model attempts to answer the question:
When will customers adopt a new product or technology?
Why is it important to address this question?
Helps in planning major investments (e.g., building a factory) with respect to the product.<br>
When will customers adopt a new product or technology?
Why is it important to address this question?
Helps in planning major investments (e.g., building a factory) with respect to the product.<br>
12
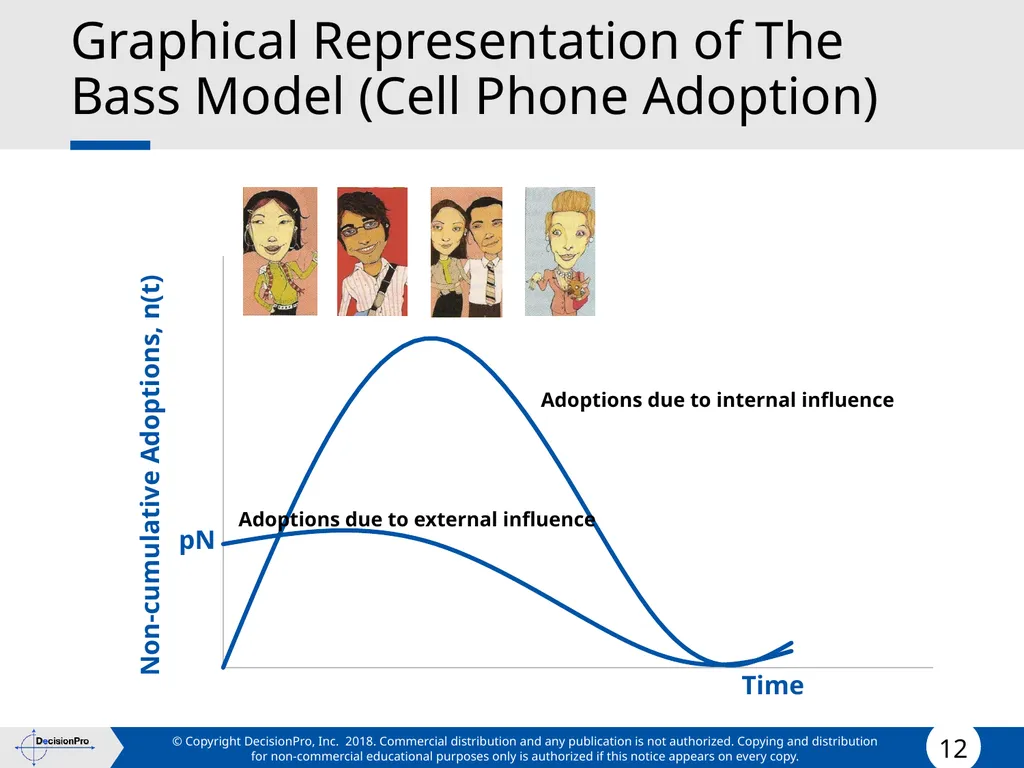
Graphical Representation of The Bass Model (Cell Phone Adoption) Time Non-cumulative Adoptions, n(t) pN Adoptions due to external influence Adoptions due to internal influence<br>
13
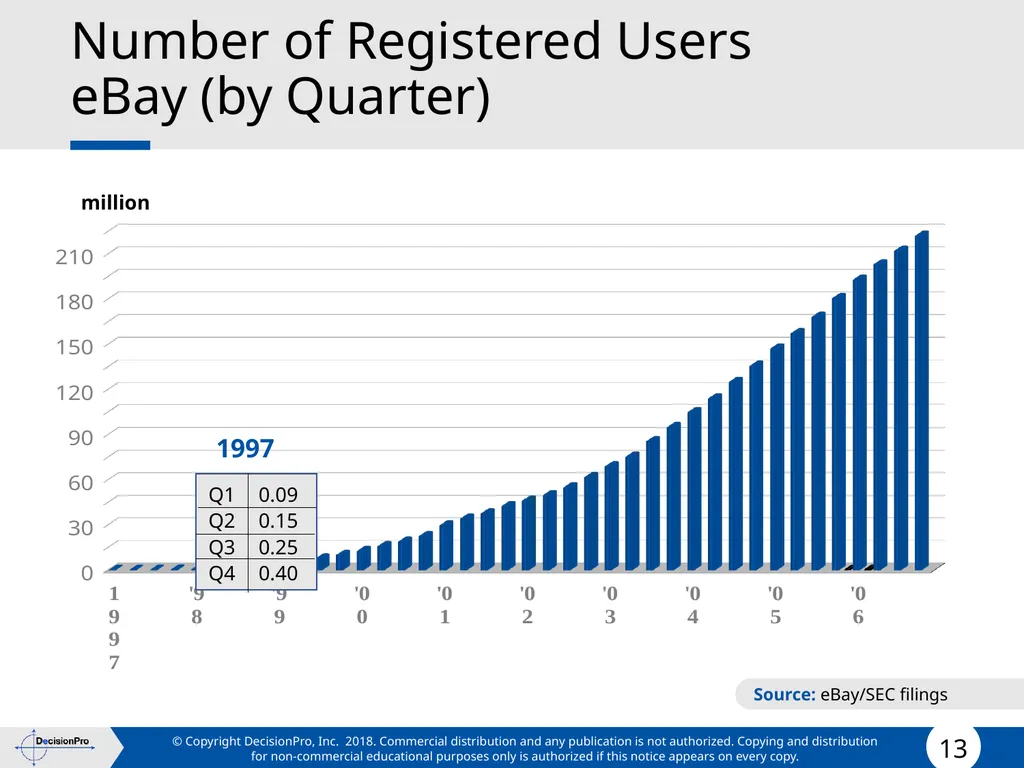
Number of Registered Users
eBay (by Quarter) million 1997 Q1
Q2
Q3
Q4 0.09
0.15
0.25
0.40 Source: eBay/SEC filings<br>
Q2
Q3
Q4 0.09
0.15
0.25
0.40 Source: eBay/SEC filings<br>
14
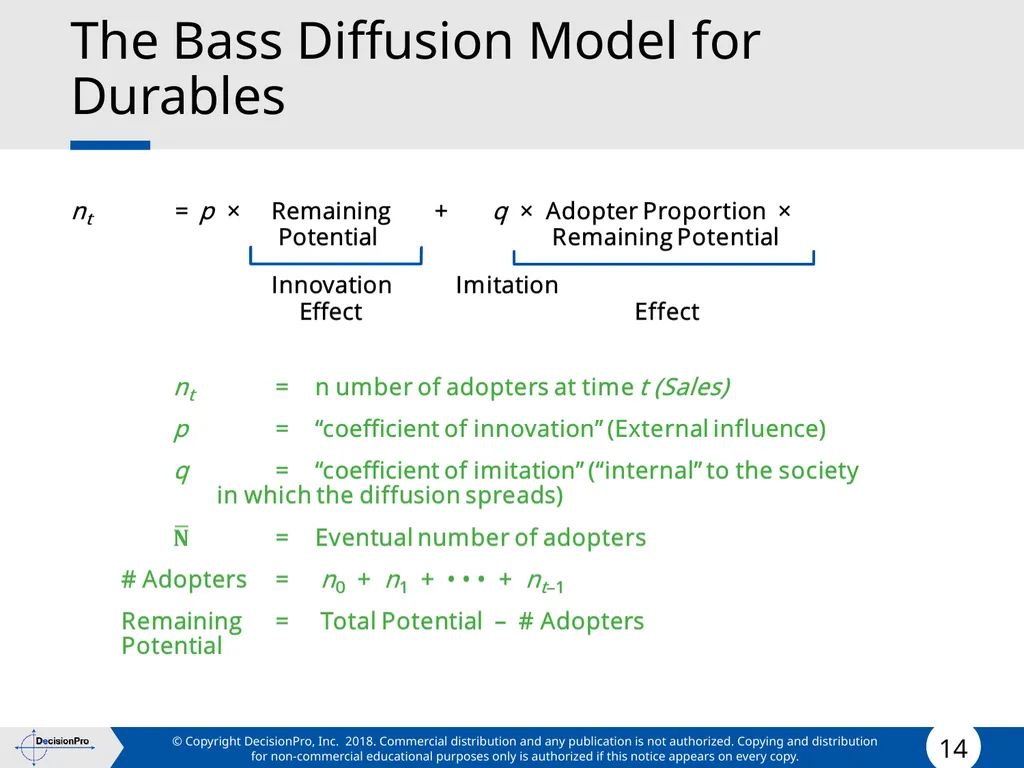
The Bass Diffusion Model for Durables<br>
15
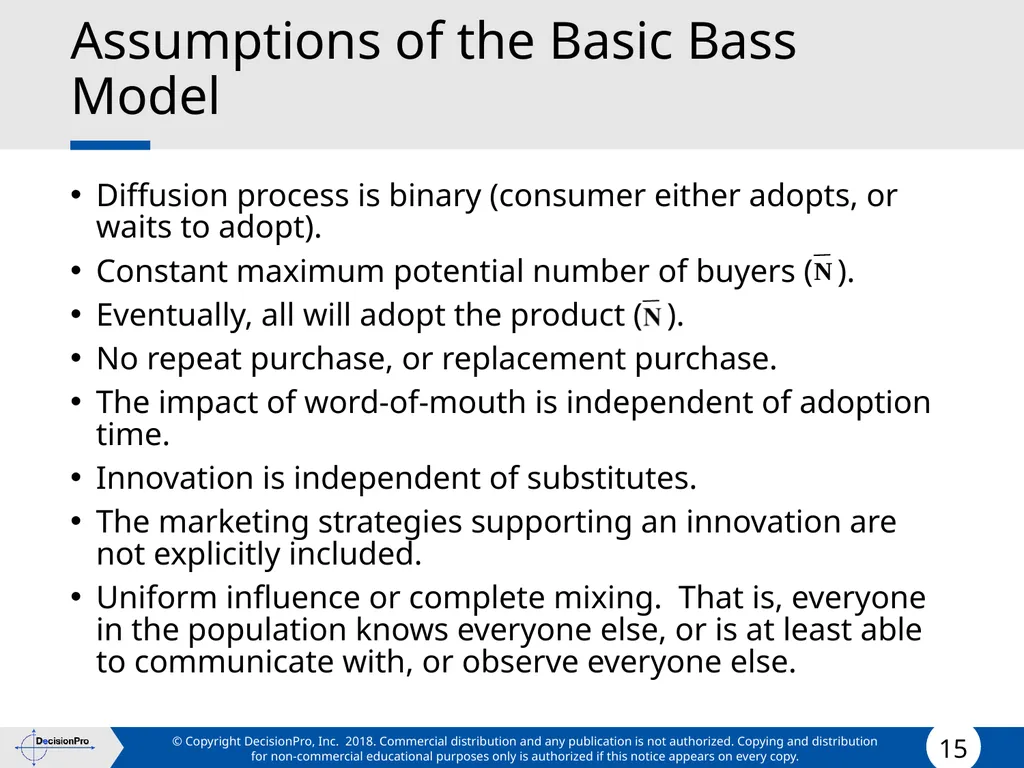
Assumptions of the Basic Bass Model Diffusion process is binary (consumer either adopts, or waits to adopt).
Constant maximum potential number of buyers ( ).
Eventually, all will adopt the product ( ).
No repeat purchase, or replacement purchase.
The impact of word-of-mouth is independent of adoption time.
Innovation is independent of substitutes.
The marketing strategies supporting an innovation are not explicitly included.
Uniform influence or complete mixing. That is, everyone in the population knows everyone else, or is at least able to communicate with, or observe everyone else.<br>
Constant maximum potential number of buyers ( ).
Eventually, all will adopt the product ( ).
No repeat purchase, or replacement purchase.
The impact of word-of-mouth is independent of adoption time.
Innovation is independent of substitutes.
The marketing strategies supporting an innovation are not explicitly included.
Uniform influence or complete mixing. That is, everyone in the population knows everyone else, or is at least able to communicate with, or observe everyone else.<br>
16
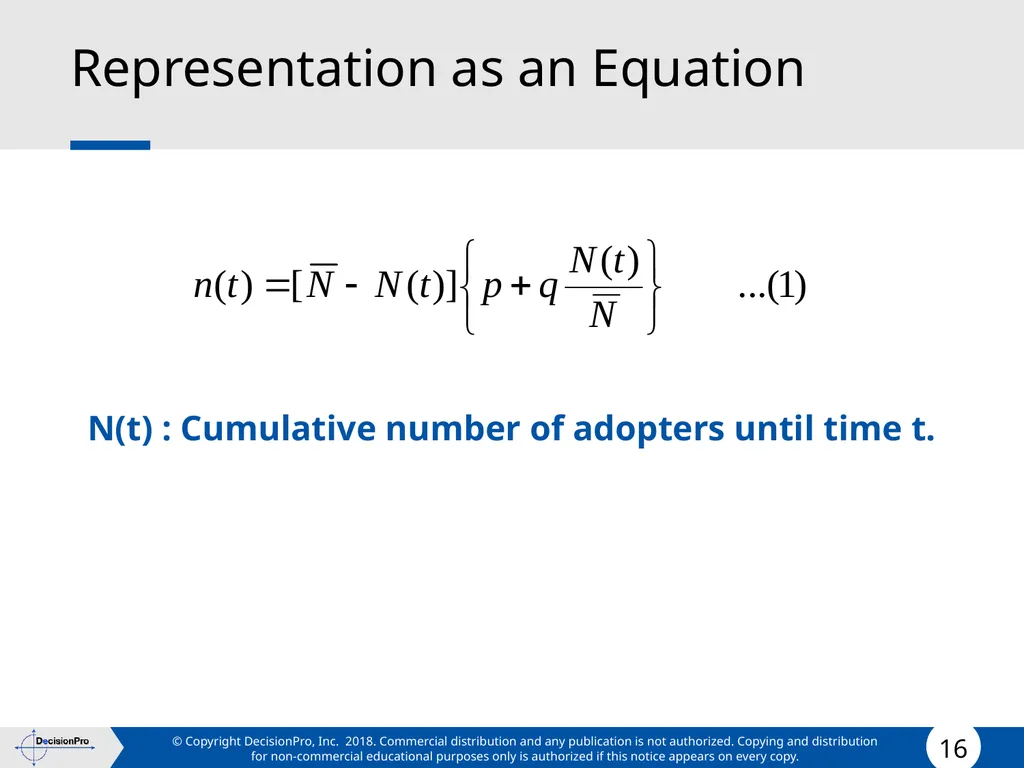
Representation as an Equation N(t) : Cumulative number of adopters until time t.<br>
17
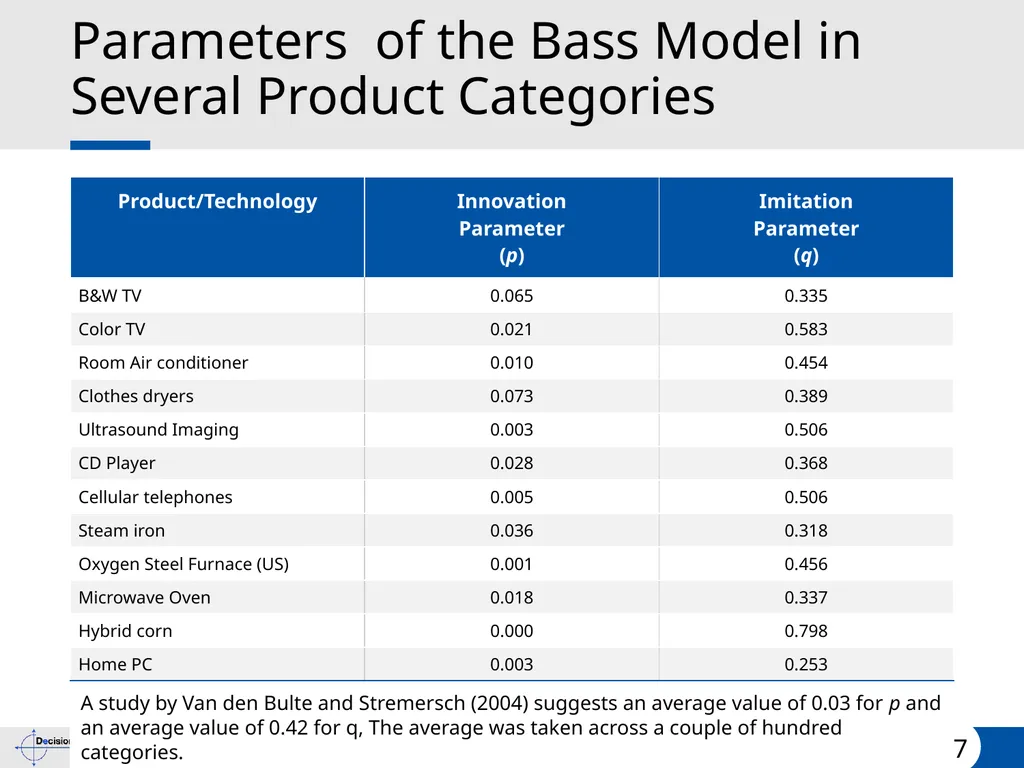
Parameters of the Bass Model in Several Product Categories<br>
18
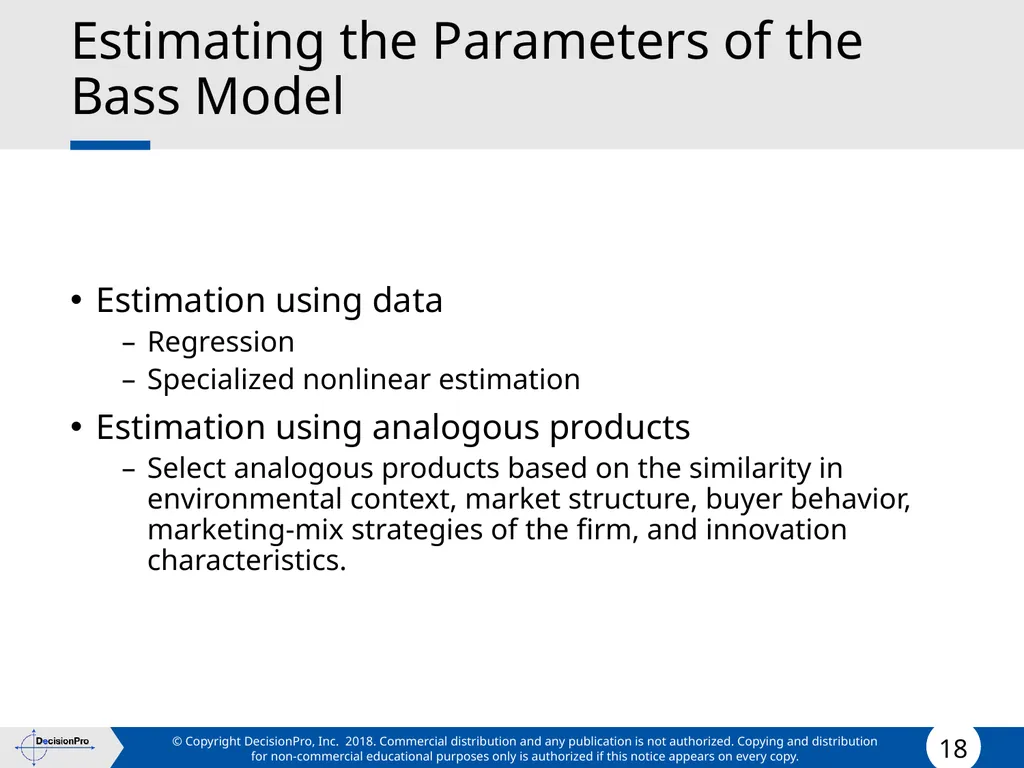
Estimating the Parameters of the
Bass Model Estimation using data
Regression
Specialized nonlinear estimation
Estimation using analogous products
Select analogous products based on the similarity in environmental context, market structure, buyer behavior, marketing-mix strategies of the firm, and innovation characteristics.<br>
Regression
Specialized nonlinear estimation
Estimation using analogous products
Select analogous products based on the similarity in environmental context, market structure, buyer behavior, marketing-mix strategies of the firm, and innovation characteristics.<br>
19
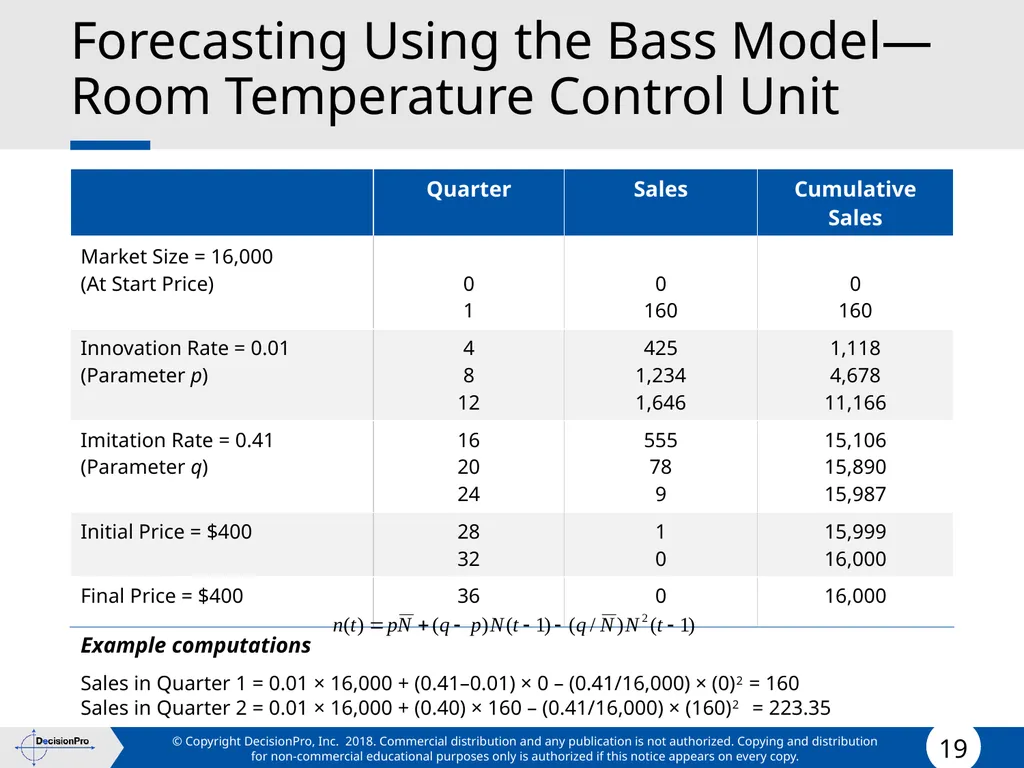
Forecasting Using the Bass Model—Room Temperature Control Unit<br>
20
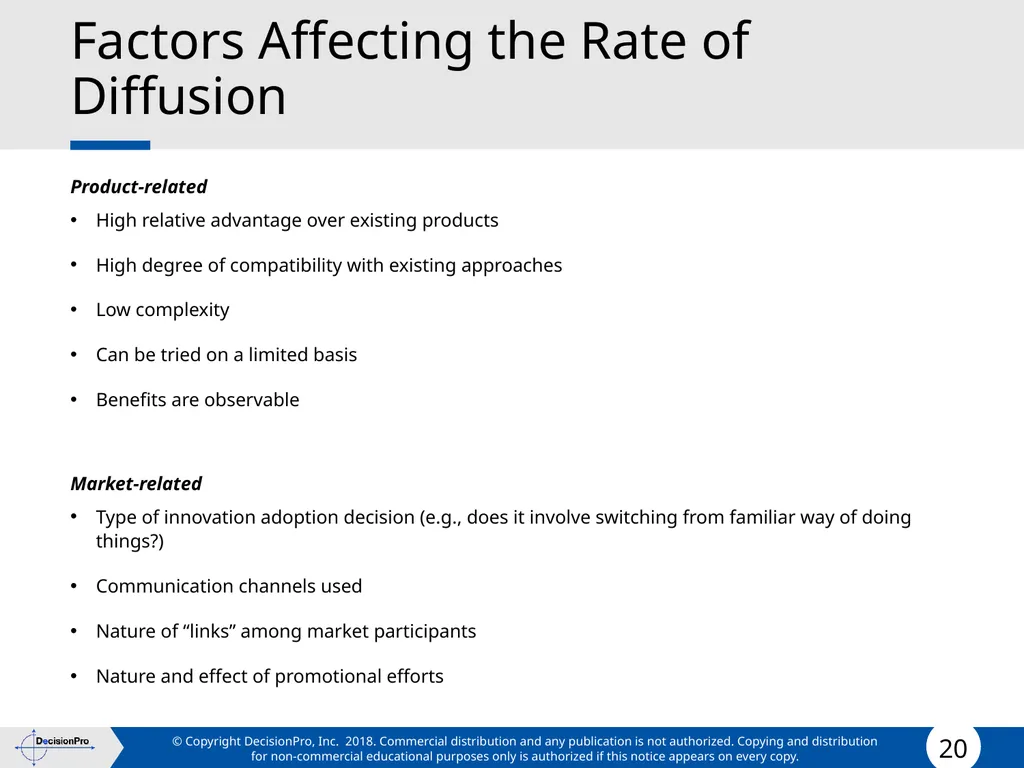
Factors Affecting the Rate of Diffusion Product-related
High relative advantage over existing products
High degree of compatibility with existing approaches
Low complexity
Can be tried on a limited basis
Benefits are observable
Market-related
Type of innovation adoption decision (e.g., does it involve switching from familiar way of doing things?)
Communication channels used
Nature of “links” among market participants
Nature and effect of promotional efforts<br>
High relative advantage over existing products
High degree of compatibility with existing approaches
Low complexity
Can be tried on a limited basis
Benefits are observable
Market-related
Type of innovation adoption decision (e.g., does it involve switching from familiar way of doing things?)
Communication channels used
Nature of “links” among market participants
Nature and effect of promotional efforts<br>
21
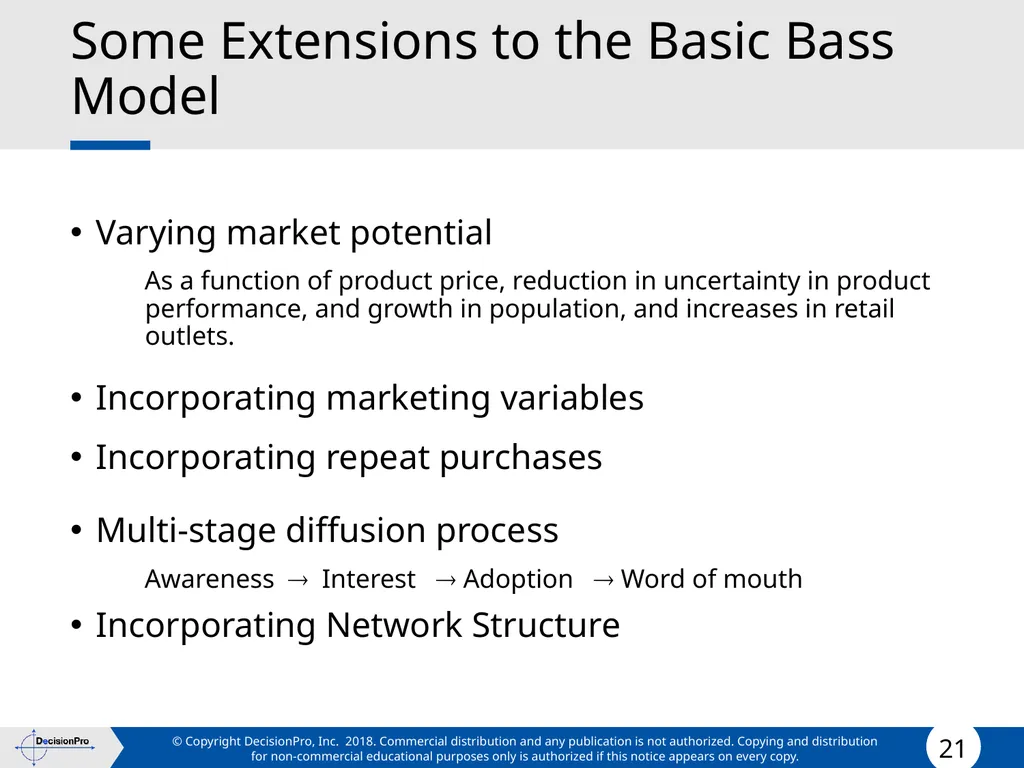
Some Extensions to the Basic Bass Model Varying market potential
As a function of product price, reduction in uncertainty in product performance, and growth in population, and increases in retail outlets.
Incorporating marketing variables
Incorporating repeat purchases
Multi-stage diffusion process
Awareness Interest Adoption Word of mouth
Incorporating Network Structure<br>
As a function of product price, reduction in uncertainty in product performance, and growth in population, and increases in retail outlets.
Incorporating marketing variables
Incorporating repeat purchases
Multi-stage diffusion process
Awareness Interest Adoption Word of mouth
Incorporating Network Structure<br>
22
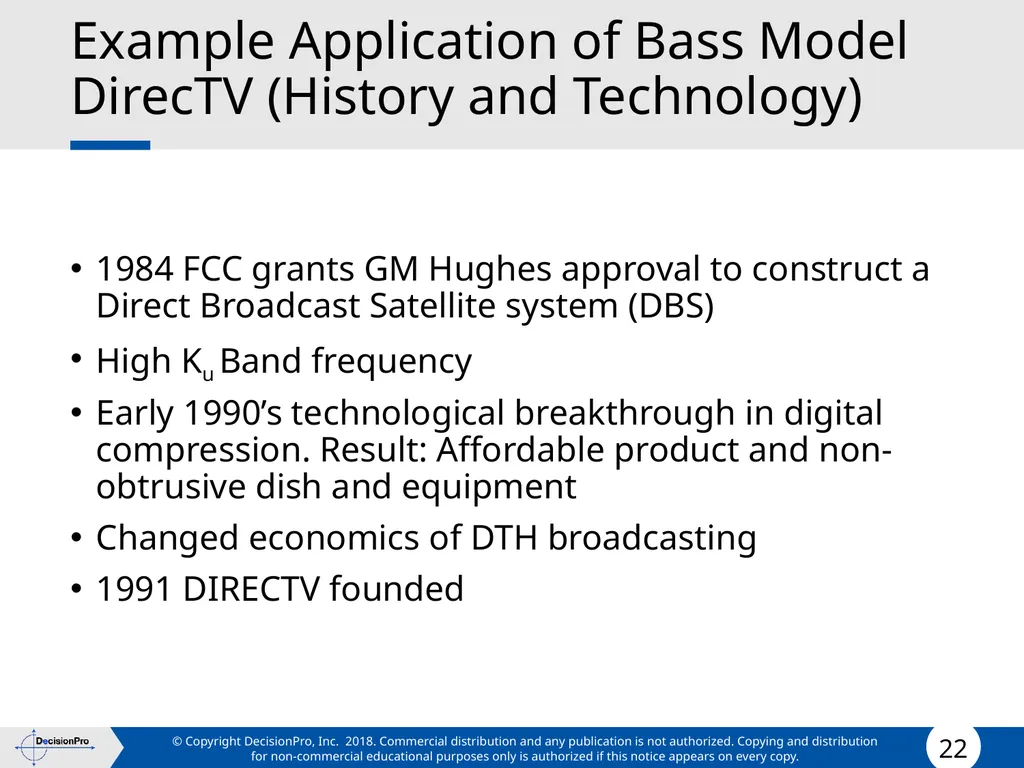
Example Application of Bass Model
DirecTV (History and Technology) 1984 FCC grants GM Hughes approval to construct a Direct Broadcast Satellite system (DBS)
High Ku Band frequency
Early 1990’s technological breakthrough in digital compression. Result: Affordable product and non-obtrusive dish and equipment
Changed economics of DTH broadcasting
1991 DIRECTV founded<br>
High Ku Band frequency
Early 1990’s technological breakthrough in digital compression. Result: Affordable product and non-obtrusive dish and equipment
Changed economics of DTH broadcasting
1991 DIRECTV founded<br>
23
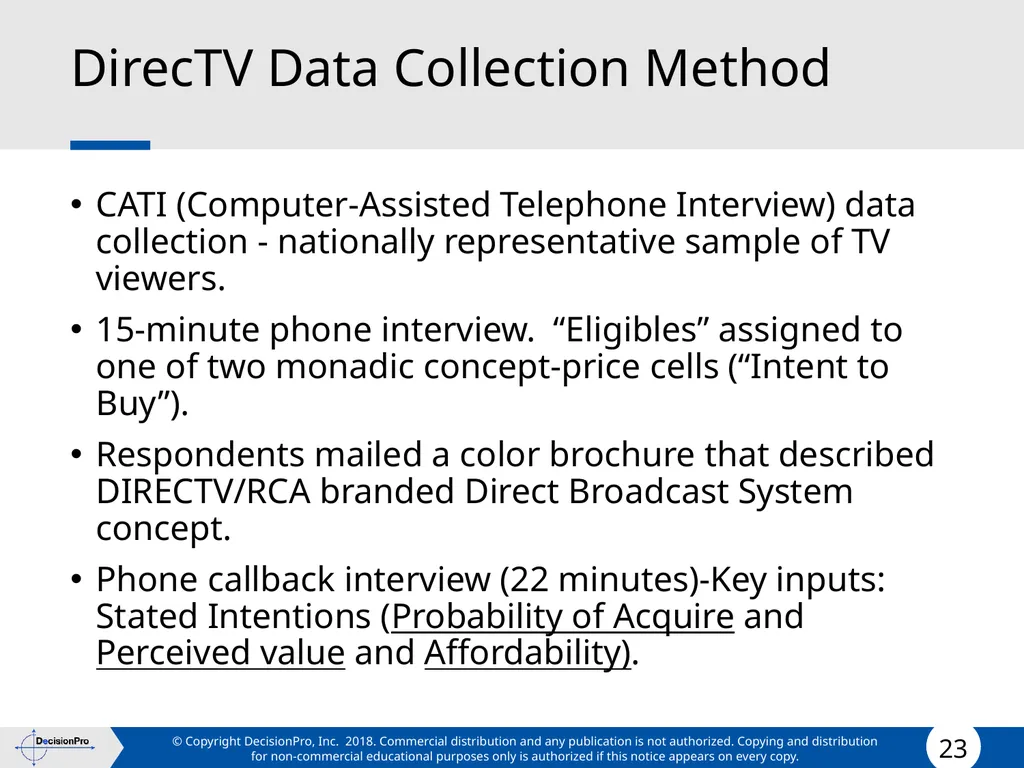
DirecTV Data Collection Method CATI (Computer-Assisted Telephone Interview) data collection - nationally representative sample of TV viewers.
15-minute phone interview. “Eligibles” assigned to one of two monadic concept-price cells (“Intent to Buy”).
Respondents mailed a color brochure that described DIRECTV/RCA branded Direct Broadcast System concept.
Phone callback interview (22 minutes)-Key inputs: Stated Intentions (Probability of Acquire and Perceived value and Affordability).<br>
15-minute phone interview. “Eligibles” assigned to one of two monadic concept-price cells (“Intent to Buy”).
Respondents mailed a color brochure that described DIRECTV/RCA branded Direct Broadcast System concept.
Phone callback interview (22 minutes)-Key inputs: Stated Intentions (Probability of Acquire and Perceived value and Affordability).<br>
24
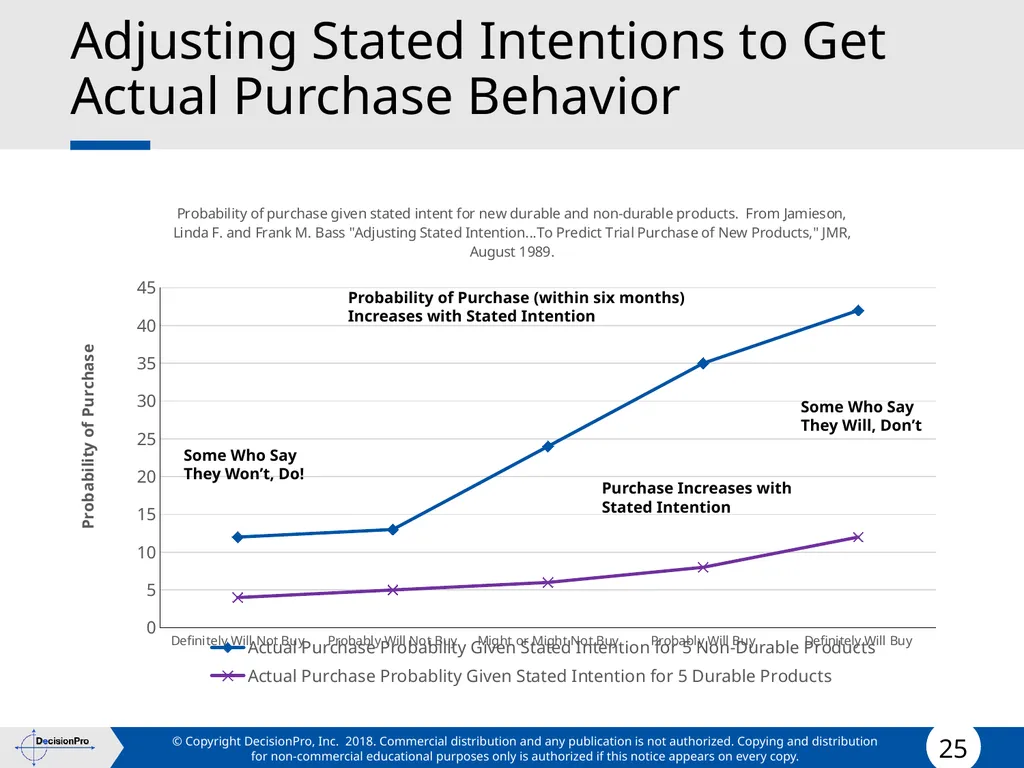
Adjusting Stated Intentions to Get Actual Purchase Behavior Some Who Say
They Won’t, Do! Some Who Say
They Will, Don’t Probability of Purchase (within six months)
Increases with Stated Intention Purchase Increases with
Stated Intention<br>
They Won’t, Do! Some Who Say
They Will, Don’t Probability of Purchase (within six months)
Increases with Stated Intention Purchase Increases with
Stated Intention<br>
25
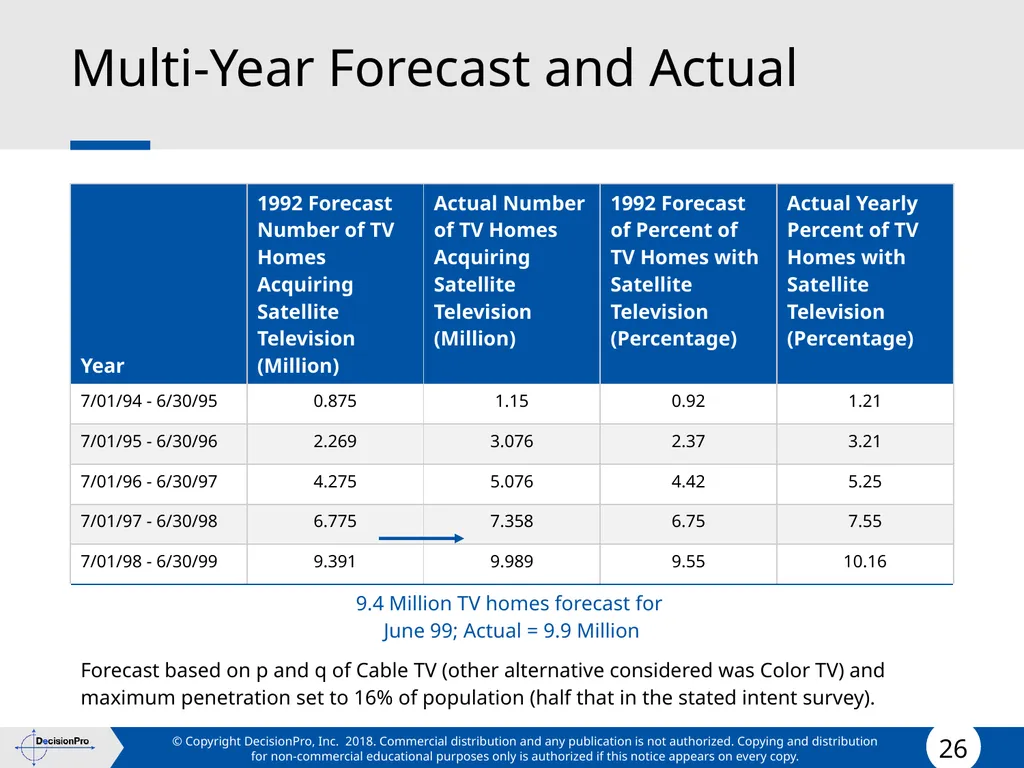
Multi-Year Forecast and Actual<br>
26
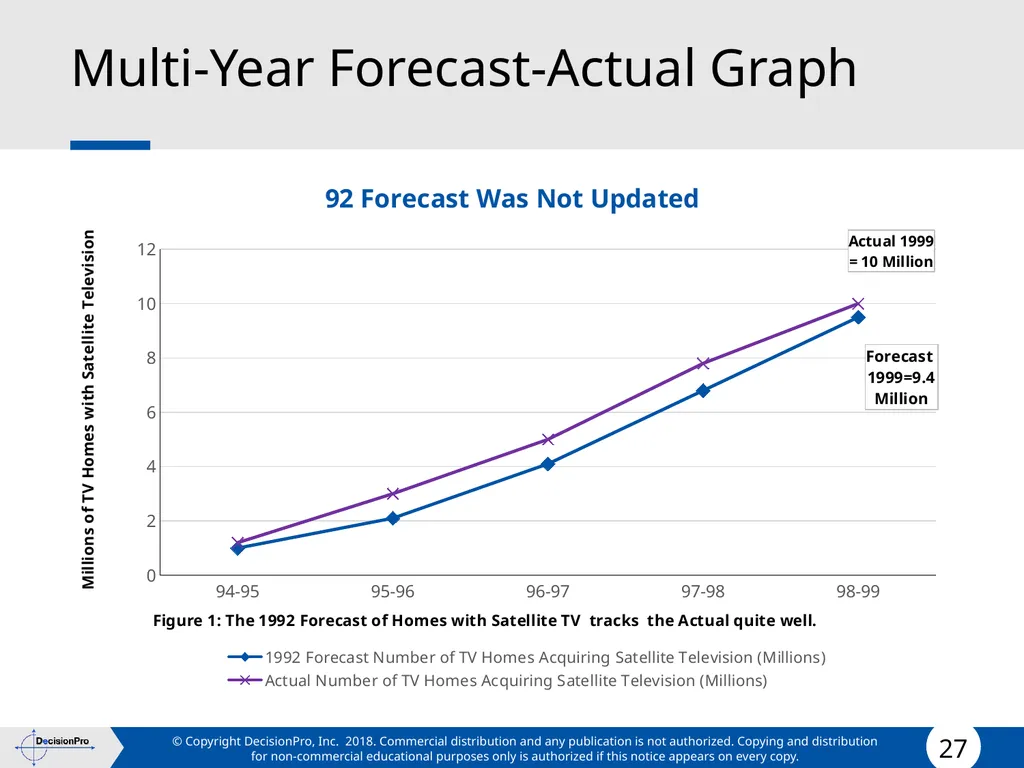
Multi-Year Forecast-Actual Graph<br>
27
Using Scenario Analysis for Calibrating the Bass Model Structure a scenario as a flowing narrative, not as a set of numerical parameters. Include verbal descriptions such as “rapid experience effects,” “FCC adoption of digital standard,” etc. Ideally, each scenario should also include how the situation described in the scenario will be reached from the present position.
Construct several scenarios that capture the richness and range of the “possibilities” relevant to a decision situation. Describe all the scenarios in the same manner, i.e., one is not more “vivid” than another. Focus your further analyses on scenarios that are internally consistent and plausible. Develop forecasts and strategies that are compatible with the scenarios. The strategies include:
Robust actions that are resilient across scenarios (e.g., hedging, concurrent pursuit of multiple options, etc.)
Contingent actions that postpone major commitments to the future.<br>
Construct several scenarios that capture the richness and range of the “possibilities” relevant to a decision situation. Describe all the scenarios in the same manner, i.e., one is not more “vivid” than another. Focus your further analyses on scenarios that are internally consistent and plausible. Develop forecasts and strategies that are compatible with the scenarios. The strategies include:
Robust actions that are resilient across scenarios (e.g., hedging, concurrent pursuit of multiple options, etc.)
Contingent actions that postpone major commitments to the future.<br>
28
Steps in Scenario Planning
(Example for Zenith HDTV) Identify the major stakeholders.
Summarize the core trends that are relevant (technological, economic, social, etc.) within the time frame of interest.
Articulate the main uncertainties (e.g., TV studio adoption of new filming methods).
Construct an initial set of scenarios.
Assess the consistency and plausibility of the scenarios.
Create “themes” (i.e., a story with a name) that combine some trends into meaningful composites (e.g., a Japanese domination of hardware and American domination of software).
Identify areas where you need more research (e.g., consumer acceptance) and seek additional information.
Associate the final set of scenarios with potential product analogs for diffusion model, select p and q, and generate the forecasts.
Evaluate strategic and tactical choices that will help you realize the forecasts in the most cost effective manner.<br>
Summarize the core trends that are relevant (technological, economic, social, etc.) within the time frame of interest.
Articulate the main uncertainties (e.g., TV studio adoption of new filming methods).
Construct an initial set of scenarios.
Assess the consistency and plausibility of the scenarios.
Create “themes” (i.e., a story with a name) that combine some trends into meaningful composites (e.g., a Japanese domination of hardware and American domination of software).
Identify areas where you need more research (e.g., consumer acceptance) and seek additional information.
Associate the final set of scenarios with potential product analogs for diffusion model, select p and q, and generate the forecasts.
Evaluate strategic and tactical choices that will help you realize the forecasts in the most cost effective manner.<br>
29
Example “Middle of the Road” Scenario (Zenith HDTV case) The FCC makes a commitment to the 16:9 NTSC HDTV standard in 1994, with promises to release details in a year. Initial HDTV sets cost over $3,000 and are seen as a luxury item, little programming is available so new features (such as use as computer monitors and compatibility with analog signals) are integrated to justify purchases. Art studios and other display locations become innovators as they purchase units for displays. Interior designers realize the benefits of HDTV plasma screens and suggest purchases to their wealthiest clients. HDTV becomes a “nouveau riche” item, a status symbol much like luxury cars. By 2000, the manufacturing costs of Plasma and other flat-screen displays decrease drastically from standards integration and increased competition. Middle-class customers can now afford HDTV displays. The movie industry embraces digital recordings because of the ease in editing and persistent quality. New movie features (screen and TV) are filmed in 16:9 digital format. Subsequent releases on DVD show higher quality. Public TV stations cannot justify the cost of upgrading, but cable channels such as HBO and Showtime commit to upgrading in 2003. Their recent entry into movie-making and their purchase of new high-tech digital recording equipment coincides with the need to upgrade transmission hardware. Customers are then driven to adopt technology not for increased quality on regular programming, but for movie watching, design, and display of other items.<br>
30
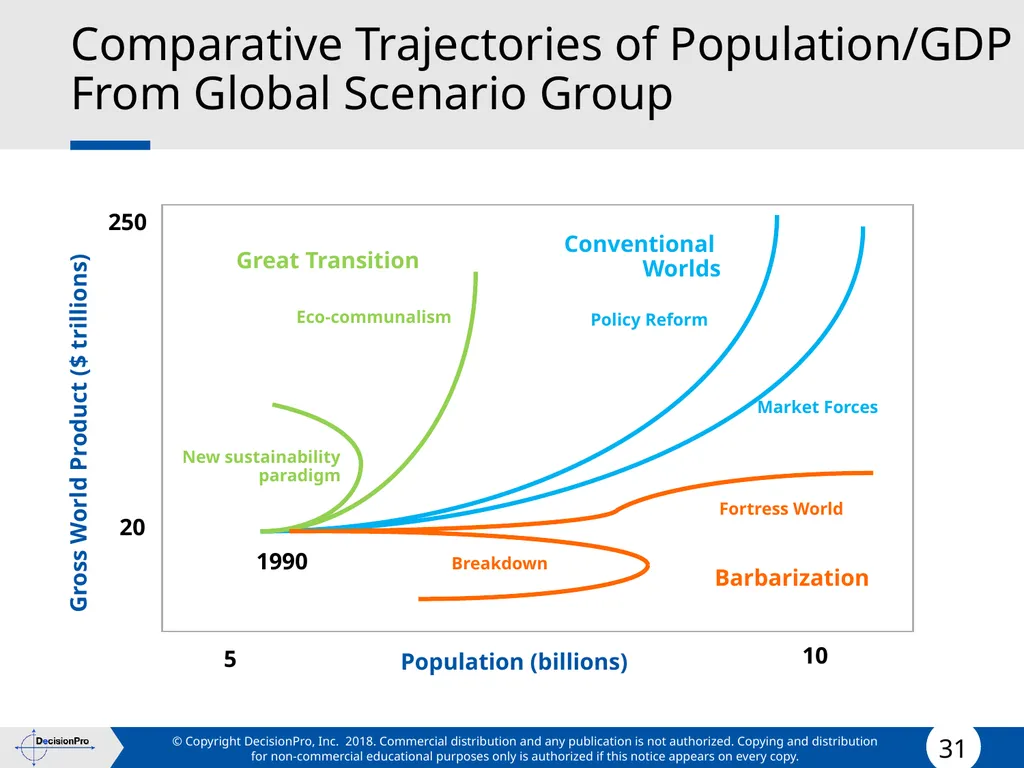
Comparative Trajectories of Population/GDP From Global Scenario Group Population (billions) Gross World Product ($ trillions) 1990 10 5 20 250 Great Transition Conventional
Worlds Barbarization Fortress World Breakdown Policy Reform Market Forces Eco-communalism New sustainability
paradigm<br>
Worlds Barbarization Fortress World Breakdown Policy Reform Market Forces Eco-communalism New sustainability
paradigm<br>
31
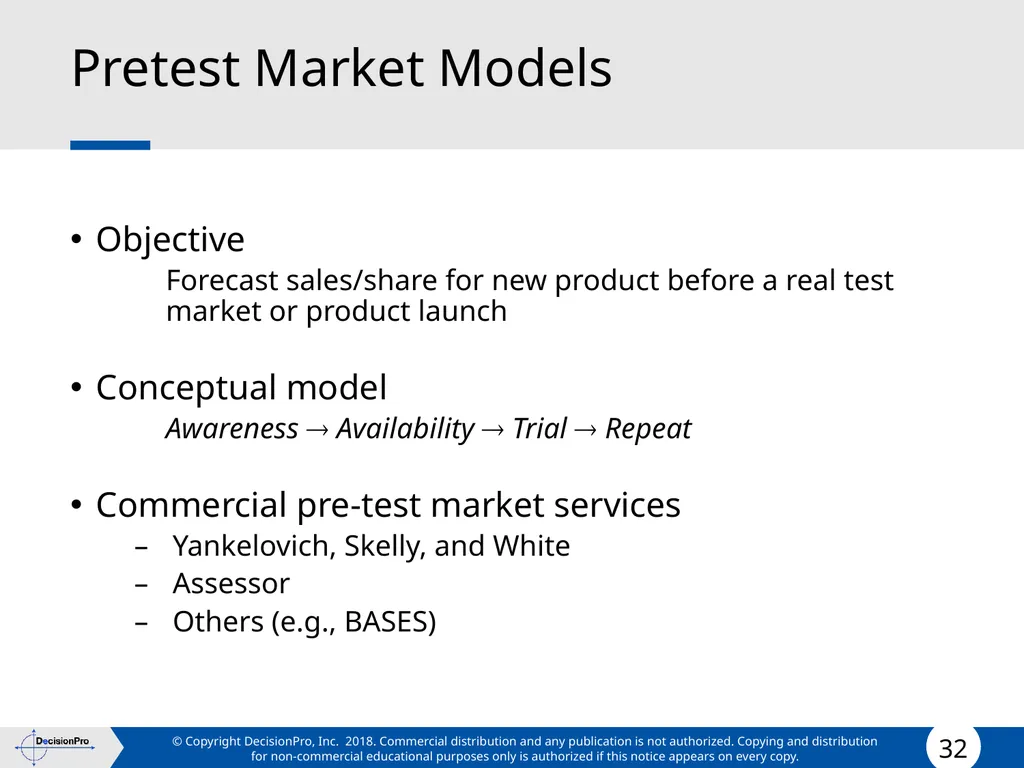
Pretest Market Models Objective
Forecast sales/share for new product before a real test market or product launch
Conceptual model
Awareness Availability Trial Repeat
Commercial pre-test market services
Yankelovich, Skelly, and White
Assessor
Others (e.g., BASES)<br>
Forecast sales/share for new product before a real test market or product launch
Conceptual model
Awareness Availability Trial Repeat
Commercial pre-test market services
Yankelovich, Skelly, and White
Assessor
Others (e.g., BASES)<br>
32
Yankelovich, Skelly and White Model (Chain Ratio Method) Forecast market share = S × N × C × R × U × K
where:
S = Lab store sales (indicator of trial),
N = Novelty factor of being in lab market. Discount sales by 20–40% based on previous experience that relate trial in lab markets to trial in actual markets,
C = Clout factor which retains between 25% and 75% of SN determined, based on proposed marketing effort versus ad and distribution weights of existing brands in relation to their market share,
R = Repurchase rate based on percentage of those trying who repurchase,
U = Usage rate based on usage frequency of new product as compared to the new product category as a whole, and
K = Judgmental factor based on comparison of S ´ N ´ C ´ R ´ U ´ K with Yankelovich norms. The comparison is with respect to factors such as size and growth of category, new product’s share derived from category expansion versus conversion from existing brand.<br>
where:
S = Lab store sales (indicator of trial),
N = Novelty factor of being in lab market. Discount sales by 20–40% based on previous experience that relate trial in lab markets to trial in actual markets,
C = Clout factor which retains between 25% and 75% of SN determined, based on proposed marketing effort versus ad and distribution weights of existing brands in relation to their market share,
R = Repurchase rate based on percentage of those trying who repurchase,
U = Usage rate based on usage frequency of new product as compared to the new product category as a whole, and
K = Judgmental factor based on comparison of S ´ N ´ C ´ R ´ U ´ K with Yankelovich norms. The comparison is with respect to factors such as size and growth of category, new product’s share derived from category expansion versus conversion from existing brand.<br>
33
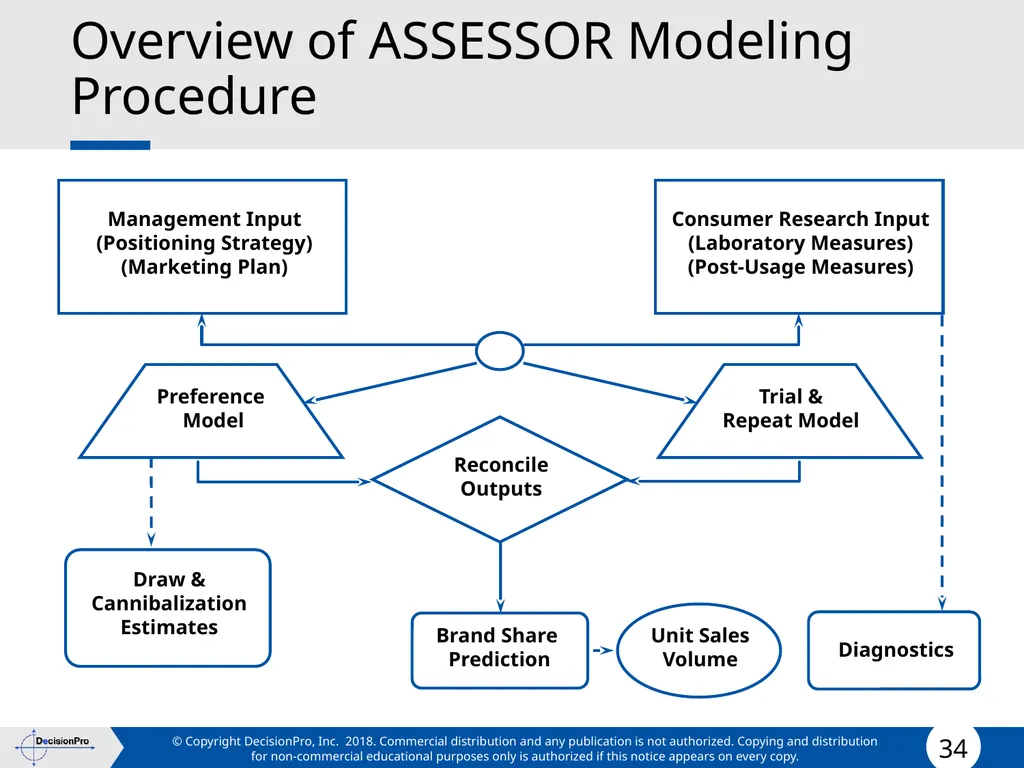
Overview of ASSESSOR Modeling Procedure Management Input
(Positioning Strategy)
(Marketing Plan) Reconcile
Outputs Draw &
Cannibalization
Estimates Diagnostics Unit Sales
Volume Preference
Model Trial &
Repeat Model Brand Share
Prediction Consumer Research Input
(Laboratory Measures)
(Post-Usage Measures)<br>
(Positioning Strategy)
(Marketing Plan) Reconcile
Outputs Draw &
Cannibalization
Estimates Diagnostics Unit Sales
Volume Preference
Model Trial &
Repeat Model Brand Share
Prediction Consumer Research Input
(Laboratory Measures)
(Post-Usage Measures)<br>
34
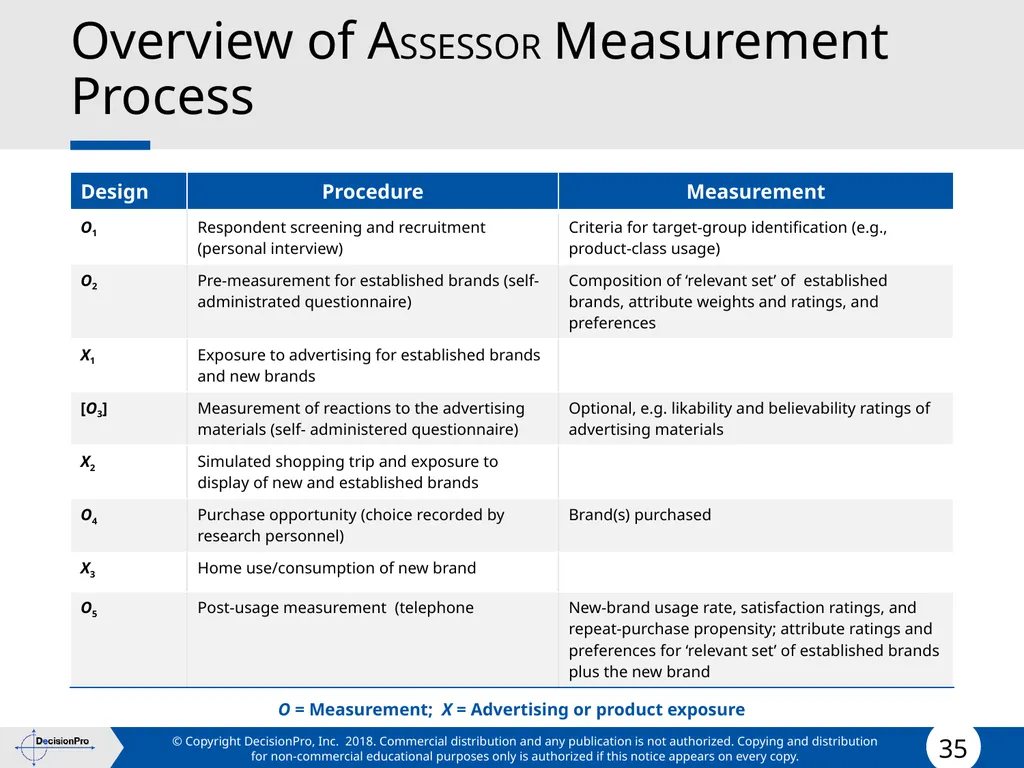
Overview of ASSESSOR Measurement Process<br>
35
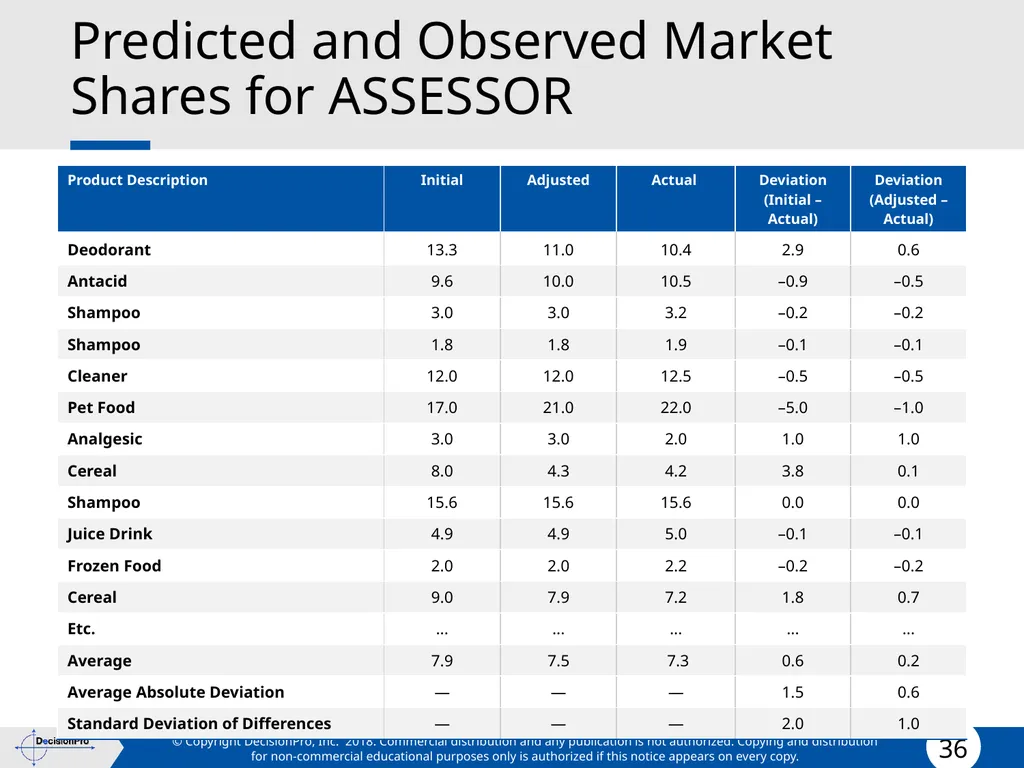
Predicted and Observed Market Shares for ASSESSOR<br>
36
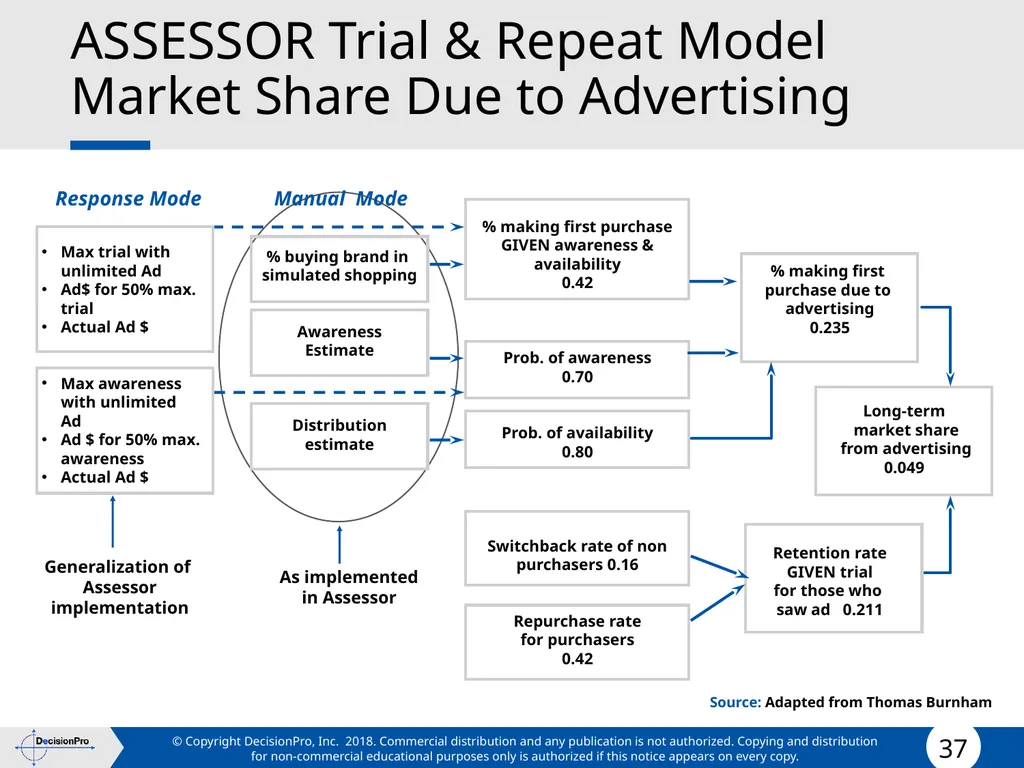
ASSESSOR Trial & Repeat Model
Market Share Due to Advertising Source: Adapted from Thomas Burnham Max trial with unlimited Ad
Ad$ for 50% max. trial
Actual Ad $
Max awareness with unlimited Ad
Ad $ for 50% max. awareness
Actual Ad $ % buying brand in
simulated shopping
Awareness
Estimate
Distribution estimate % making first purchase
GIVEN awareness &
availability
0.42
Prob. of awareness
0.70
Prob. of availability
0.80
Switchback rate of non
purchasers 0.16
Repurchase rate
for purchasers
0.42 % making first
purchase due to
advertising
0.235
Retention rate
GIVEN trial
for those who
saw ad 0.211 Response Mode Manual Mode Long-term
market share
from advertising
0.049 As implemented in Assessor Generalization of
Assessor
implementation<br>
Ad$ for 50% max. trial
Actual Ad $
Max awareness with unlimited Ad
Ad $ for 50% max. awareness
Actual Ad $ % buying brand in
simulated shopping
Awareness
Estimate
Distribution estimate % making first purchase
GIVEN awareness &
availability
0.42
Prob. of awareness
0.70
Prob. of availability
0.80
Switchback rate of non
purchasers 0.16
Repurchase rate
for purchasers
0.42 % making first
purchase due to
advertising
0.235
Retention rate
GIVEN trial
for those who
saw ad 0.211 Response Mode Manual Mode Long-term
market share
from advertising
0.049 As implemented in Assessor Generalization of
Assessor
implementation<br>
37
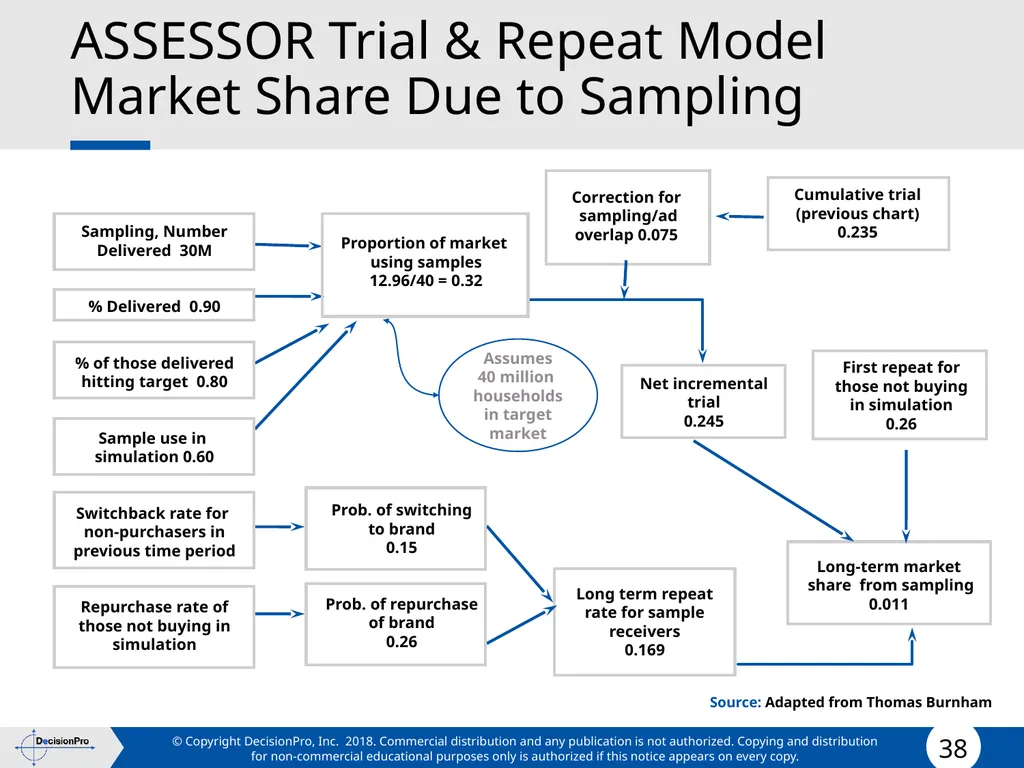
ASSESSOR Trial & Repeat Model
Market Share Due to Sampling Sampling, Number
Delivered 30M
% Delivered 0.90
% of those delivered
hitting target 0.80
Sample use in
simulation 0.60
Switchback rate for
non-purchasers in
previous time period
Repurchase rate of
those not buying in
simulation Prob. of switching
to brand
0.15
Prob. of repurchase
of brand
0.26 Long-term market
share from sampling
0.011 Cumulative trial
(previous chart)
0.235 Long term repeat rate for sample receivers
0.169 Correction for
sampling/ad
overlap 0.075 Proportion of market
using samples
12.96/40 = 0.32 Net incremental
trial
0.245 Assumes
40 million
households
in target
market First repeat for those not buying in simulation
0.26 Source: Adapted from Thomas Burnham<br>
Delivered 30M
% Delivered 0.90
% of those delivered
hitting target 0.80
Sample use in
simulation 0.60
Switchback rate for
non-purchasers in
previous time period
Repurchase rate of
those not buying in
simulation Prob. of switching
to brand
0.15
Prob. of repurchase
of brand
0.26 Long-term market
share from sampling
0.011 Cumulative trial
(previous chart)
0.235 Long term repeat rate for sample receivers
0.169 Correction for
sampling/ad
overlap 0.075 Proportion of market
using samples
12.96/40 = 0.32 Net incremental
trial
0.245 Assumes
40 million
households
in target
market First repeat for those not buying in simulation
0.26 Source: Adapted from Thomas Burnham<br>
38
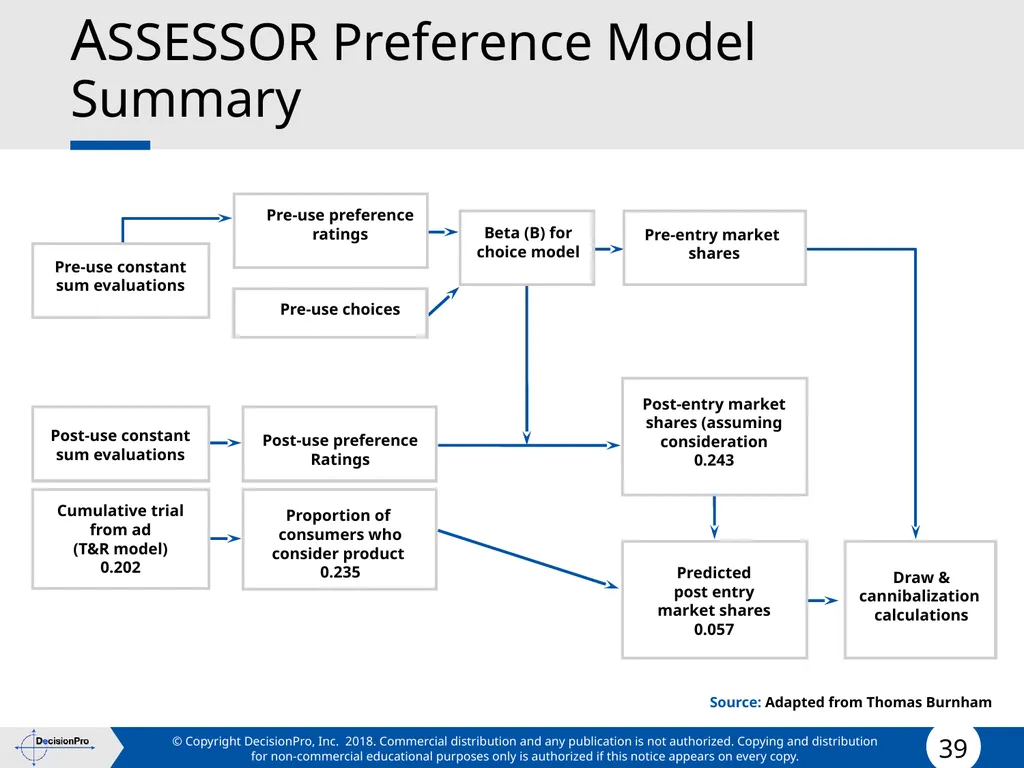
ASSESSOR Preference Model Summary Pre-use constant
sum evaluations
Post-use constant
sum evaluations
Cumulative trial
from ad
(T&R model)
0.202 Beta (B) for
choice model Pre-entry market
shares
Post-entry market
shares (assuming
consideration
0.243
Predicted
post entry
market shares
0.057 Pre-use preference
ratings
Pre-use choices
Post-use preference
Ratings
Proportion of
consumers who
consider product
0.235 Draw &
cannibalization
calculations Source: Adapted from Thomas Burnham<br>
sum evaluations
Post-use constant
sum evaluations
Cumulative trial
from ad
(T&R model)
0.202 Beta (B) for
choice model Pre-entry market
shares
Post-entry market
shares (assuming
consideration
0.243
Predicted
post entry
market shares
0.057 Pre-use preference
ratings
Pre-use choices
Post-use preference
Ratings
Proportion of
consumers who
consider product
0.235 Draw &
cannibalization
calculations Source: Adapted from Thomas Burnham<br>
39
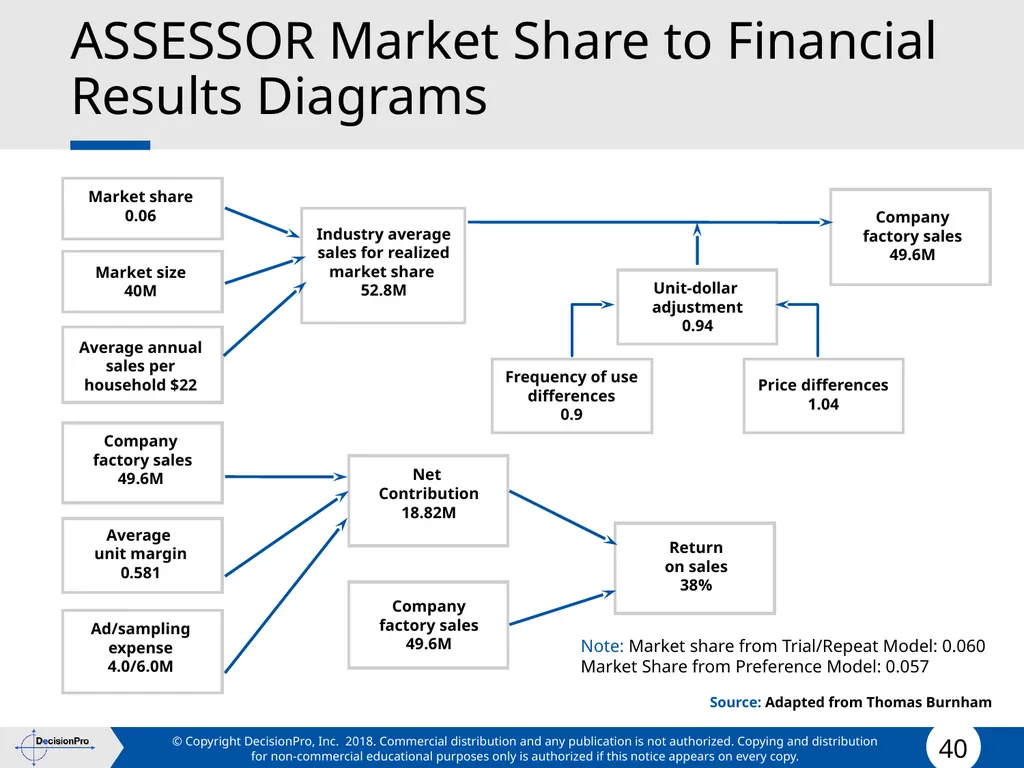
ASSESSOR Market Share to Financial Results Diagrams Market share
0.06
Market size
40M
Average annual
sales per
household $22
Company
factory sales
49.6M
Average
unit margin
0.581
Ad/sampling
expense
4.0/6.0M Net
Contribution
18.82M
Company
factory sales
49.6M Industry average
sales for realized market share
52.8M Company
factory sales
49.6M Frequency of use
differences
0.9 Unit-dollar
adjustment
0.94 Price differences
1.04 Return
on sales
38% Note: Market share from Trial/Repeat Model: 0.060
Market Share from Preference Model: 0.057 Source: Adapted from Thomas Burnham<br>
0.06
Market size
40M
Average annual
sales per
household $22
Company
factory sales
49.6M
Average
unit margin
0.581
Ad/sampling
expense
4.0/6.0M Net
Contribution
18.82M
Company
factory sales
49.6M Industry average
sales for realized market share
52.8M Company
factory sales
49.6M Frequency of use
differences
0.9 Unit-dollar
adjustment
0.94 Price differences
1.04 Return
on sales
38% Note: Market share from Trial/Repeat Model: 0.060
Market Share from Preference Model: 0.057 Source: Adapted from Thomas Burnham<br>
40
Recap Judgmental methods and Chain ratio approach can be applied in a wide range of forecasting situations. We will cover one judgmental method (Delphi method) when discussing Resource Allocation models developed based on managerial judgment.
Bass diffusion model is useful for forecasting the adoptions of a new to the world product (e.g., a new technology or trend)
Pre-test market models are useful for forecasting products that have repeat purchase potential (e.g., consumer packaged goods).<br>
Bass diffusion model is useful for forecasting the adoptions of a new to the world product (e.g., a new technology or trend)
Pre-test market models are useful for forecasting products that have repeat purchase potential (e.g., consumer packaged goods).<br>