Chapter 9 Analyzing Bias and Assuring Fairness Unfair Discrimination Item Test Bias Test-Score Banding Chapater 9 Analyzing Bias and Assuring Fairness 1 Bias defined Systematic group differences in item responses, test scores, or other
"Chapter 9 Analyzing Bias and Assuring Fairness" is the property of its rightful owner. Permission is granted to
download and print the materials on this website for personal, non-commercial use only, and to display it
on your personal computer provided you do not modify the materials and that you retain all copyright
notices contained in the materials. By downloading content from our website, you accept the terms of this
agreement.
Presentation Transcript
01
Chapter 9 Analyzing Bias and Assuring Fairness Unfair Discrimination
Item & Test Bias
Test-Score Banding Chapater 9 Analyzing Bias and Assuring Fairness 1<br>
02
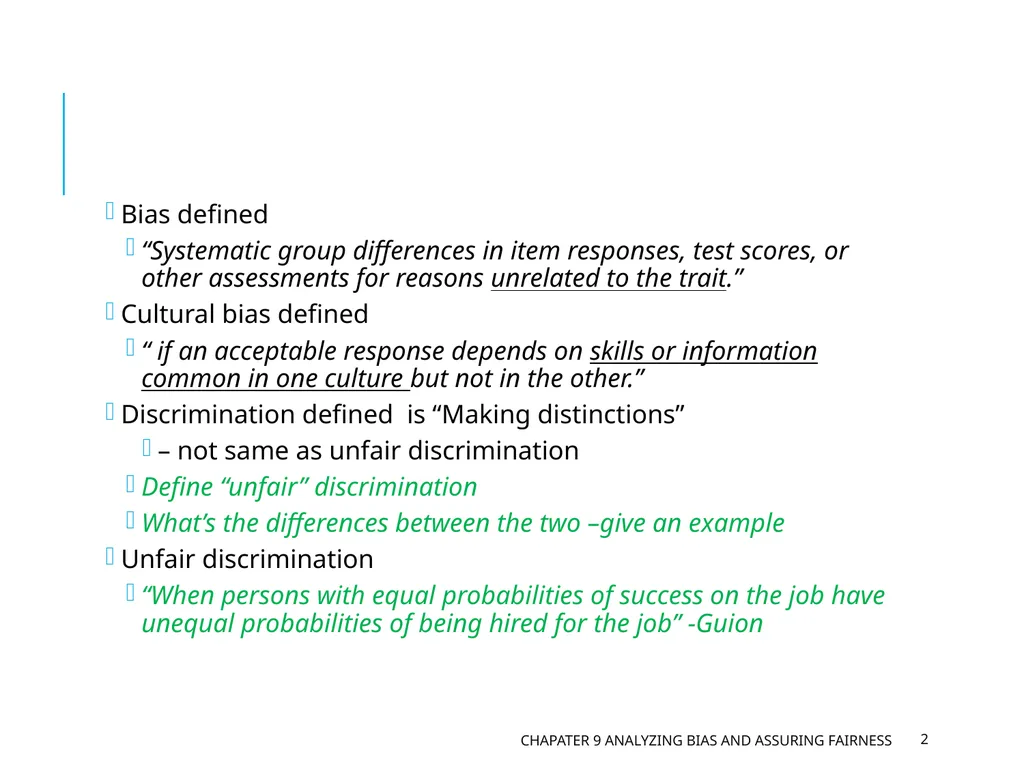
Bias defined
“Systematic group differences in item responses, test scores, or other assessments for reasons unrelated to the trait.”
Cultural bias defined
“ if an acceptable response depends on skills or information common in one culture but not in the other.”
Discrimination defined is “Making distinctions”
– not same as unfair discrimination
Define “unfair” discrimination
What’s the differences between the two –give an example
Unfair discrimination
“When persons with equal probabilities of success on the job have unequal probabilities of being hired for the job” -Guion Chapater 9 Analyzing Bias and Assuring Fairness 2<br>
03
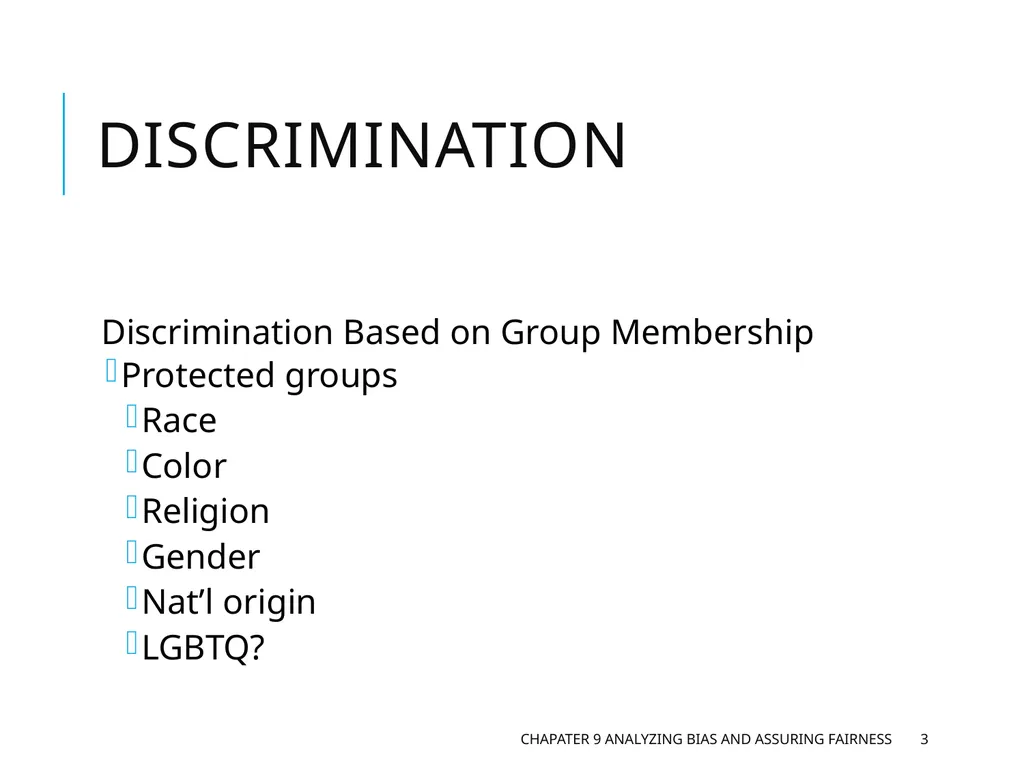
DISCRIMINATION Discrimination Based on Group Membership
Protected groups
Race
Color
Religion
Gender
Nat’l origin
LGBTQ? Chapater 9 Analyzing Bias and Assuring Fairness 3<br>
04
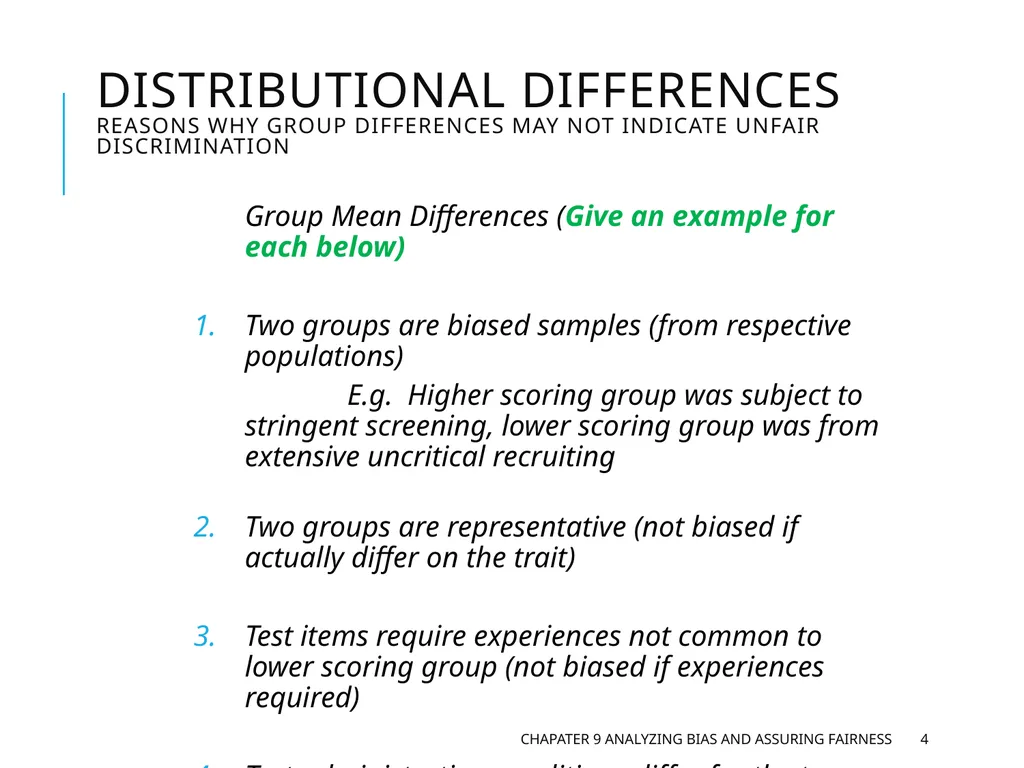
Distributional Differences reasons why group differences may not indicate unfair discrimination Group Mean Differences (Give an example for each below)
Two groups are biased samples (from respective populations)
E.g. Higher scoring group was subject to stringent screening, lower scoring group was from extensive uncritical recruiting
Two groups are representative (not biased if actually differ on the trait)
Test items require experiences not common to lower scoring group (not biased if experiences required)
Test administration conditions differ for the two groups Chapater 9 Analyzing Bias and Assuring Fairness 4<br>
05
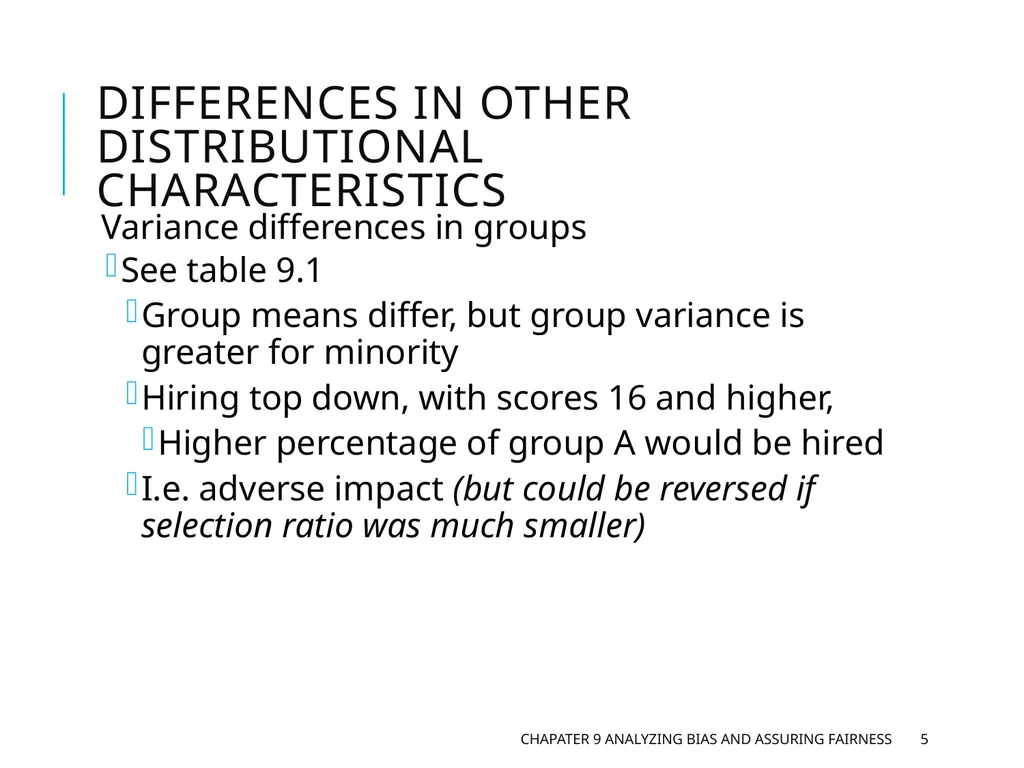
Differences in Other distributional Characteristics Variance differences in groups
See table 9.1
Group means differ, but group variance is greater for minority
Hiring top down, with scores 16 and higher,
Higher percentage of group A would be hired
I.e. adverse impact (but could be reversed if selection ratio was much smaller) Chapater 9 Analyzing Bias and Assuring Fairness 5<br>
06
Discrimination as systematic measurement error -FROM TRUE OR SYSTEMATIC SOURCES RELATED TO GROUP MEMBERSHIP? SYSTEMATIC SOURCE-
3RD variable influence:
test-taking habits
Unknown, but still unfair
What was the example used that would have violated ADA? Chapater 9 Analyzing Bias and Assuring Fairness 6<br>
07
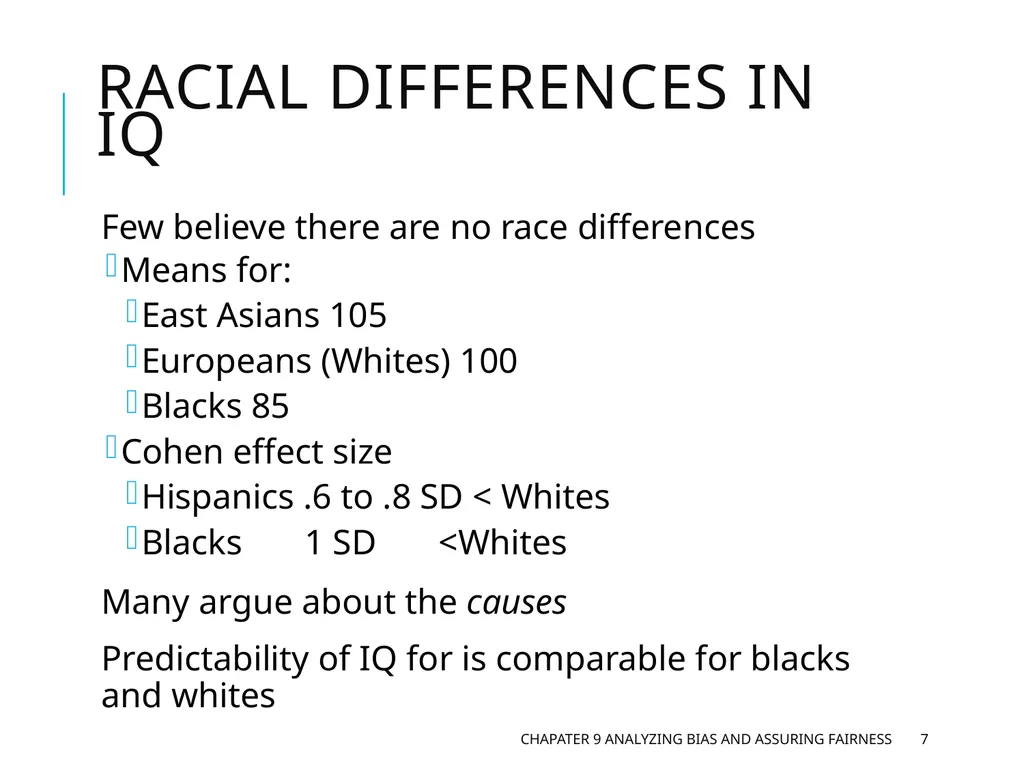
Racial Differences in IQ Few believe there are no race differences
Means for:
East Asians 105
Europeans (Whites) 100
Blacks 85
Cohen effect size
Hispanics .6 to .8 SD < Whites
Blacks 1 SD <Whites
Many argue about the causes
Predictability of IQ for is comparable for blacks and whites Chapater 9 Analyzing Bias and Assuring Fairness 7<br>
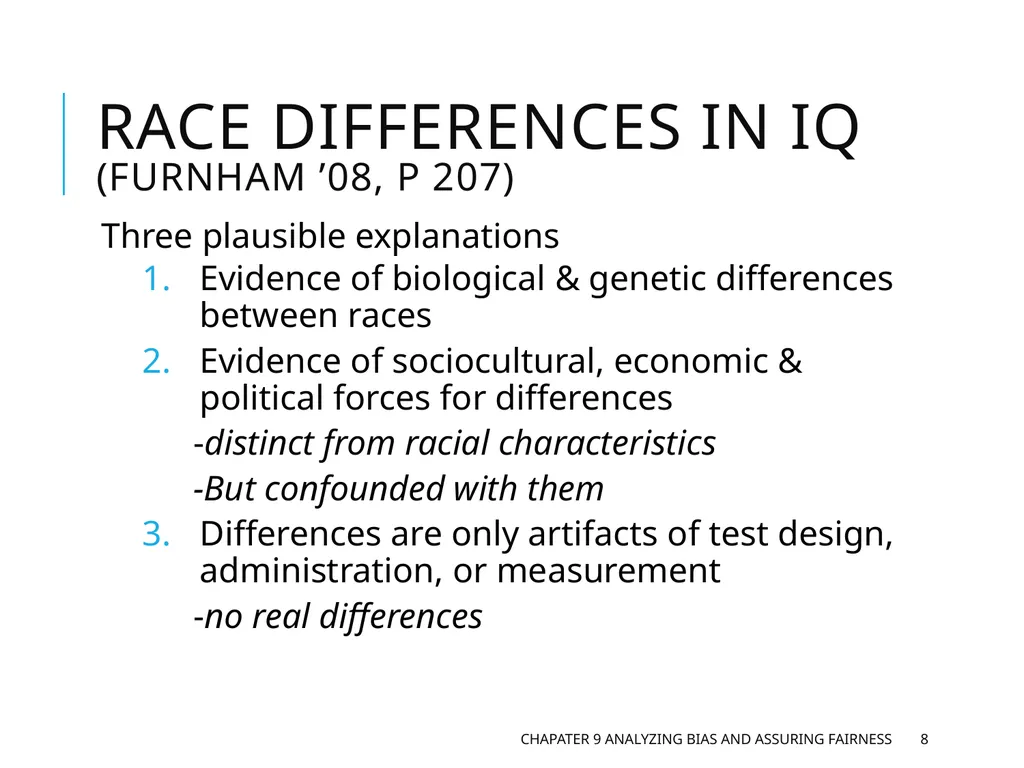
08
Race Differences in IQ (Furnham ’08, p 207) Three plausible explanations
Evidence of biological & genetic differences between races
Evidence of sociocultural, economic & political forces for differences
-distinct from racial characteristics
-But confounded with them
Differences are only artifacts of test design, administration, or measurement
-no real differences Chapater 9 Analyzing Bias and Assuring Fairness 8<br>
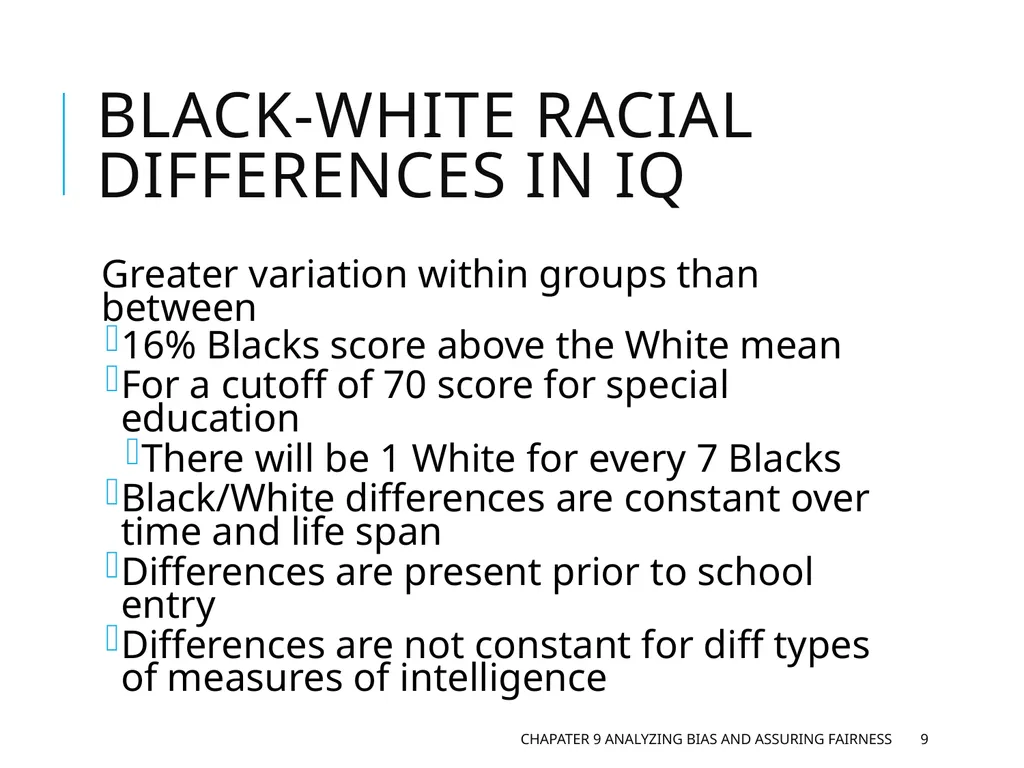
09
Black-White Racial Differences in IQ Greater variation within groups than between
16% Blacks score above the White mean
For a cutoff of 70 score for special education
There will be 1 White for every 7 Blacks
Black/White differences are constant over time and life span
Differences are present prior to school entry
Differences are not constant for diff types of measures of intelligence Chapater 9 Analyzing Bias and Assuring Fairness 9<br>
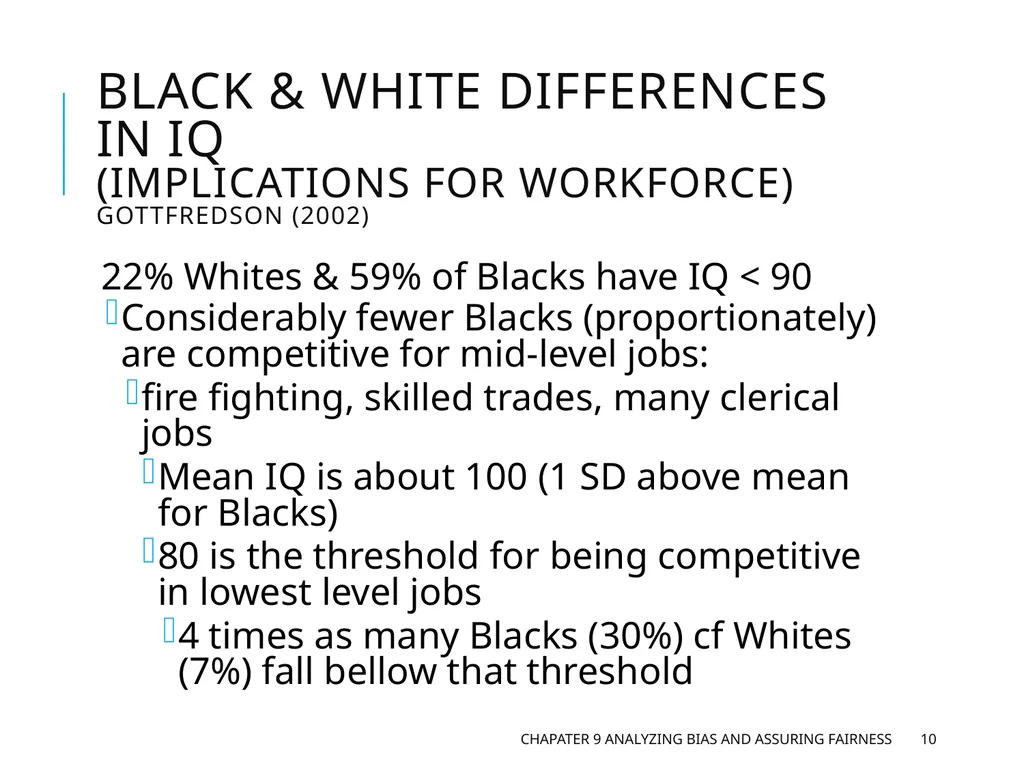
10
Black & White Differences in IQ (implications for workforce) Gottfredson (2002) 22% Whites & 59% of Blacks have IQ < 90
Considerably fewer Blacks (proportionately) are competitive for mid-level jobs:
fire fighting, skilled trades, many clerical jobs
Mean IQ is about 100 (1 SD above mean for Blacks)
80 is the threshold for being competitive in lowest level jobs
4 times as many Blacks (30%) cf Whites (7%) fall bellow that threshold Chapater 9 Analyzing Bias and Assuring Fairness 10<br>
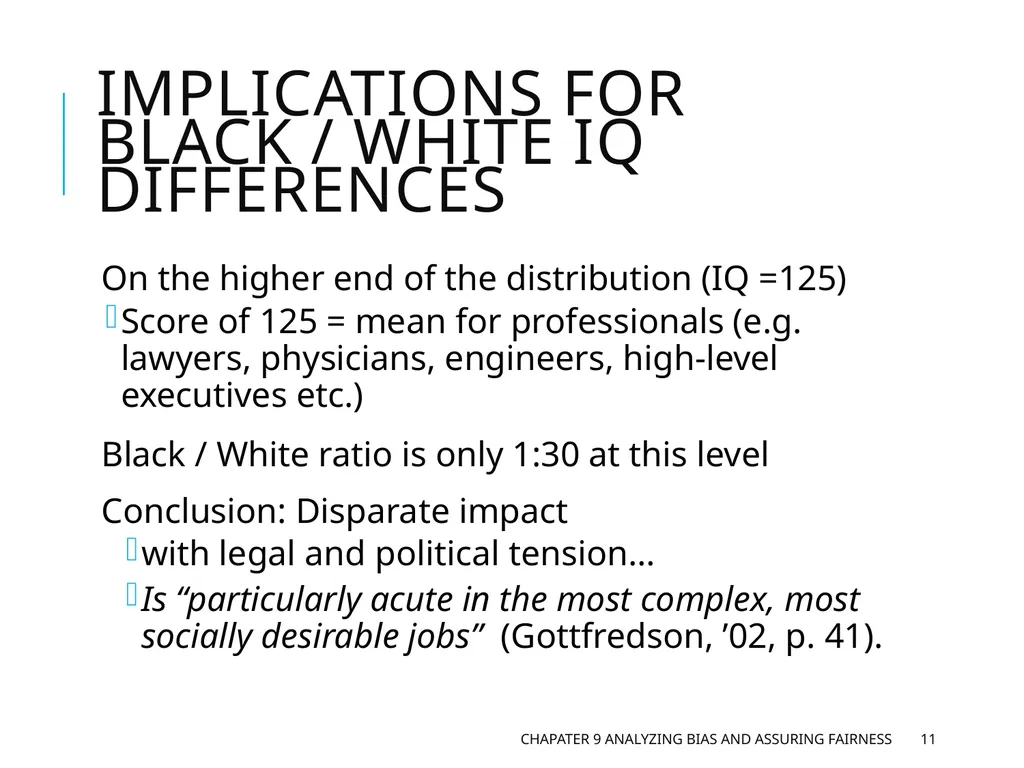
11
Implications for Black / White IQ Differences On the higher end of the distribution (IQ =125)
Score of 125 = mean for professionals (e.g. lawyers, physicians, engineers, high-level executives etc.)
Black / White ratio is only 1:30 at this level
Conclusion: Disparate impact
with legal and political tension…
Is “particularly acute in the most complex, most socially desirable jobs” (Gottfredson, ’02, p. 41). Chapater 9 Analyzing Bias and Assuring Fairness 11<br>
12
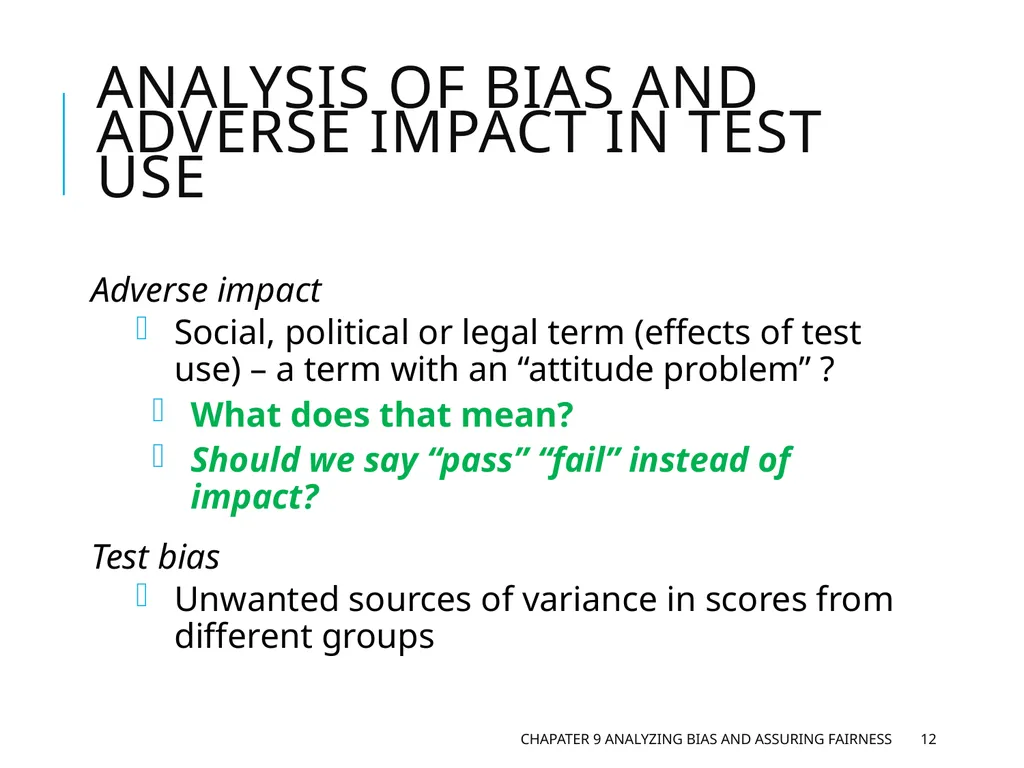
ANALYSIS OF BIAS AND ADVERSE IMPACT IN TEST USE Adverse impact
Social, political or legal term (effects of test use) – a term with an “attitude problem” ?
What does that mean?
Should we say “pass” “fail” instead of impact?
Test bias
Unwanted sources of variance in scores from different groups Chapater 9 Analyzing Bias and Assuring Fairness 12<br>
13
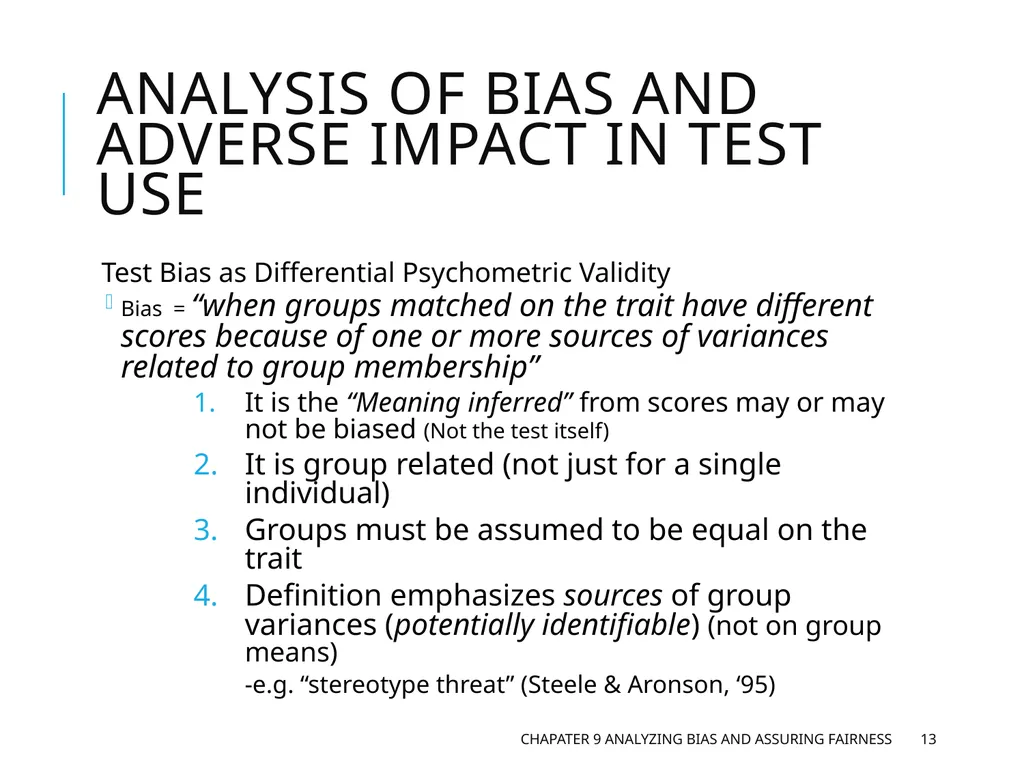
ANALYSIS OF BIAS AND ADVERSE IMPACT IN TEST USE Test Bias as Differential Psychometric Validity
Bias = “when groups matched on the trait have different scores because of one or more sources of variances related to group membership”
It is the “Meaning inferred” from scores may or may not be biased (Not the test itself)
It is group related (not just for a single individual)
Groups must be assumed to be equal on the trait
Definition emphasizes sources of group variances (potentially identifiable) (not on group means)
-e.g. “stereotype threat” (Steele & Aronson, ‘95) Chapater 9 Analyzing Bias and Assuring Fairness 13<br>
14
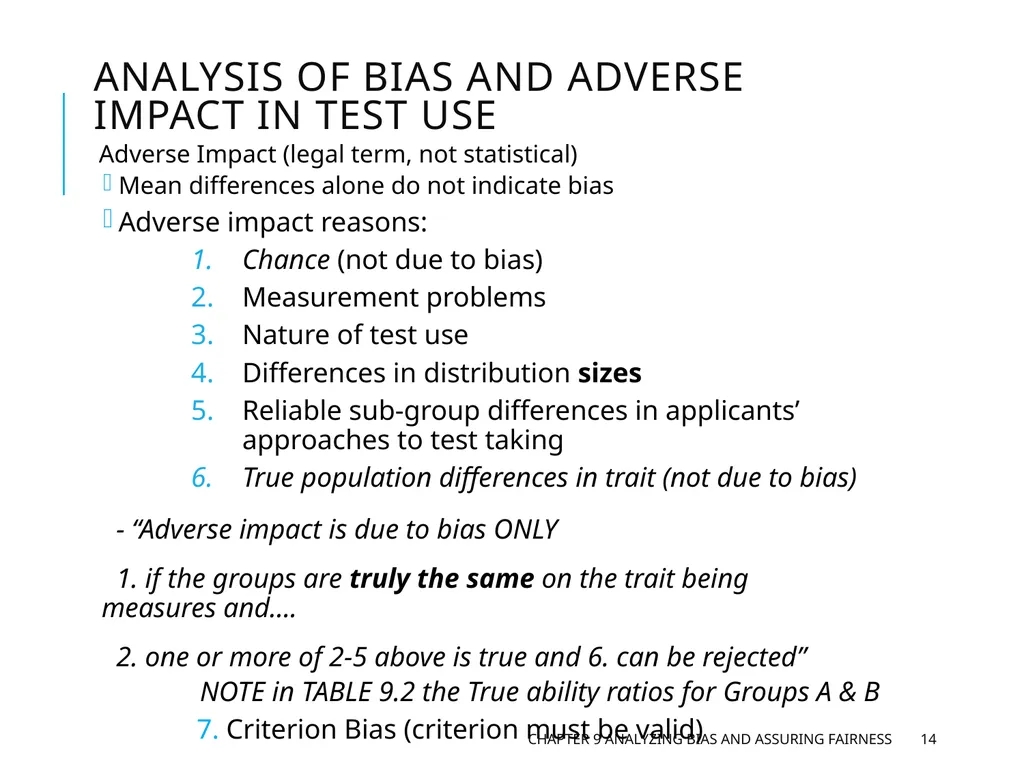
ANALYSIS OF BIAS AND ADVERSE IMPACT IN TEST USE Adverse Impact (legal term, not statistical)
Mean differences alone do not indicate bias
Adverse impact reasons:
Chance (not due to bias)
Measurement problems
Nature of test use
Differences in distribution sizes
Reliable sub-group differences in applicants’ approaches to test taking
True population differences in trait (not due to bias)
- “Adverse impact is due to bias ONLY
1. if the groups are truly the same on the trait being measures and….
2. one or more of 2-5 above is true and 6. can be rejected”
NOTE in TABLE 9.2 the True ability ratios for Groups A & B
7. Criterion Bias (criterion must be valid) Chapter 9 Analyzing Bias and Assuring Fairness 14<br>
15
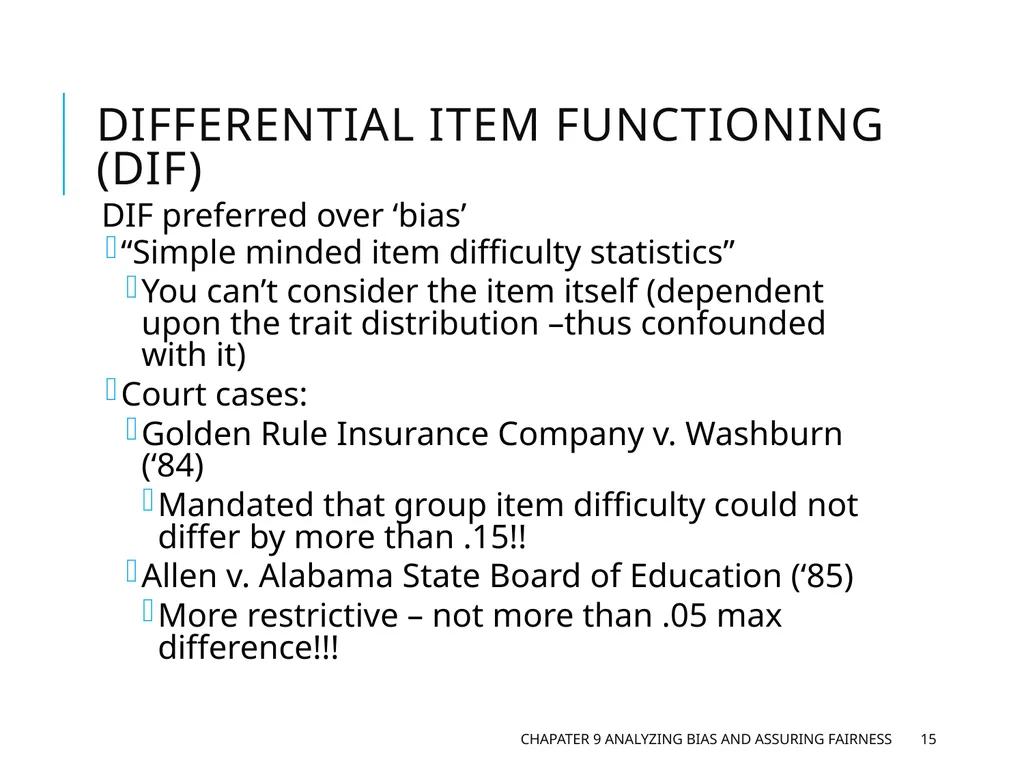
DIFFERENTIAL ITEM FUNCTIONING (DIF) DIF preferred over ‘bias’
“Simple minded item difficulty statistics”
You can’t consider the item itself (dependent upon the trait distribution –thus confounded with it)
Court cases:
Golden Rule Insurance Company v. Washburn (‘84)
Mandated that group item difficulty could not differ by more than .15!!
Allen v. Alabama State Board of Education (‘85)
More restrictive – not more than .05 max difference!!! Chapater 9 Analyzing Bias and Assuring Fairness 15<br>
16
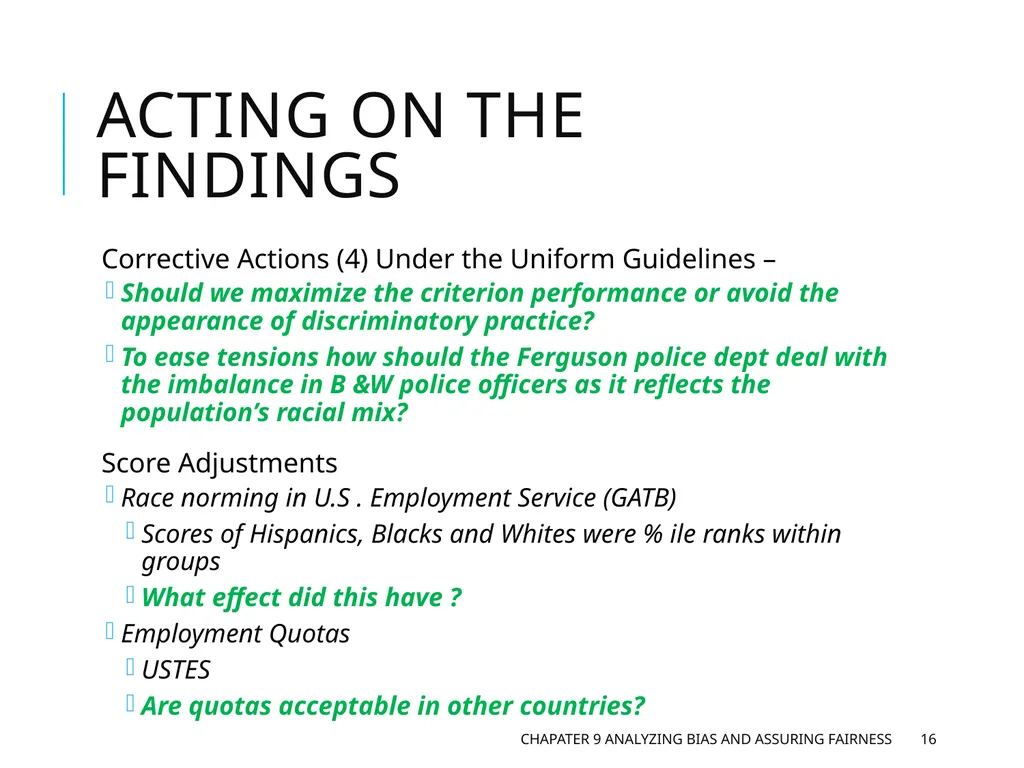
ACTING ON THE FINDINGS Corrective Actions (4) Under the Uniform Guidelines –
Should we maximize the criterion performance or avoid the appearance of discriminatory practice?
To ease tensions how should the Ferguson police dept deal with the imbalance in B &W police officers as it reflects the population’s racial mix?
Score Adjustments
Race norming in U.S . Employment Service (GATB)
Scores of Hispanics, Blacks and Whites were % ile ranks within groups
What effect did this have ?
Employment Quotas
USTES
Are quotas acceptable in other countries? Chapater 9 Analyzing Bias and Assuring Fairness 16<br>
17
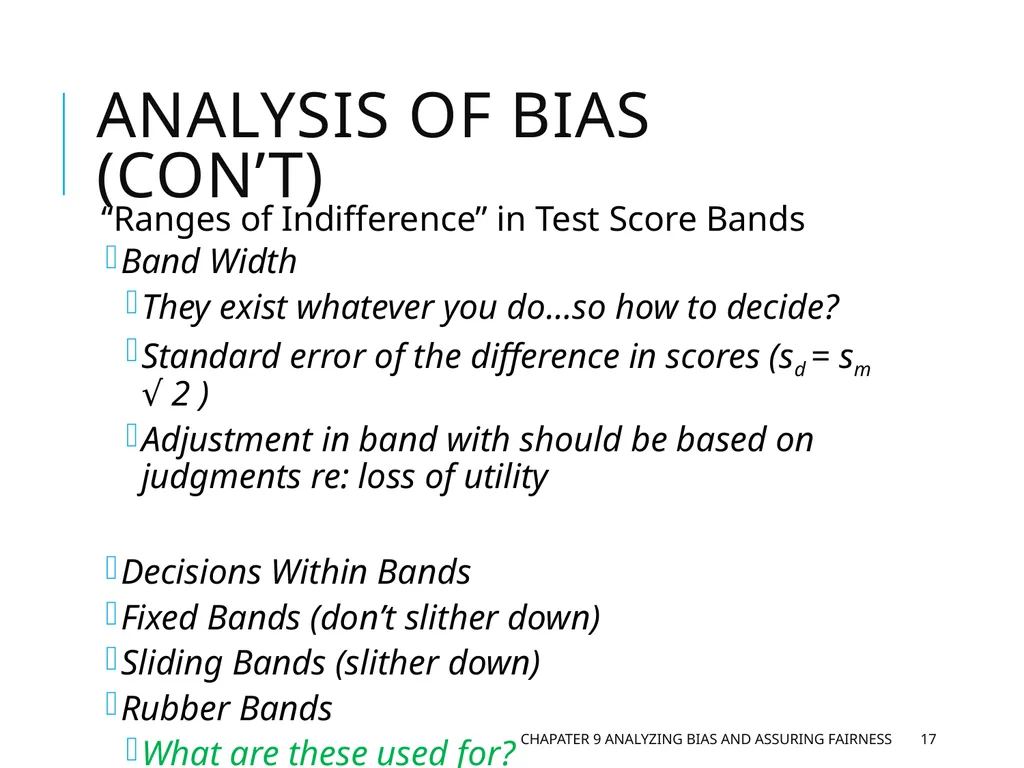
Analysis of Bias (con’t) “Ranges of Indifference” in Test Score Bands
Band Width
They exist whatever you do…so how to decide?
Standard error of the difference in scores (sd = sm √ 2 )
Adjustment in band with should be based on judgments re: loss of utility
Decisions Within Bands
Fixed Bands (don’t slither down)
Sliding Bands (slither down)
Rubber Bands
What are these used for? Chapater 9 Analyzing Bias and Assuring Fairness 17<br>