Climate Risk Management Approach in the IRI (from months, through decades, to long-term climate change) Four Pillars Identify Vulnerabilities and Opportunities in Climate Variability and Change in Collaboration with Stakeholders (which
"Climate Risk Management Approach in the IRI (from" is the property of its rightful owner. Permission is granted to
download and print the materials on this website for personal, non-commercial use only, and to display it
on your personal computer provided you do not modify the materials and that you retain all copyright
notices contained in the materials. By downloading content from our website, you accept the terms of this
agreement.
Presentation Transcript
01
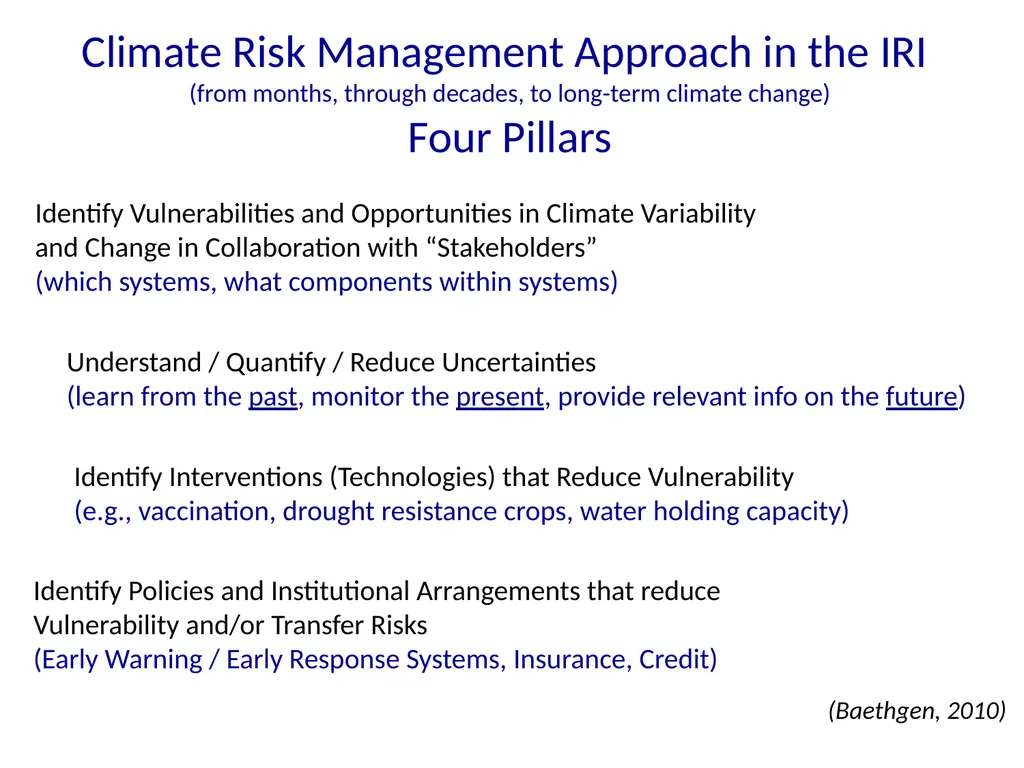
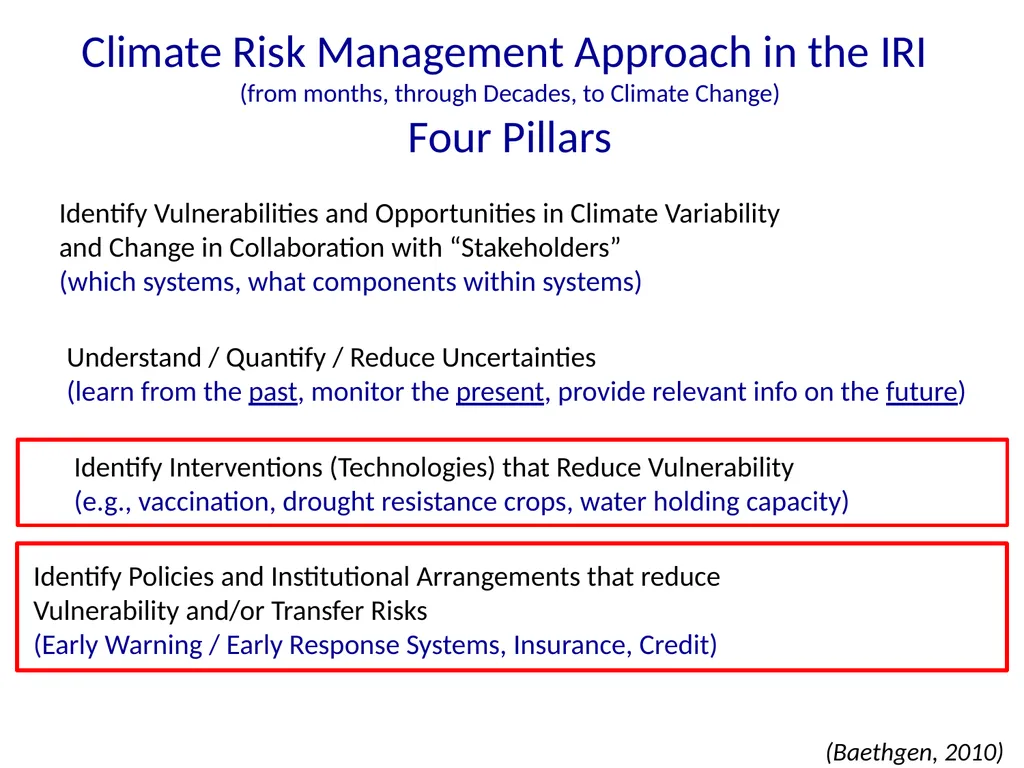
Climate Risk Management Approach in the IRI
(from months, through decades, to long-term climate change)
Four Pillars Identify Vulnerabilities and Opportunities in Climate Variability
and Change in Collaboration with “Stakeholders”
(which systems, what components within systems) Understand / Quantify / Reduce Uncertainties
(learn from the past, monitor the present, provide relevant info on the future) Identify Interventions (Technologies) that Reduce Vulnerability
(e.g., vaccination, drought resistance crops, water holding capacity) Identify Policies and Institutional Arrangements that reduce
Vulnerability and/or Transfer Risks
(Early Warning / Early Response Systems, Insurance, Credit) (Baethgen, 2010)<br>
02
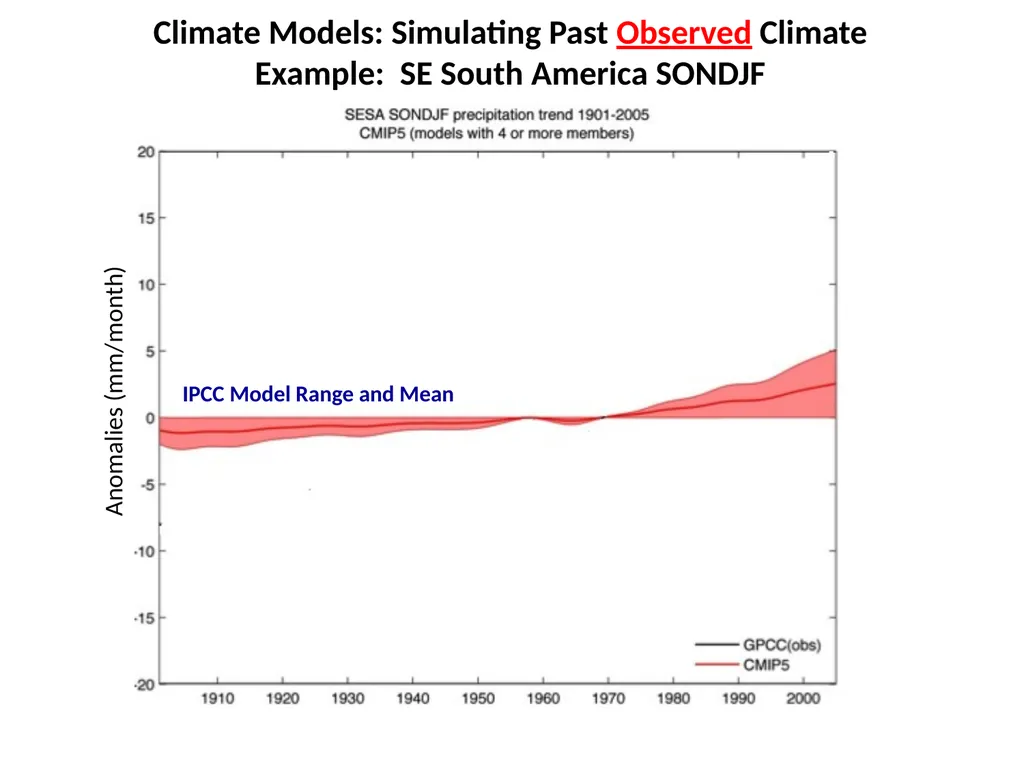
Climate Models: Simulating Past Observed Climate
Example: SE South America SONDJF IPCC Model Range and Mean Anomalies (mm/month)<br>
03
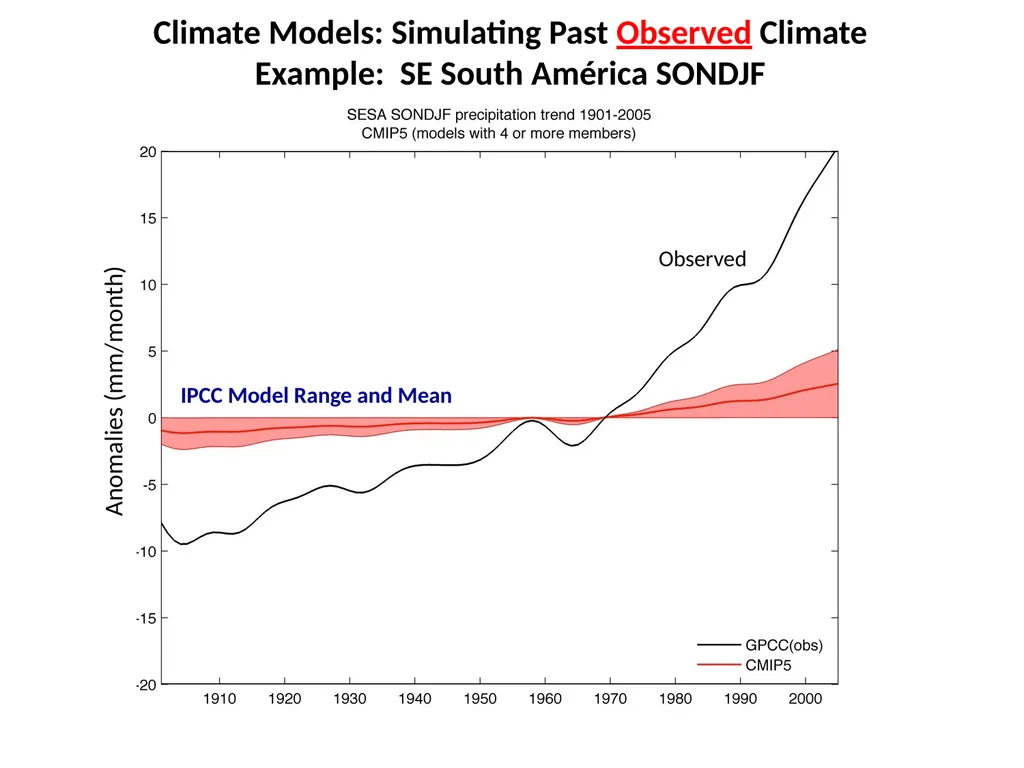
Observed IPCC Model Range and Mean Climate Models: Simulating Past Observed Climate
Example: SE South América SONDJF Anomalies (mm/month)<br>
04
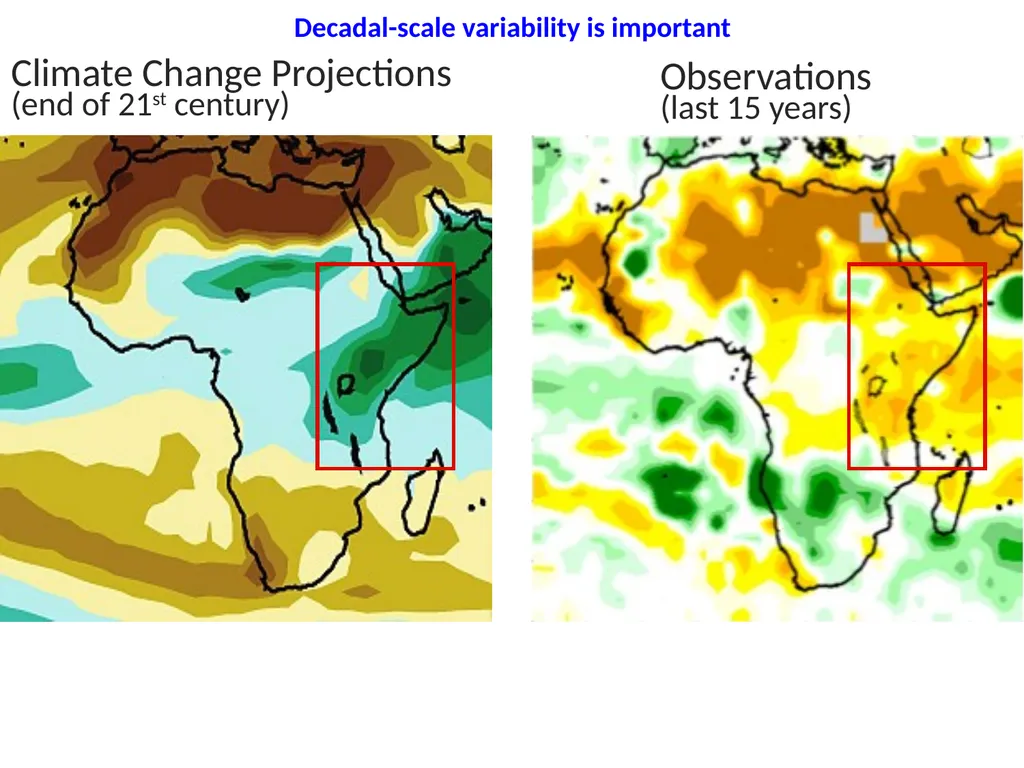
Observations
(last 15 years) Climate Change Projections
(end of 21st century) Decadal-scale variability is important<br>
05
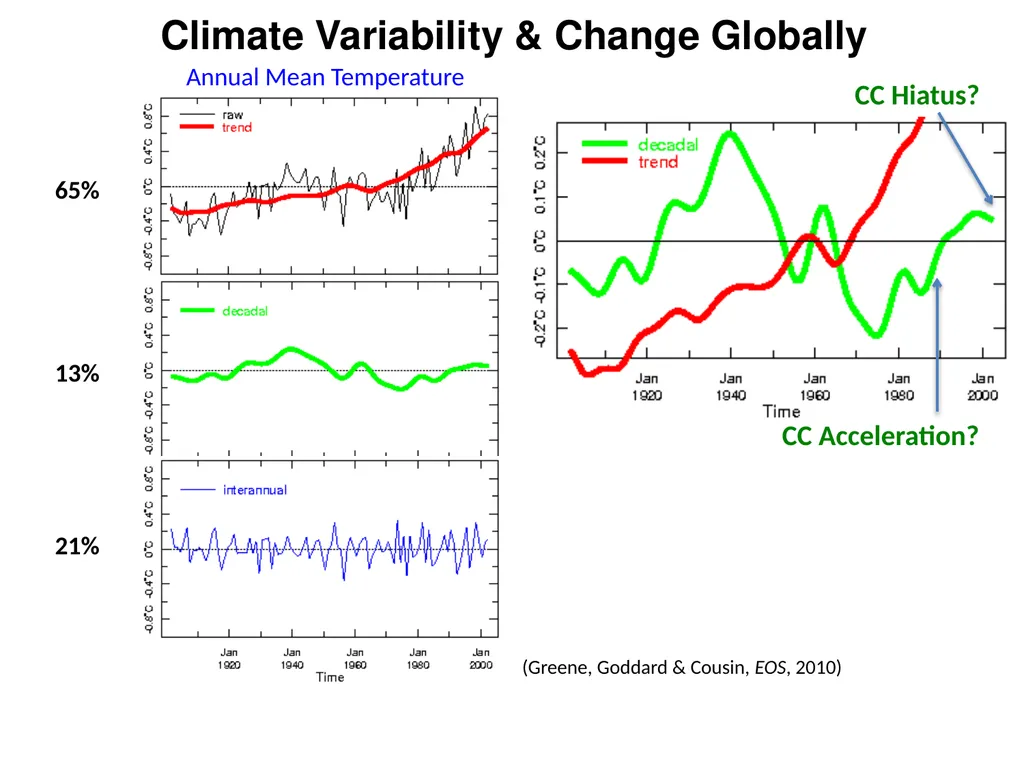
Climate Variability & Change Globally Temperature Most of the variability in the globally-averaged temperature is contained in the slowly varying “climate change” component. 65% 13% 21% (Greene, Goddard & Cousin, EOS, 2010) Annual Mean Temperature<br>
06
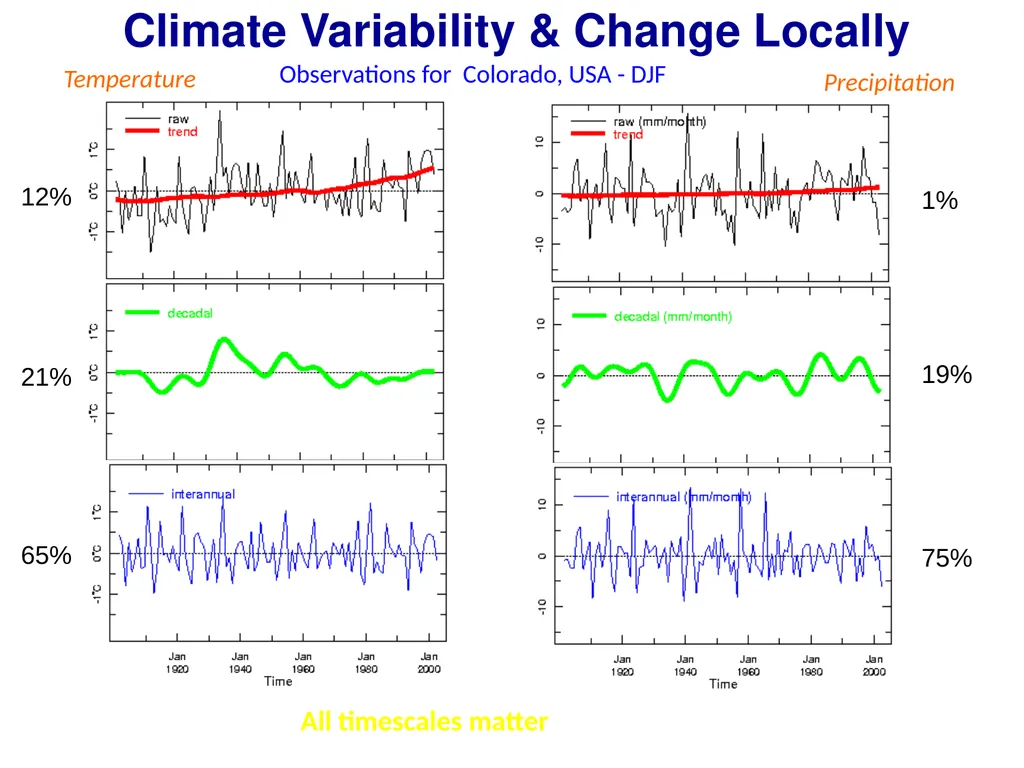
Climate Variability & Change Locally Observations for Colorado, USA - DJF Temperature Precipitation All timescales matter<br>
07
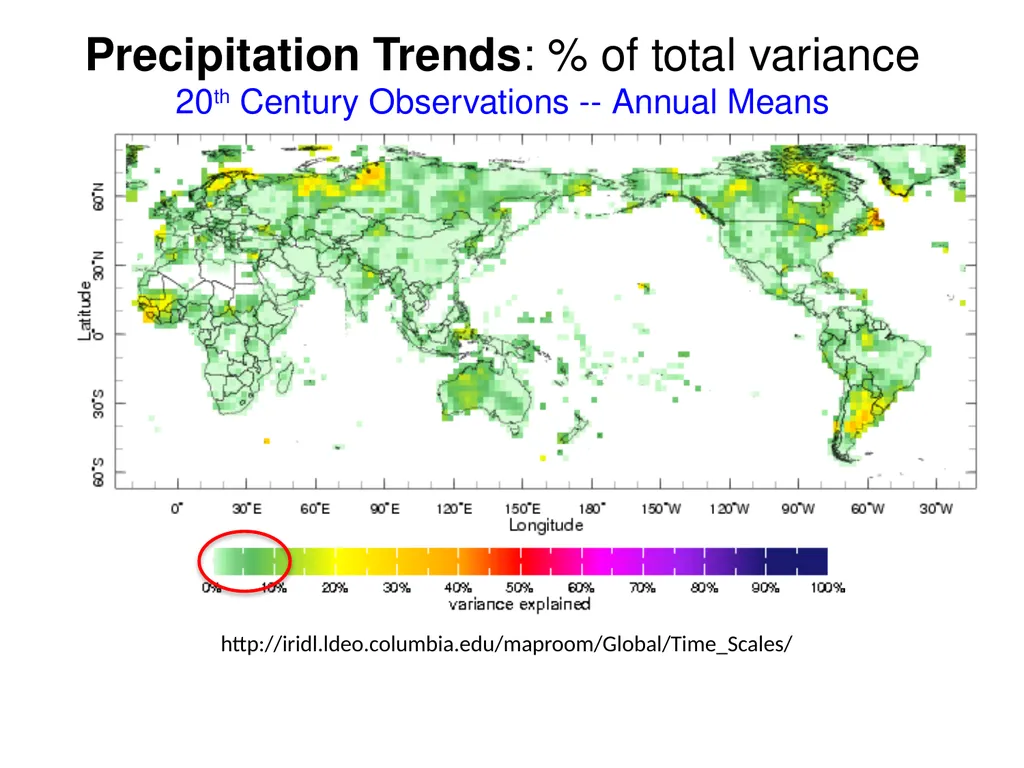
Precipitation Trends: % of total variance
20th Century Observations -- Annual Means http://iridl.ldeo.columbia.edu/maproom/Global/Time_Scales/<br>
08
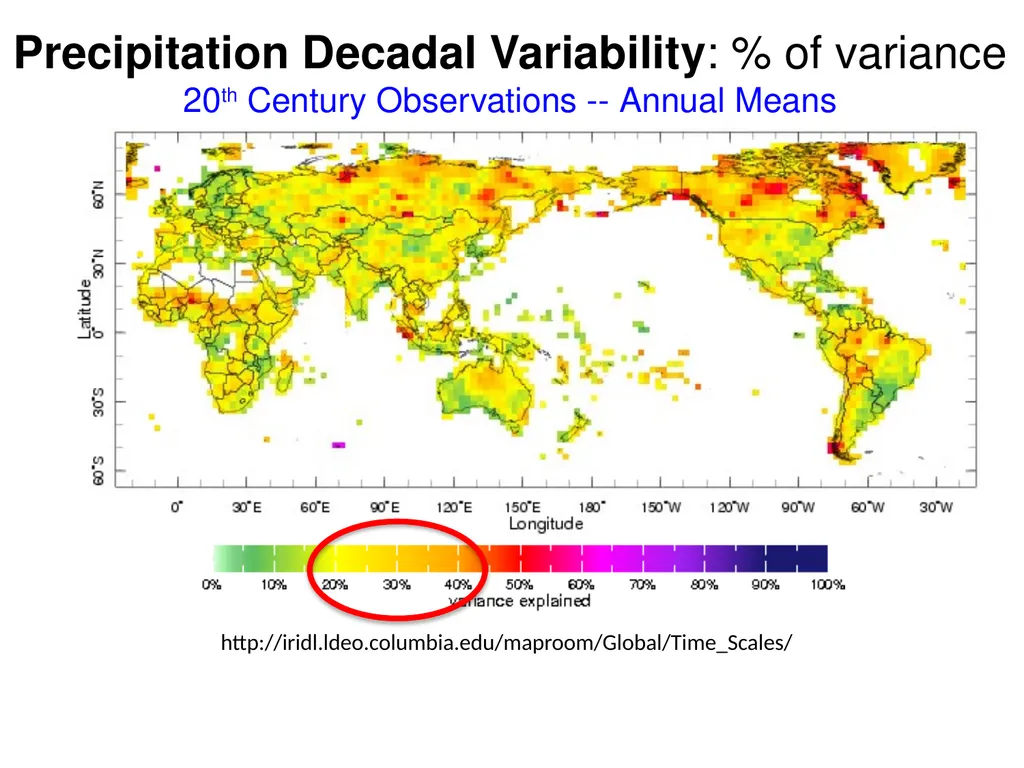
Precipitation Decadal Variability: % of variance
20th Century Observations -- Annual Means http://iridl.ldeo.columbia.edu/maproom/Global/Time_Scales/<br>
09
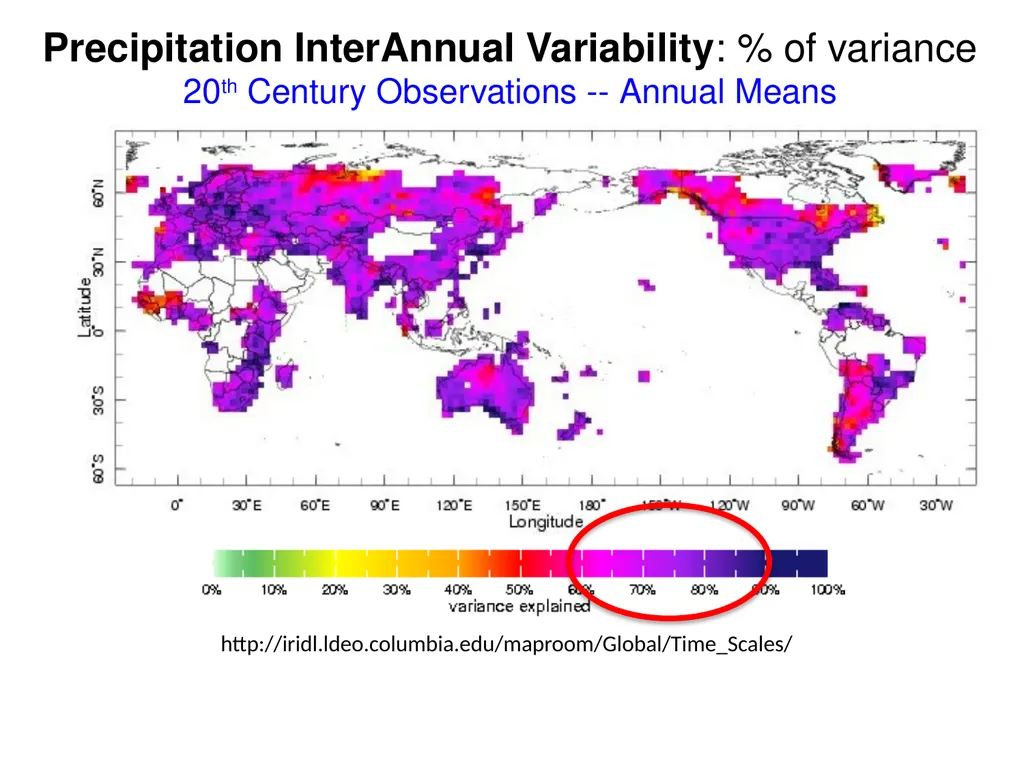
Precipitation InterAnnual Variability: % of variance
20th Century Observations -- Annual Means http://iridl.ldeo.columbia.edu/maproom/Global/Time_Scales/<br>
10
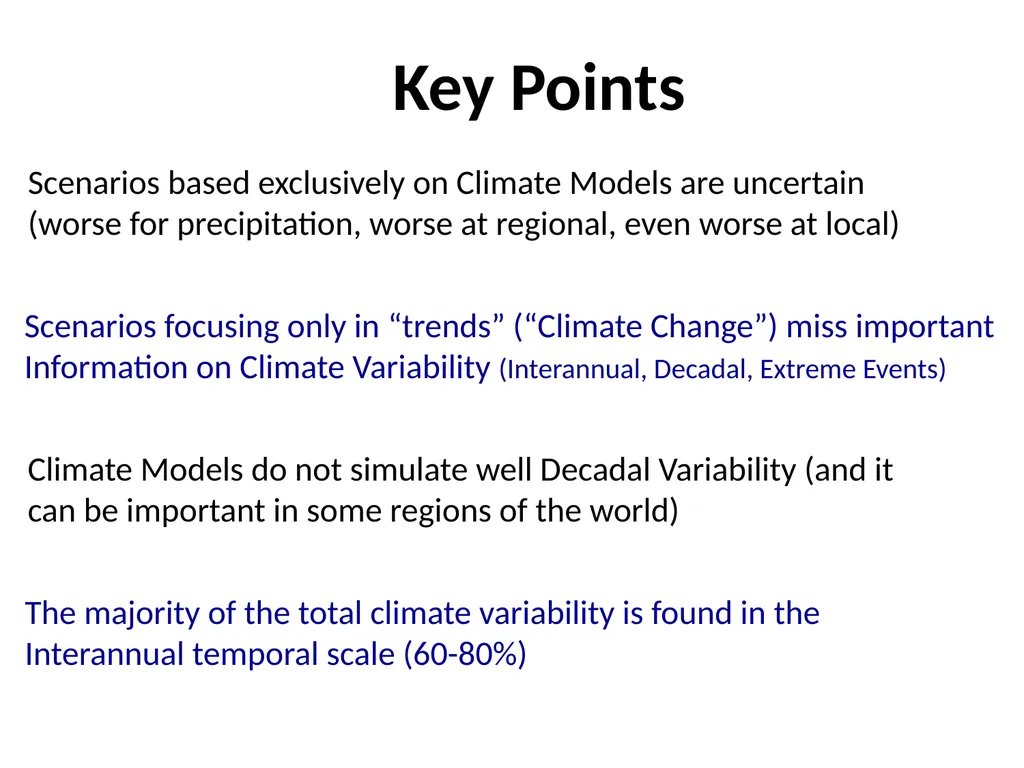
Key Points Scenarios based exclusively on Climate Models are uncertain
(worse for precipitation, worse at regional, even worse at local) Scenarios focusing only in “trends” (“Climate Change”) miss important
Information on Climate Variability (Interannual, Decadal, Extreme Events) Climate Models do not simulate well Decadal Variability (and it
can be important in some regions of the world) The majority of the total climate variability is found in the
Interannual temporal scale (60-80%)<br>
11
Climate Risk Management Approach in the IRI
(from months, through Decades, to Climate Change)
Four Pillars Identify Vulnerabilities and Opportunities in Climate Variability
and Change in Collaboration with “Stakeholders”
(which systems, what components within systems) Understand / Quantify / Reduce Uncertainties
(learn from the past, monitor the present, provide relevant info on the future) Identify Interventions (Technologies) that Reduce Vulnerability
(e.g., vaccination, drought resistance crops, water holding capacity) Identify Policies and Institutional Arrangements that reduce
Vulnerability and/or Transfer Risks
(Early Warning / Early Response Systems, Insurance, Credit) (Baethgen, 2010)<br>
12
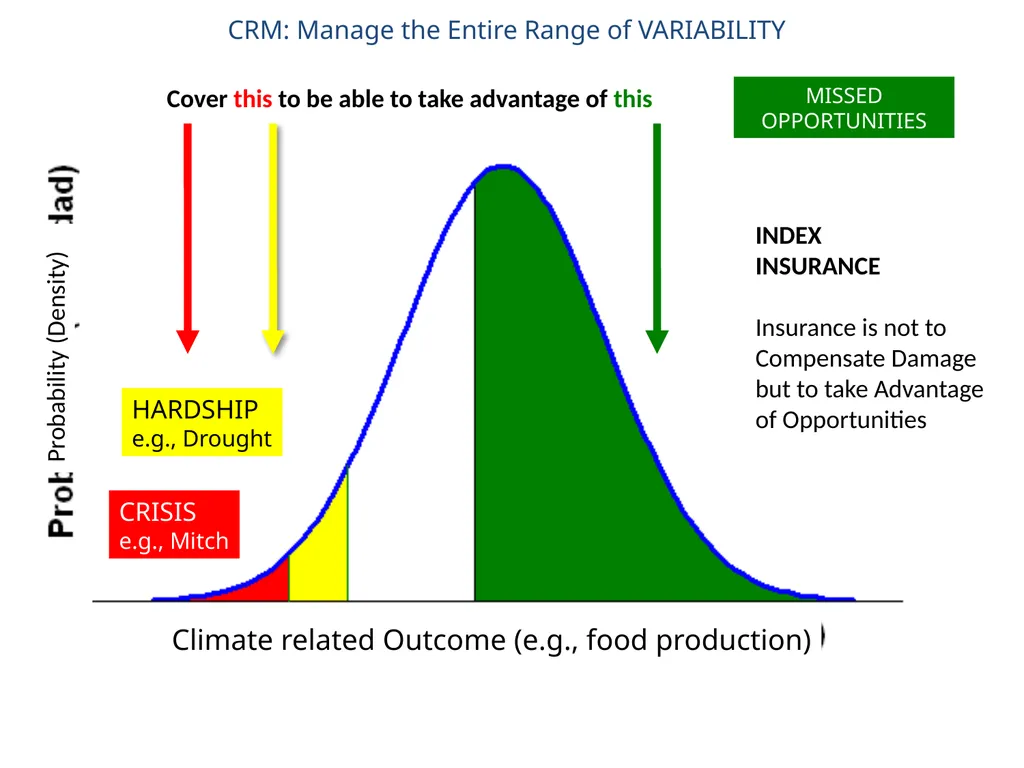
CRM: Manage the Entire Range of VARIABILITY Probability (Density) Climate related Outcome (e.g., food production)<br>
13
CRM: Manage the Entire Range of VARIABILITY CRISIS
e.g., Mitch HARDSHIP
e.g., Drought Climate related Outcome (e.g., food production) Probability (Density) Production Systems
are designed to
avoid this
(fertilizers, good seeds)<br>
14
CRISIS
e.g., Mitch HARDSHIP
e.g., Drought Probability (Density) Climate related Outcome (e.g., food production) CRM: Manage the Entire Range of VARIABILITY Cover this to be able to take advantage of this INDEX
INSURANCE
Insurance is not to
Compensate Damage
but to take Advantage
of Opportunities MISSED
OPPORTUNITIES<br>
15
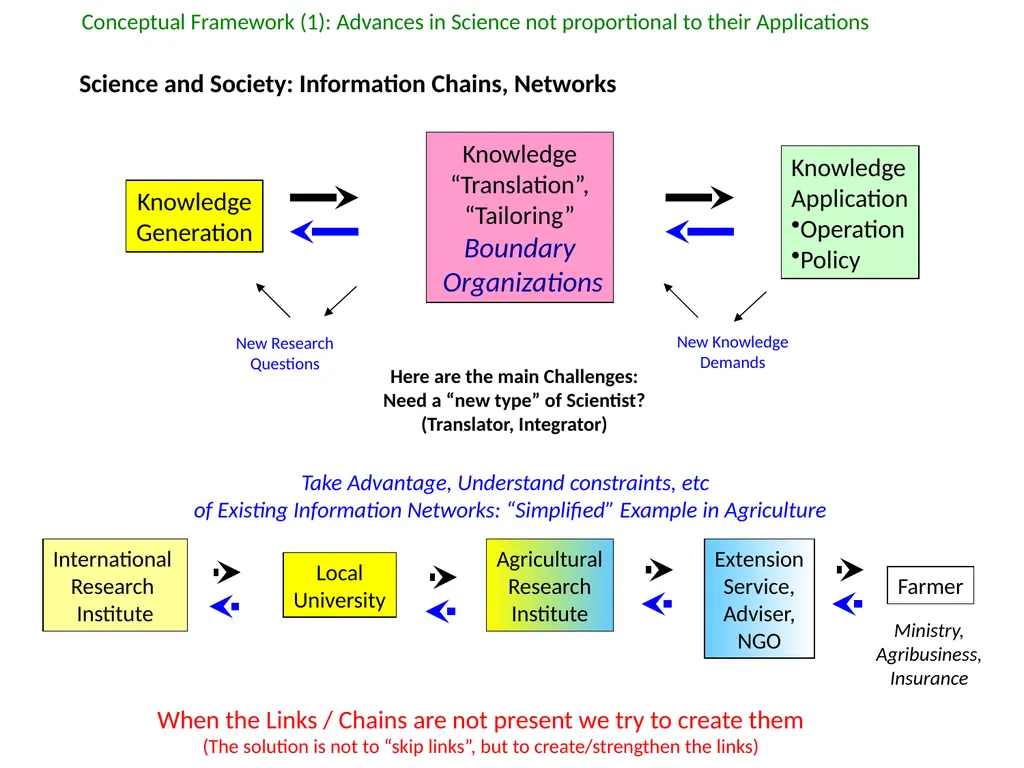
International
Research
Institute Local
University Agricultural
Research
Institute Extension
Service,
Adviser,
NGO Farmer New Research
Questions New Knowledge
Demands Here are the main Challenges:
Need a “new type” of Scientist?
(Translator, Integrator) When the Links / Chains are not present we try to create them
(The solution is not to “skip links”, but to create/strengthen the links) Take Advantage, Understand constraints, etc
of Existing Information Networks: “Simplified” Example in Agriculture Science and Society: Information Chains, Networks Ministry,
Agribusiness,
Insurance Conceptual Framework (1): Advances in Science not proportional to their Applications<br>