
COASTAL PROCESSES By Krishnaprasad V N M090160CE












Description: COASTAL PROCESSES By Krishnaprasad V N M090160CE Coastal processes are the set of mechanisms that operate along a coastline, bringing about various combinations of erosion and deposition. The land water interface along the coastline is
Related Topics
Download Presentation
"COASTAL PROCESSES By Krishnaprasad V N M090160CE" is the property of its rightful owner. Permission is granted to download and print the materials on this website for personal, non-commercial use only, and to display it on your personal computer provided you do not modify the materials and that you retain all copyright notices contained in the materials. By downloading content from our website, you accept the terms of this agreement.
Presentation Transcript
slide1. COASTAL PROCESSES By
Krishnaprasad V N
M090160CE<br>
slide2. Coastal processes are the set of mechanisms that operate along a coastline, bringing about various combinations of erosion and deposition.
The land water interface along the coastline is always in a highly dynamic state and nature works towards maintaining an equilibrium condition.
The energy due to tide, waves, wind and currents is constantly working in the coastal zone. Dissipation of energy (due to tide, wind, waves and current) is often provided by the beaches, mudflats, marshes and mangroves. Introduction<br>
slide3. Human use of the coasts also requires space and herein lays the conflict, which results in unstable coastal systems. This induces coastal erosion, sediment transport and accretion.
Coastal processes are highly unpredictable and is a challenge to coastal scientists.
Some of the coastal processes are
Sediment transport
currents
Denudation
Deposition
Erosion<br>
slide4. Flooding
Diffraction
Refraction
Sediment transport is the one of the important coastal process.
The analysis and prediction of sediment transport have great commercial, aesthetic, social, and scientific importance owing to the sustainable development and coastal zone management.<br>
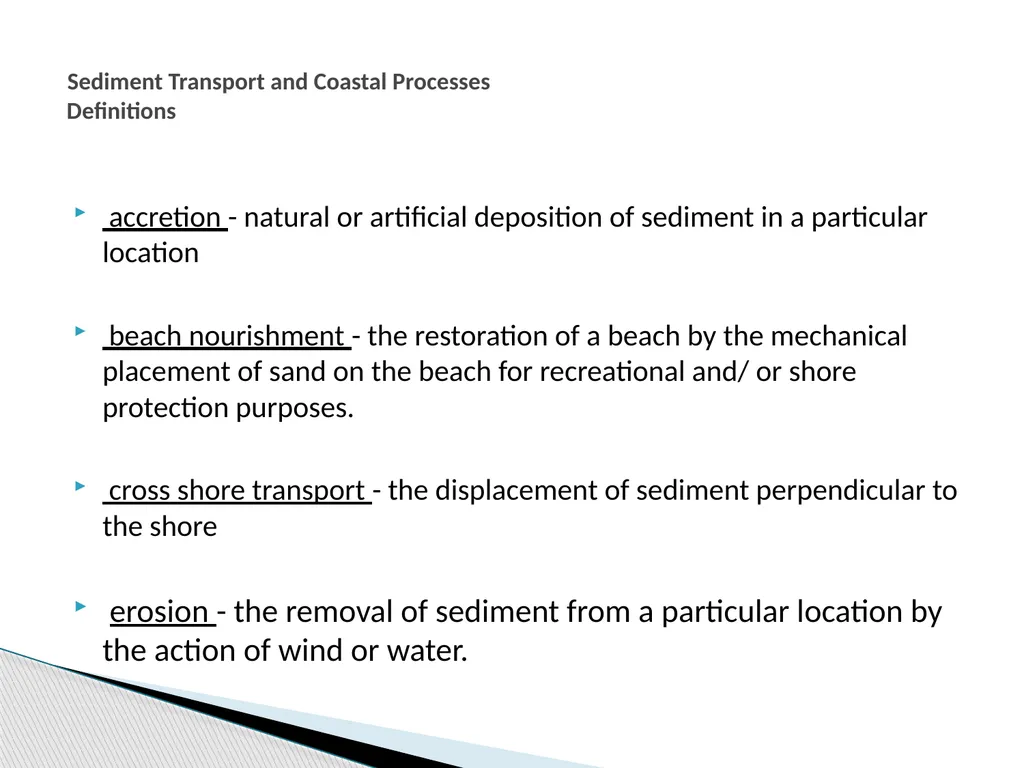
slide5. accretion - natural or artificial deposition of sediment in a particular location
beach nourishment - the restoration of a beach by the mechanical placement of sand on the beach for recreational and/ or shore protection purposes.
cross shore transport - the displacement of sediment perpendicular to the shore
erosion - the removal of sediment from a particular location by the action of wind or water. Sediment Transport and Coastal Processes Definitions<br>
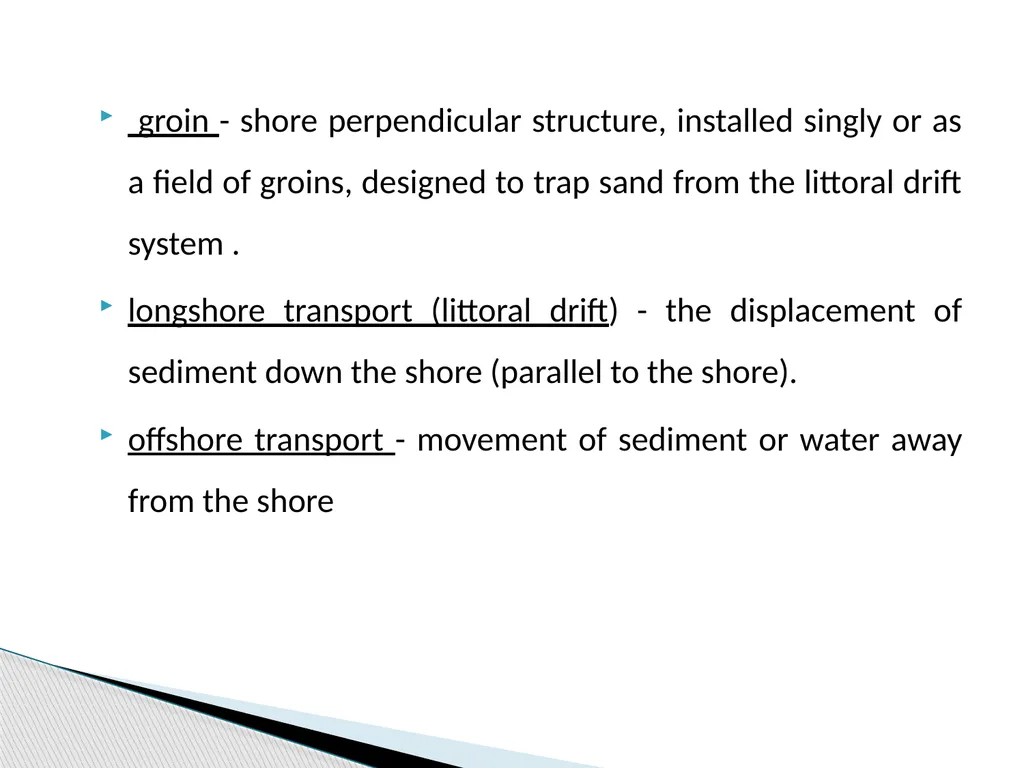
slide6. groin - shore perpendicular structure, installed singly or as a field of groins, designed to trap sand from the littoral drift system .
longshore transport (littoral drift) - the displacement of sediment down the shore (parallel to the shore).
offshore transport - movement of sediment or water away from the shore<br>
slide7. longshore bar - offshore ridge or mound of sand, gravel or other loose material running parallel to the shore which is submerged (at least at high tide) and located a short distance from the shore.
tombolo - the combination of an offshore rock or island which is connected to the beach by a sand spit.
sand spit - low tongue of land or a relatively long, narrow shoal extending from the land.<br>
slide8. Gabions: Boulders and rocks are wired into mesh cages and usually placed in front of areas vulnerable to heavy to moderate erosion.
onshore transport - movement of sediment or water toward the shore.<br>
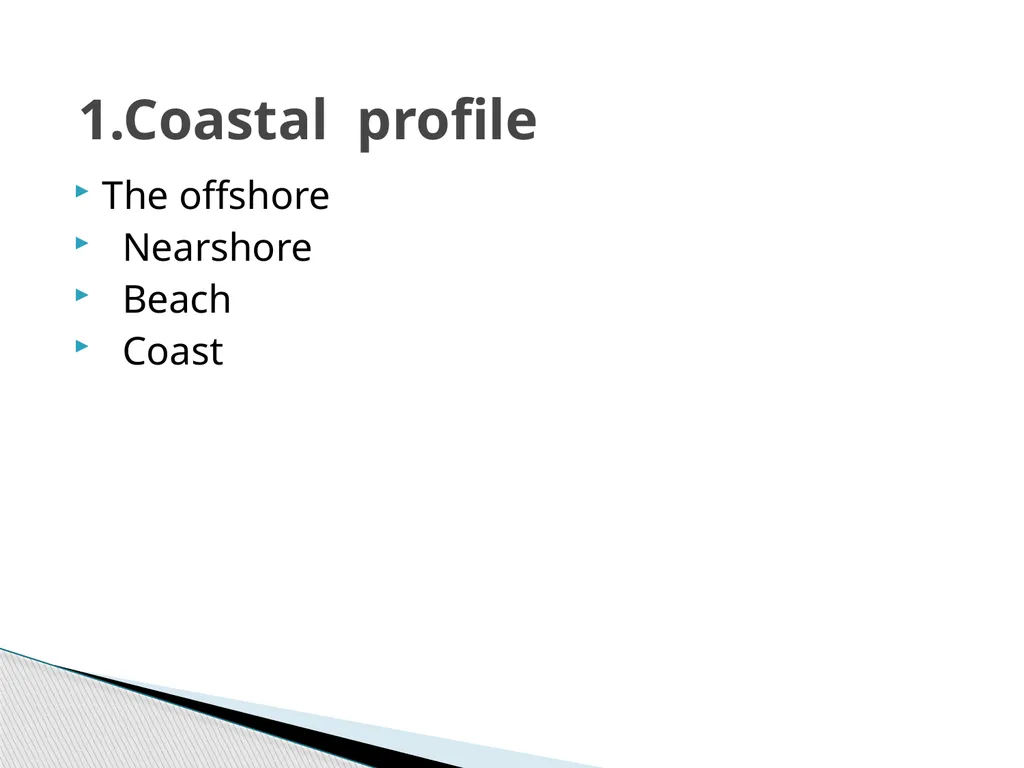
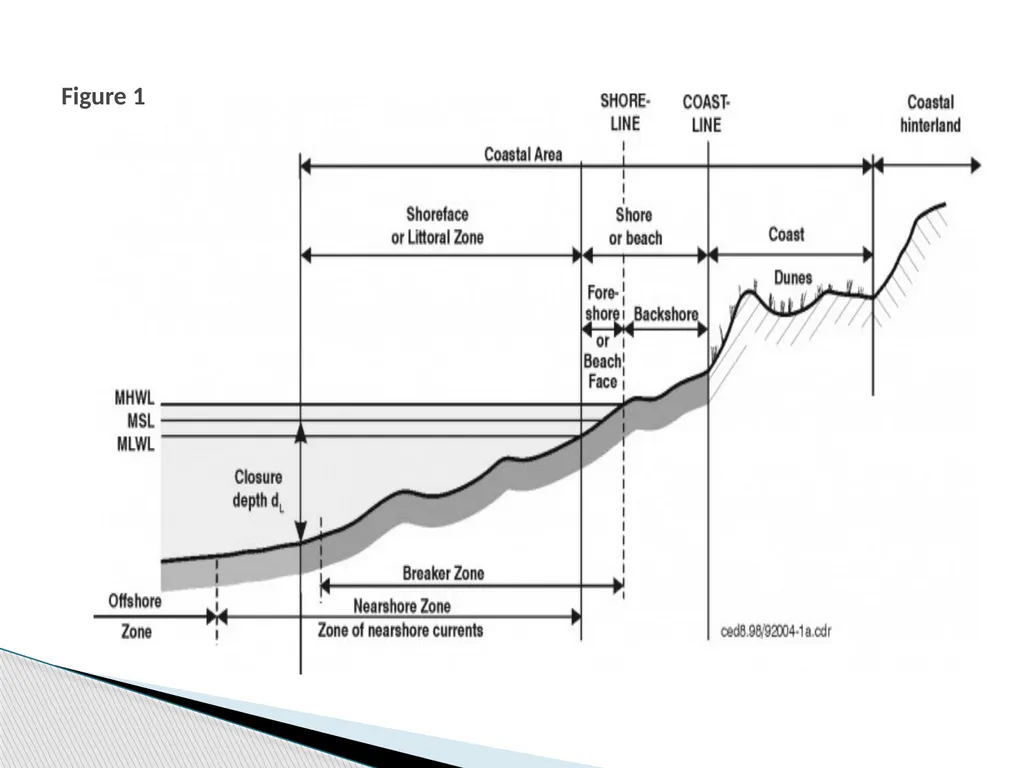
slide9. The offshore
Nearshore
Beach
Coast 1.Coastal profile<br>
slide10. Figure 1<br>
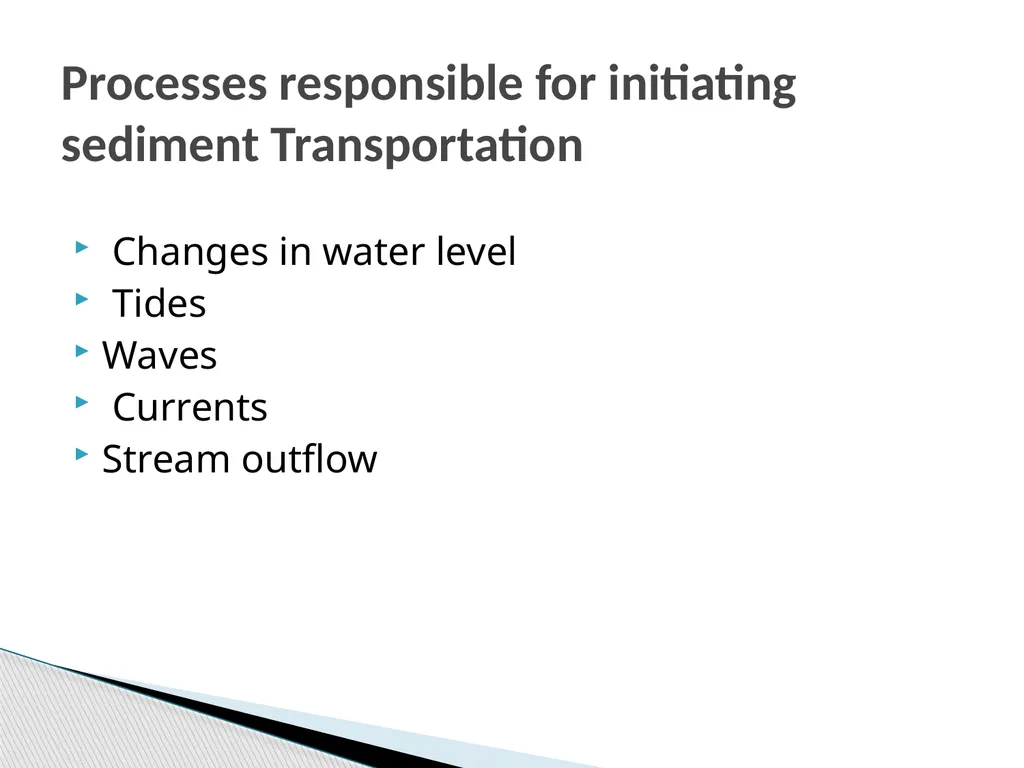
slide11. Changes in water level
Tides
Waves
Currents
Stream outflow Processes responsible for initiating sediment Transportation<br>
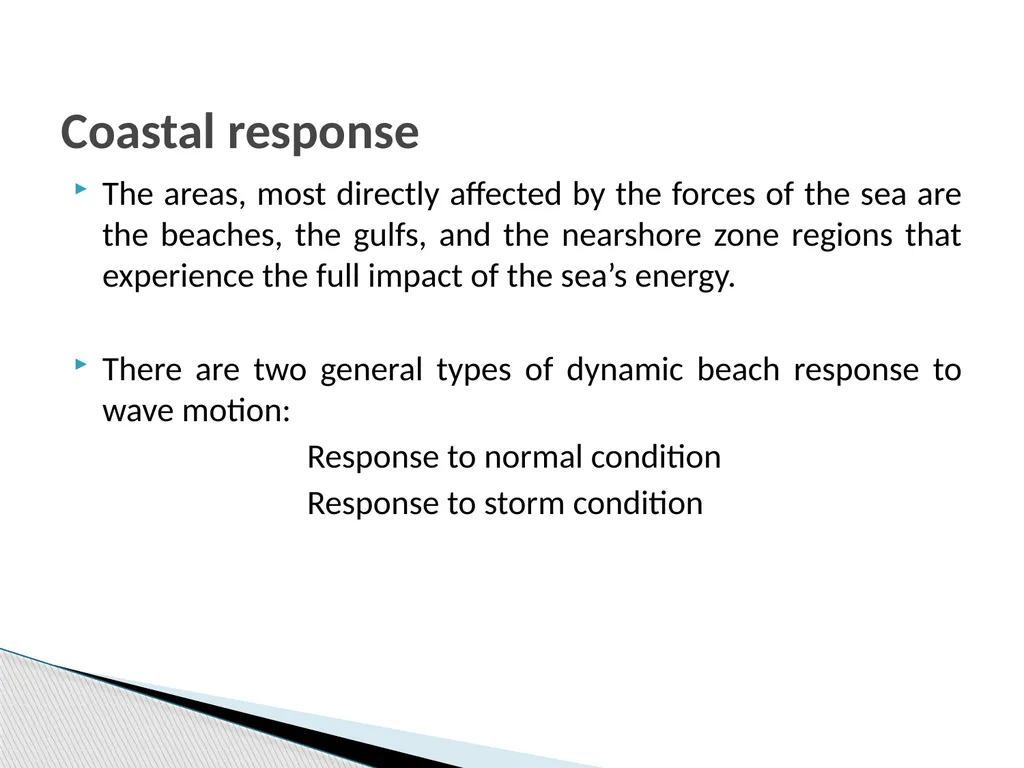
slide12. The areas, most directly affected by the forces of the sea are the beaches, the gulfs, and the nearshore zone regions that experience the full impact of the sea’s energy.
There are two general types of dynamic beach response to wave motion:
Response to normal condition
Response to storm condition Coastal response<br>
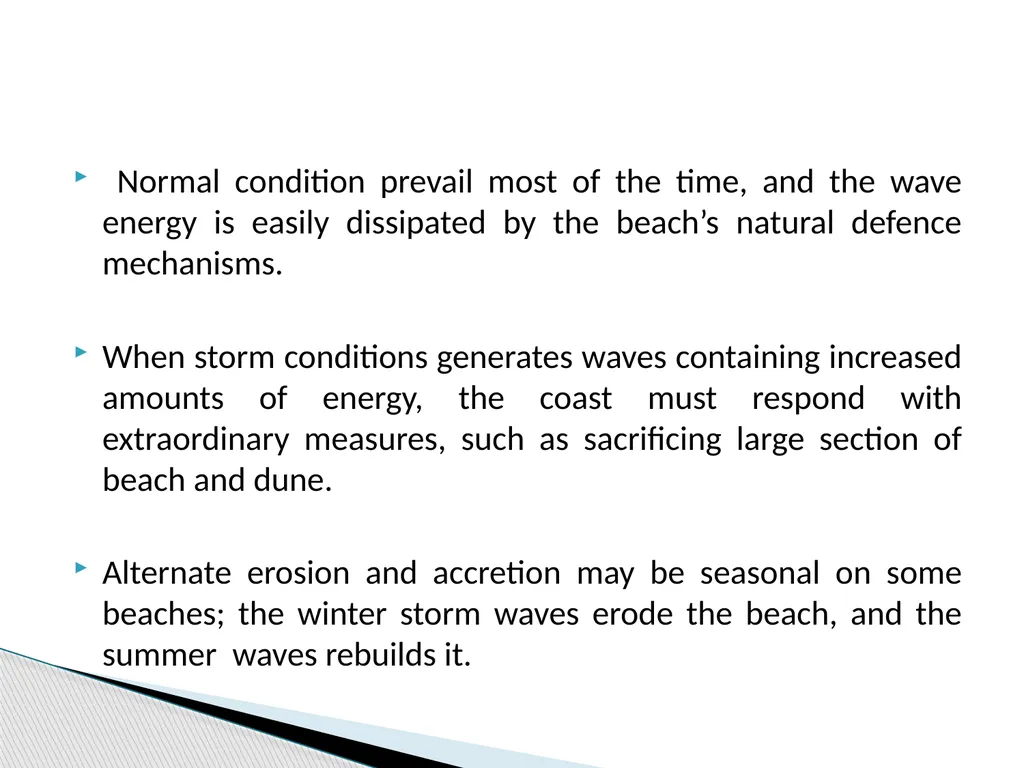
slide13. Normal condition prevail most of the time, and the wave energy is easily dissipated by the beach’s natural defence mechanisms.
When storm conditions generates waves containing increased amounts of energy, the coast must respond with extraordinary measures, such as sacrificing large section of beach and dune.
Alternate erosion and accretion may be seasonal on some beaches; the winter storm waves erode the beach, and the summer waves rebuilds it.<br>
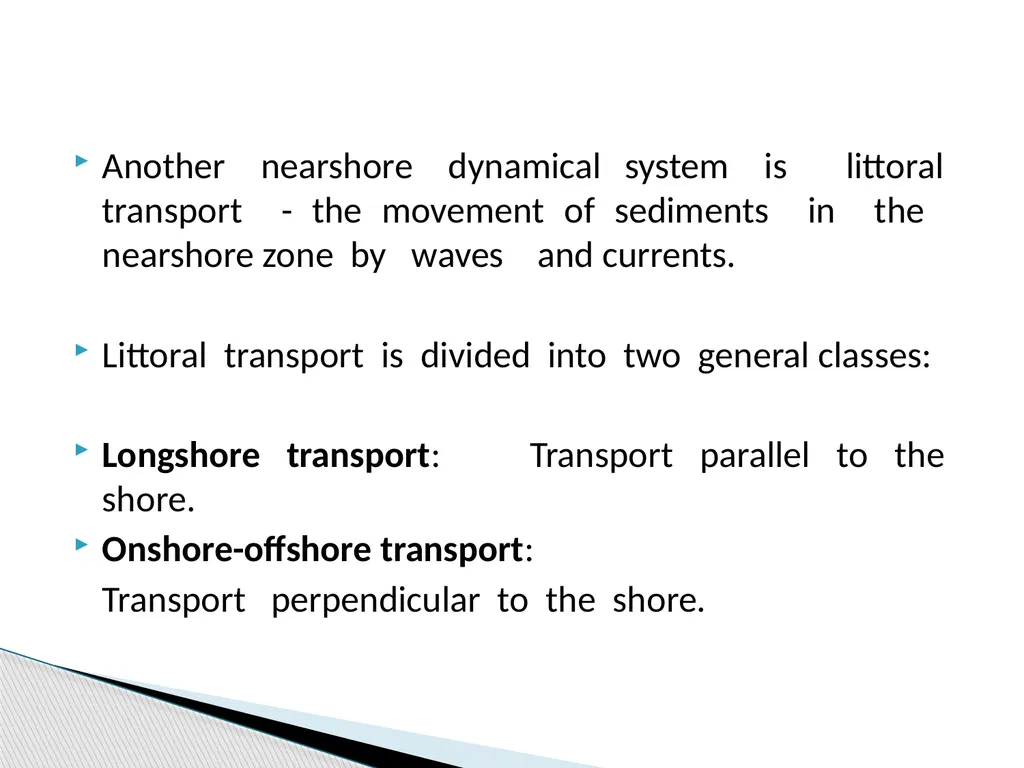
slide14. Another nearshore dynamical system is littoral transport - the movement of sediments in the nearshore zone by waves and currents.
Littoral transport is divided into two general classes:
Longshore transport: Transport parallel to the shore.
Onshore-offshore transport:
Transport perpendicular to the shore.<br>
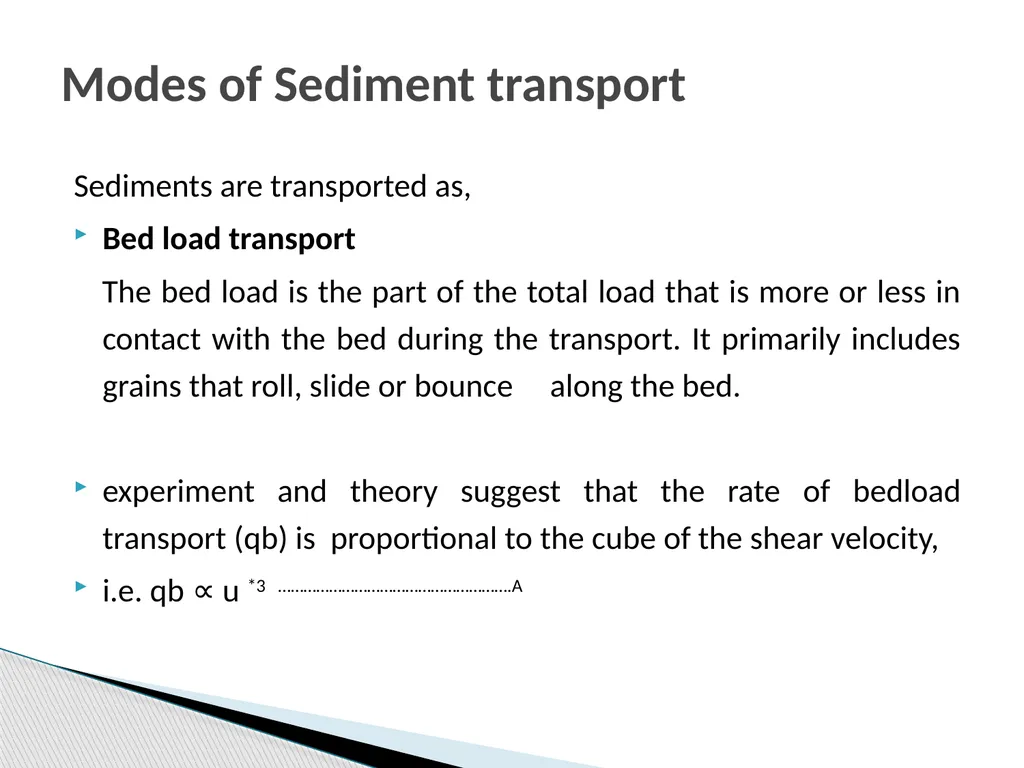
slide15. Sediments are transported as,
Bed load transport
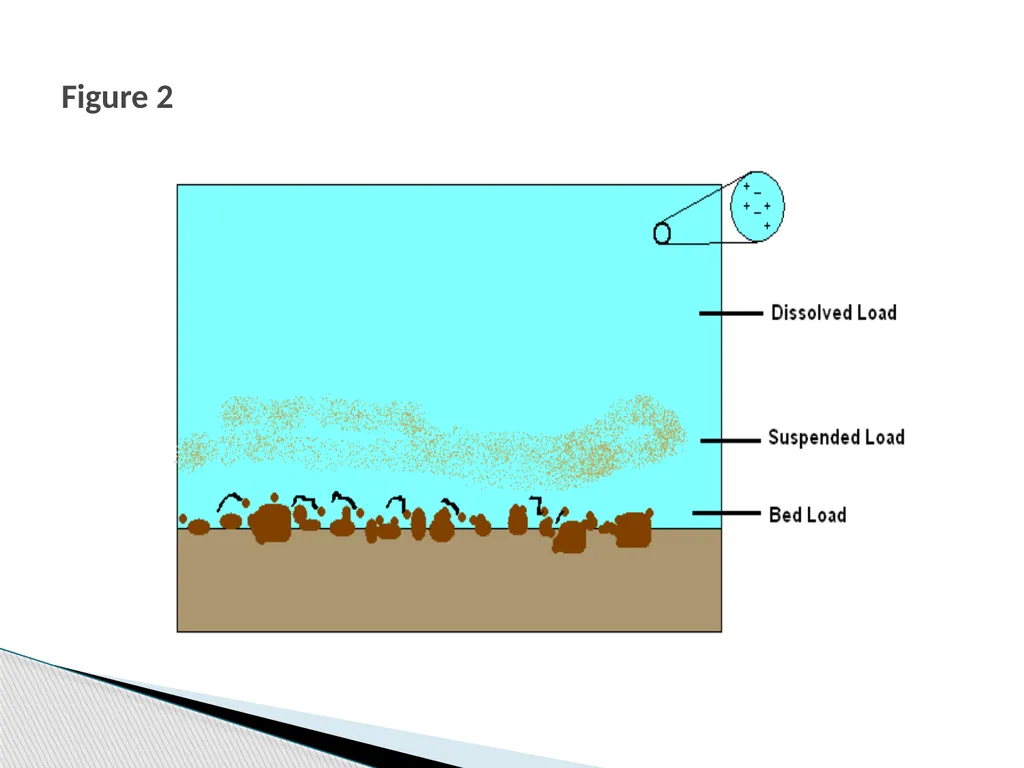
The bed load is the part of the total load that is more or less in contact with the bed during the transport. It primarily includes grains that roll, slide or bounce along the bed.
experiment and theory suggest that the rate of bedload transport (qb) is proportional to the cube of the shear velocity,
i.e. qb ∝ u *3 ……………………………………………….A Modes of Sediment transport<br>
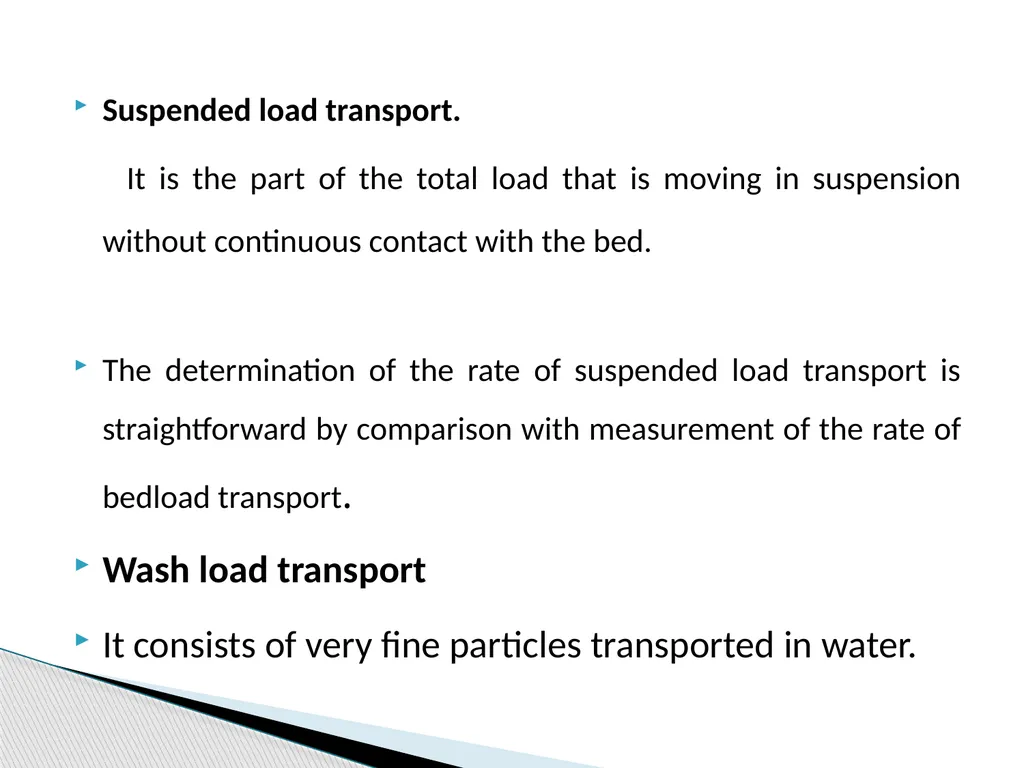
slide16. Suspended load transport.
It is the part of the total load that is moving in suspension without continuous contact with the bed.
The determination of the rate of suspended load transport is straightforward by comparison with measurement of the rate of bedload transport.
Wash load transport
It consists of very fine particles transported in water.<br>
slide17. Figure 2<br>
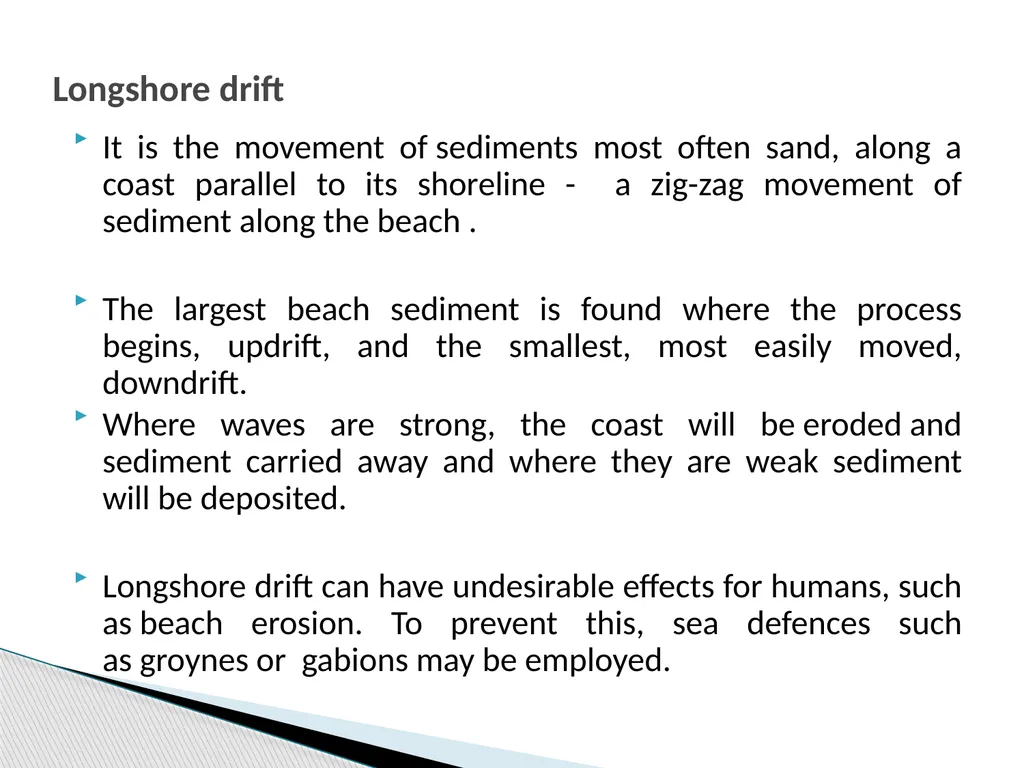
slide18. It is the movement of sediments most often sand, along a coast parallel to its shoreline - a zig-zag movement of sediment along the beach .
The largest beach sediment is found where the process begins, updrift, and the smallest, most easily moved, downdrift.
Where waves are strong, the coast will be eroded and sediment carried away and where they are weak sediment will be deposited.
Longshore drift can have undesirable effects for humans, such as beach erosion. To prevent this, sea defences such as groynes or gabions may be employed. Longshore drift<br>
slide19. Where beaches have become severely eroded by longshore drift and little material is replaced by natural processes, then the material may be artificially replaced by beach nourishment.
Net rate:
Gross rate:<br>
slide20. Model theories for the calculation of longshore drift are
Energy flux model
Energetic model
Suspended transport model<br>
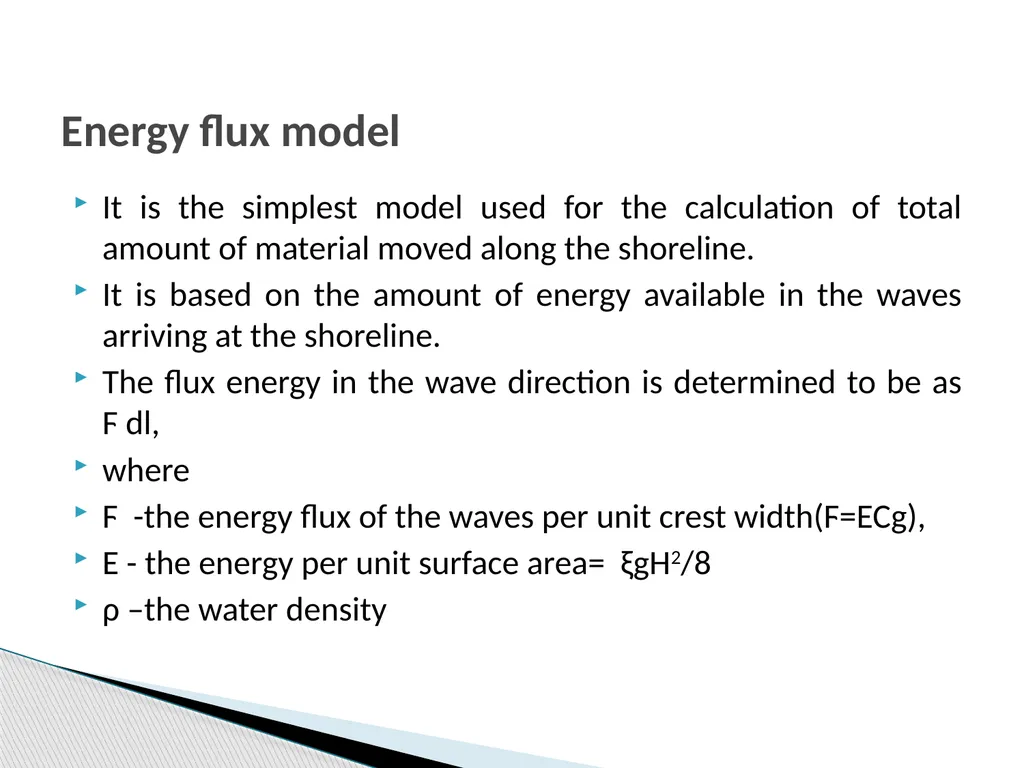
slide21. It is the simplest model used for the calculation of total amount of material moved along the shoreline.
It is based on the amount of energy available in the waves arriving at the shoreline.
The flux energy in the wave direction is determined to be as Ϝ dl,
where
Ϝ -the energy flux of the waves per unit crest width(Ϝ=ECg),
E - the energy per unit surface area= ξgH2/8
ρ –the water density Energy flux model<br>
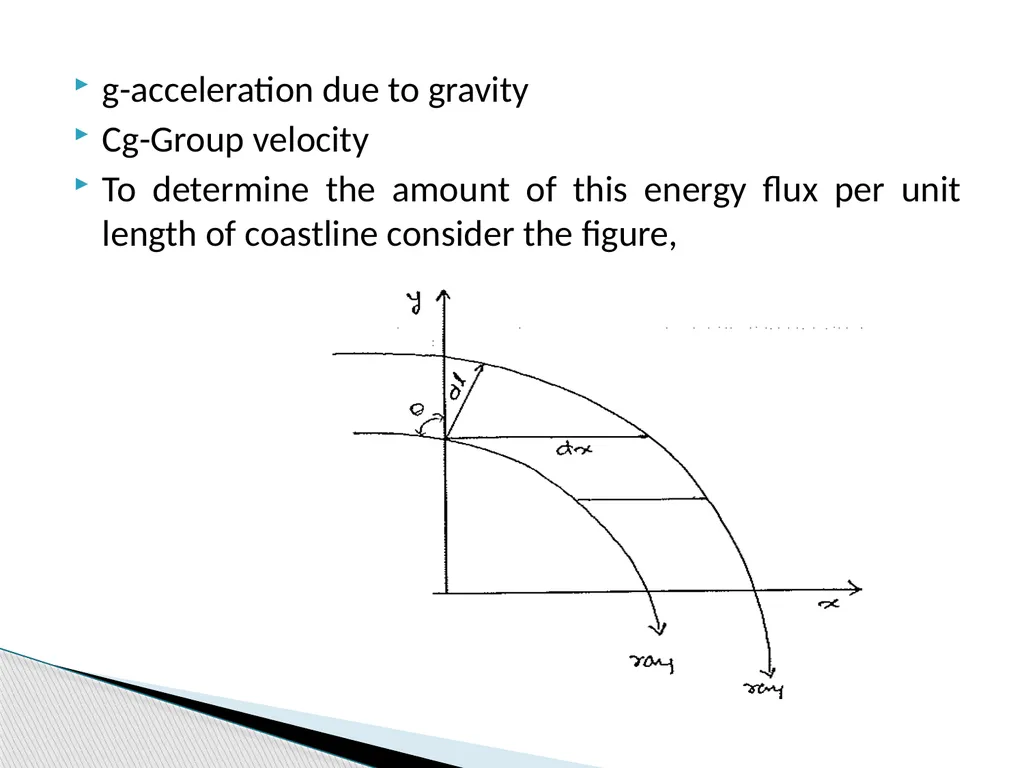
slide22. g-acceleration due to gravity
Cg-Group velocity
To determine the amount of this energy flux per unit length of coastline consider the figure,<br>
slide23. dx=dl/cosθ,
where θis the angle the wave ray makes with the onshore(y)direction.
Now it is supposed that the energy flux in the alongshore direction is responsible for the longshore sediment transport; therefore we multiply the energy flux per unit legth(dx=unity) of beach by sinθ to obtain
Ϝcosθsinθ= Pl=ECgsinθcosθ= (ρ gCgsin2θ)/16<br>
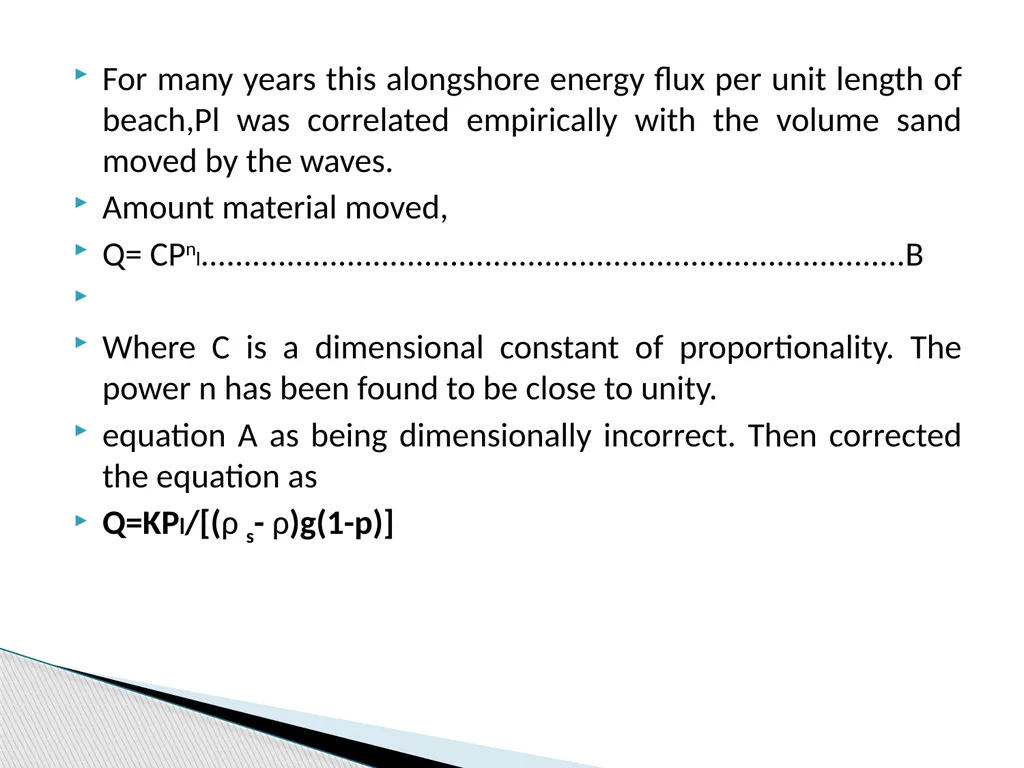
slide24. For many years this alongshore energy flux per unit length of beach,Pl was correlated empirically with the volume sand moved by the waves.
Amount material moved,
Q= CPnl..................................................................................B
Where C is a dimensional constant of proportionality. The power n has been found to be close to unity.
equation A as being dimensionally incorrect. Then corrected the equation as
Q=KPl/[(ρ s- ρ)g(1-p)]<br>
slide25. Where -p is the porosity of the sediment, which is typically about .3 to .4. the porosity is introduced to convert sand weight to sad volume, taking into account the voids that occur with in the sand.
K-is the dimensionless parameter, its value ranging from 0.2 to 2.<br>
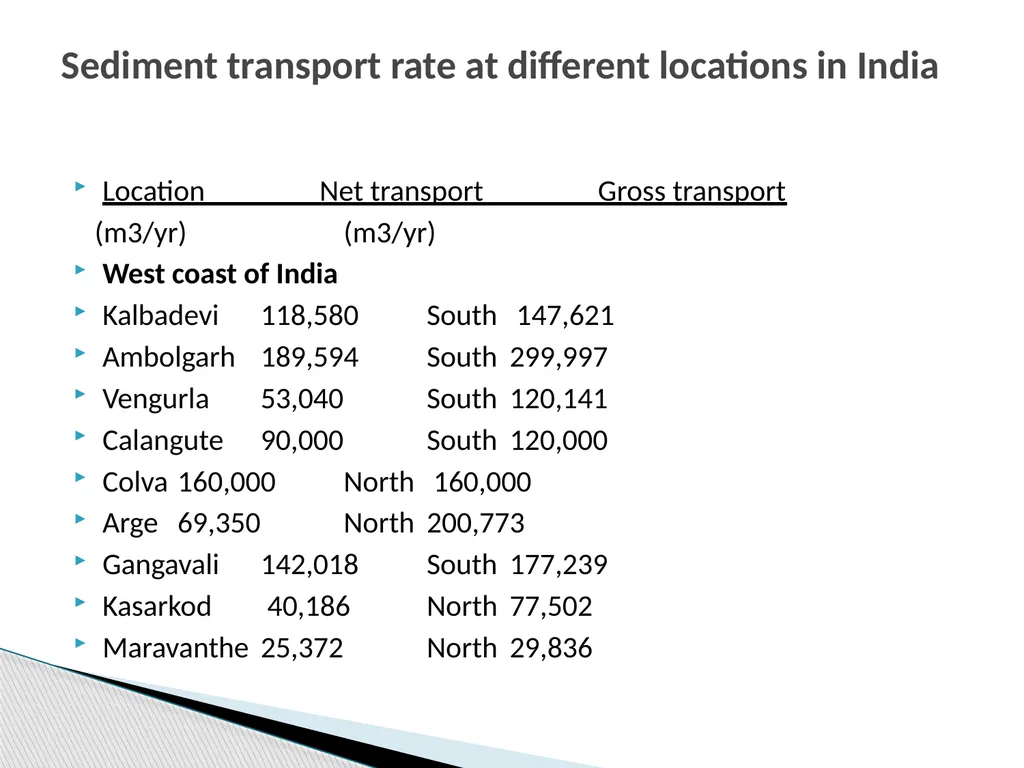
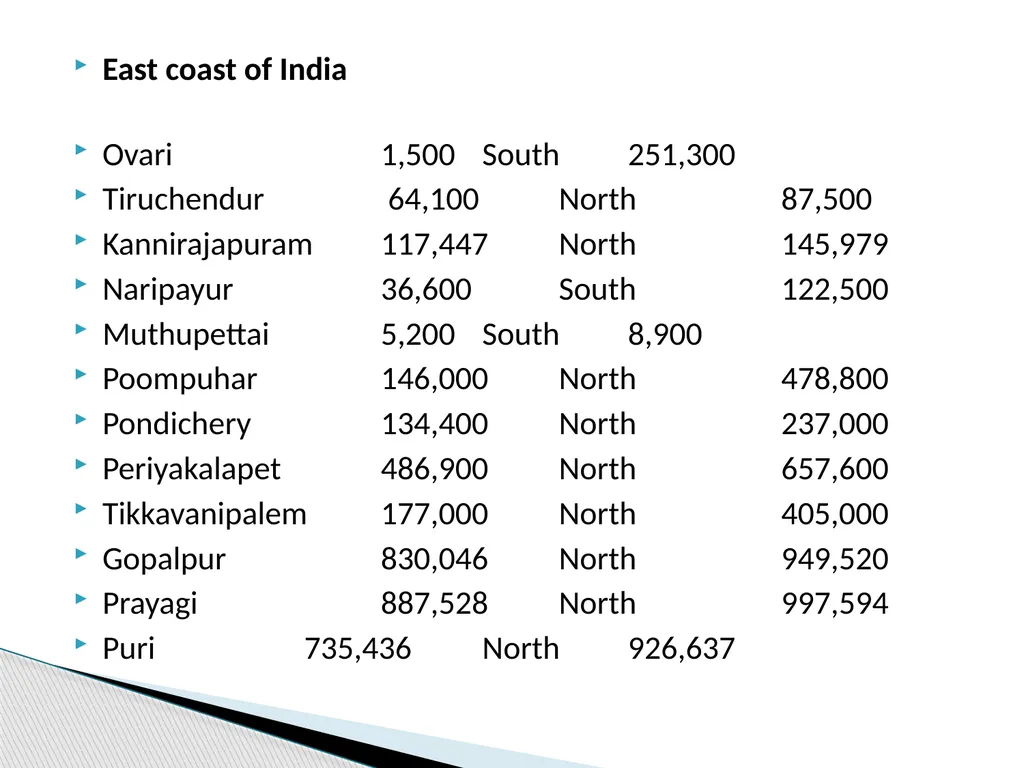
slide26. Longshore sediment transport rate (LSTR) reported for different locations along the Indian coast shows local reversals in the transport direction in a number of locations along the west coast.
It was found that the annual gross sediment transport rate was high (»1 * 106m3) along the coast of south Orissa and south Kerala. Longshore Sediment transport rate at different locations in India<br>
slide27. Location Net transport Gross transport
(m3/yr) (m3/yr)
West coast of India
Kalbadevi 118,580 South 147,621
Ambolgarh 189,594 South 299,997
Vengurla 53,040 South 120,141
Calangute 90,000 South 120,000
Colva 160,000 North 160,000
Arge 69,350 North 200,773
Gangavali 142,018 South 177,239
Kasarkod 40,186 North 77,502
Maravanthe 25,372 North 29,836 Sediment transport rate at different locations in India<br>
slide28. Kasargod 736,772 South 958,478
Kannur 19,434 South 561,576
Kozhikode 114,665 South 256,697
Nattika 192,818 North 660,276
Andhakaranazhi 202,096 South 599,484
Alleppey 16,929 North 62,519
Kollam 383,784 South 805,296
Thiruvananthapuram 99,159 North 1231,153
Kolachel 302,400 West 946,500<br>
slide29. East coast of India
Ovari 1,500 South 251,300
Tiruchendur 64,100 North 87,500
Kannirajapuram 117,447 North 145,979
Naripayur 36,600 South 122,500
Muthupettai 5,200 South 8,900
Poompuhar 146,000 North 478,800
Pondichery 134,400 North 237,000
Periyakalapet 486,900 North 657,600
Tikkavanipalem 177,000 North 405,000
Gopalpur 830,046 North 949,520
Prayagi 887,528 North 997,594
Puri 735,436 North 926,637<br>
slide30. Cross shore transport is a result of the water motions due to the waves and the undertow.
Here the sediment transport is perpendicular to the shore.
Important factors in determining the cross-shore transport of sand are
The ratio of wave height to wavelength
Physical parameters of the beach;
i.e., grain-size distribution, cohesiveness, beach
slope also play an important role. Onshore-offshore transport<br>
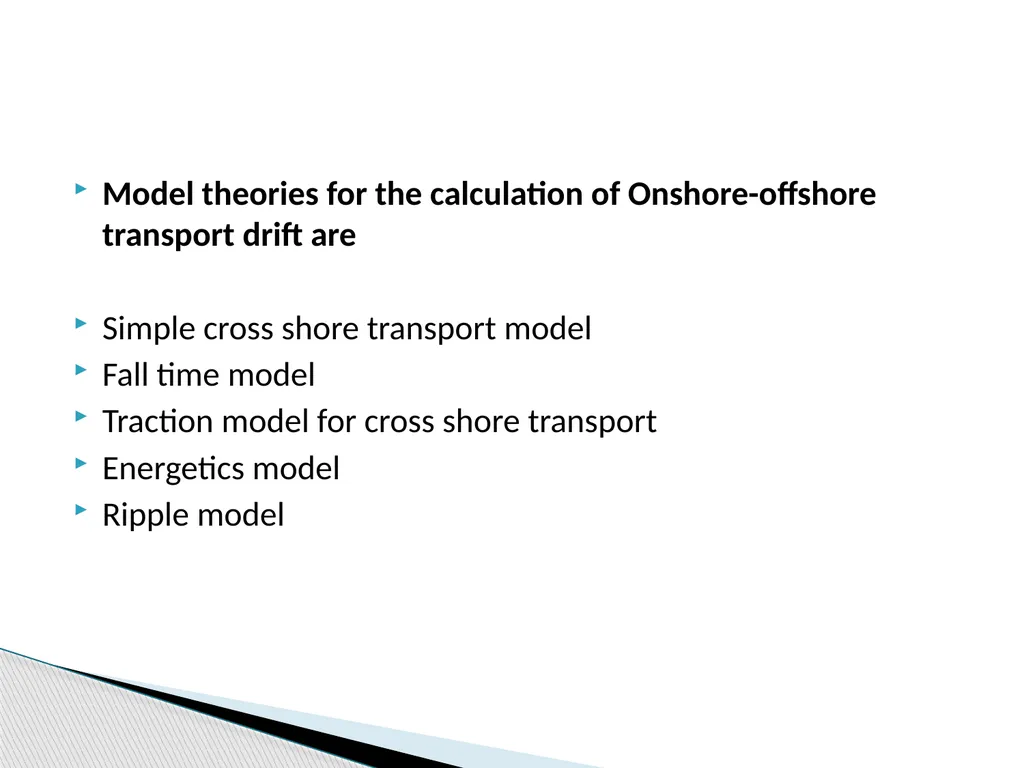
slide31. Model theories for the calculation of Onshore-offshore transport drift are
Simple cross shore transport model
Fall time model
Traction model for cross shore transport
Energetics model
Ripple model<br>
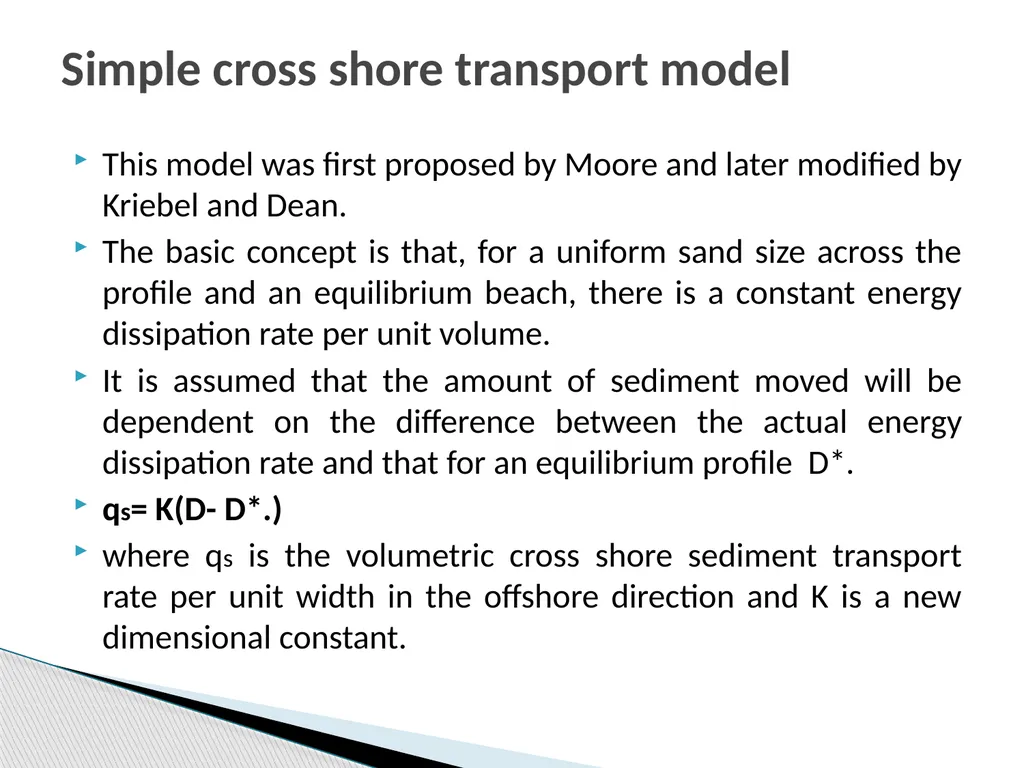
slide32. This model was first proposed by Moore and later modified by Kriebel and Dean.
The basic concept is that, for a uniform sand size across the profile and an equilibrium beach, there is a constant energy dissipation rate per unit volume.
It is assumed that the amount of sediment moved will be dependent on the difference between the actual energy dissipation rate and that for an equilibrium profile D*.
qs= K(D- D*.)
where qs is the volumetric cross shore sediment transport rate per unit width in the offshore direction and K is a new dimensional constant. Simple cross shore transport model<br>
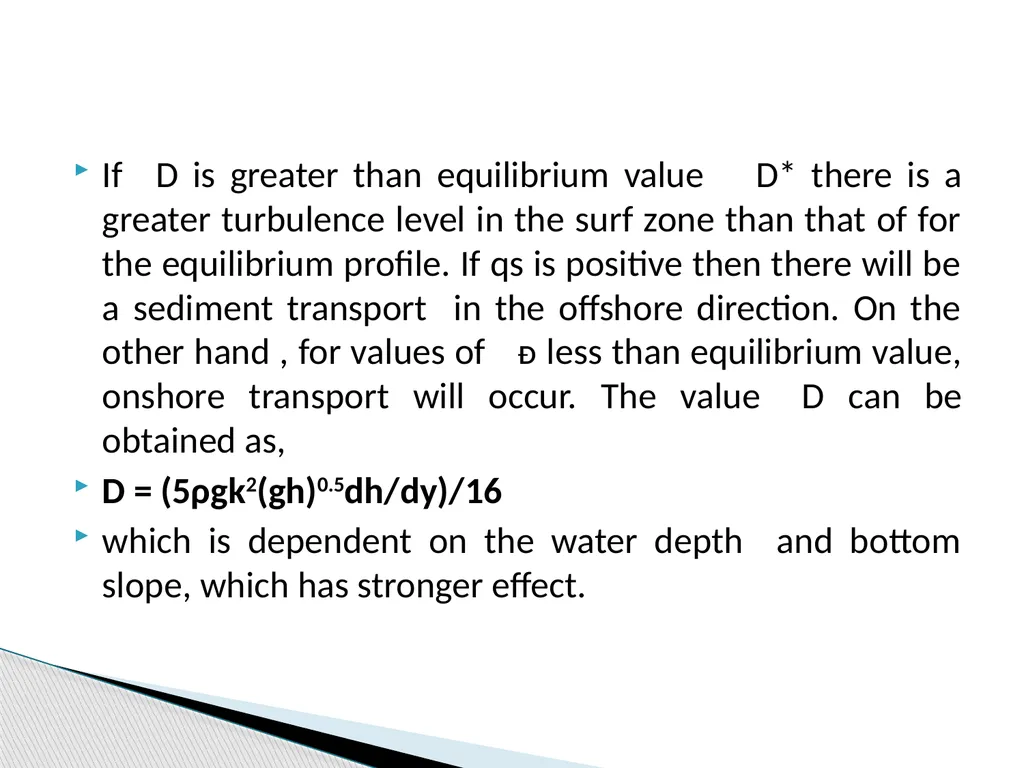
slide33. If D is greater than equilibrium value D* there is a greater turbulence level in the surf zone than that of for the equilibrium profile. If qs is positive then there will be a sediment transport in the offshore direction. On the other hand , for values of ᴆ less than equilibrium value, onshore transport will occur. The value D can be obtained as,
D = (5ρgk2(gh)0.5dh/dy)/16
which is dependent on the water depth and bottom slope, which has stronger effect.<br>
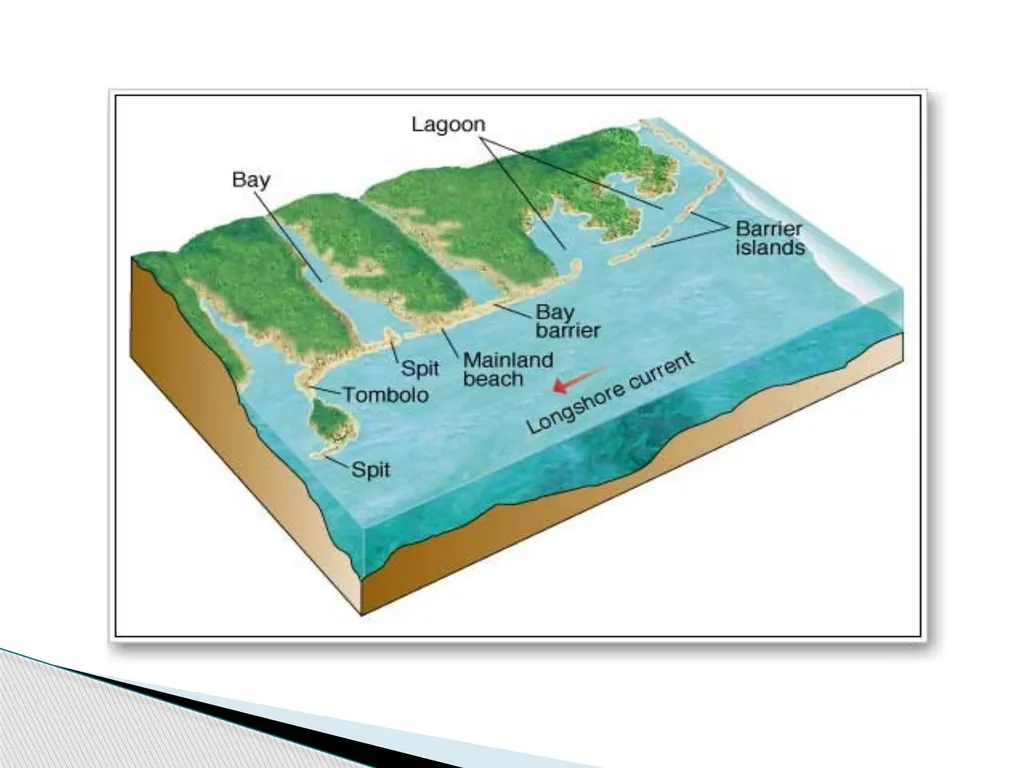
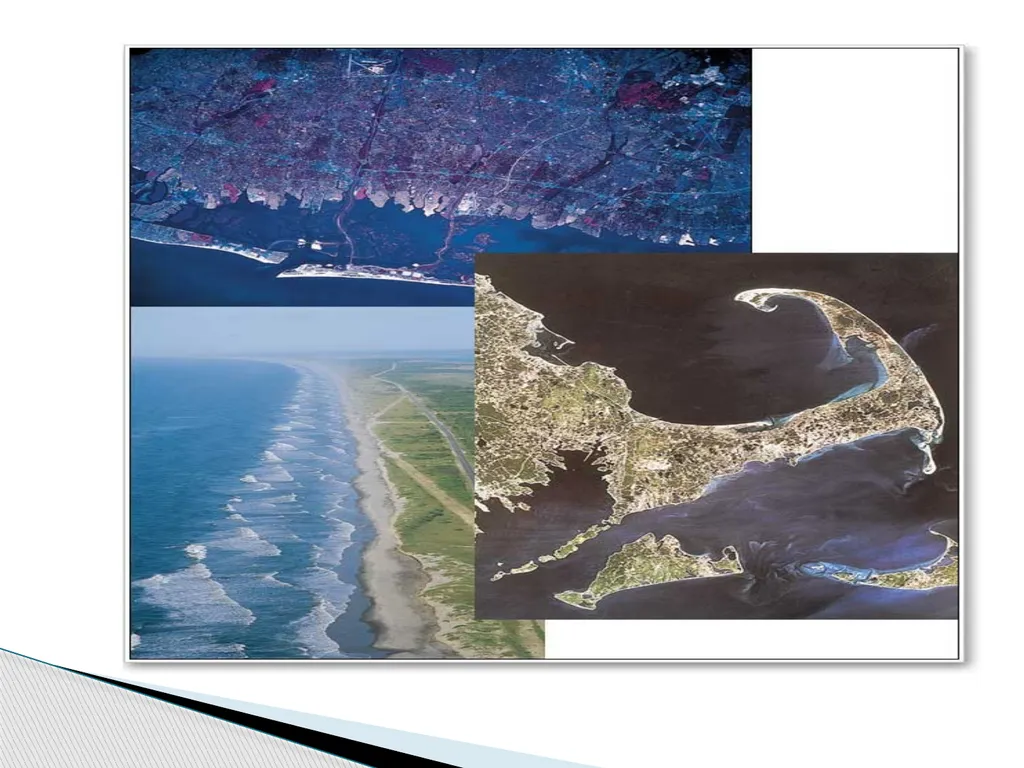
slide34. Onshore offshore drift and longshore drift deposit and shape debris to produce a variety of landforms. A spit is an elongated deposit that extends from the land edge out to sea. It may be shaped to produce a distinctly curved end, as in Cape Cod. Another landform that attaches an island to the mainland is known as a tombolo, while deposits may also accumulate to create barriers such as a bay barrier. Landforms of Littoral Drift<br>
slide36. Excellent recent examples of seasonal cross-shore transport and the resultant change in beach profile, -Imperial Beach, La Jolla, and Carlsbad.<br>
slide38. Coastal engineers, physical oceanographers and geomorphologists generally carry out measurements of sediment transport using the following methods :
Wave refraction studies Determines places of wave convergence or divergence and provide quantitative measurement.
Using geomorphic indicators
Based on geomorphic indicators sediment transport direction is decided. Sediment transport measurements<br>
slide39. Sedimentological methods.
Beach profile study, sediment budget measurement.
Sediment trap study Suspended sediments are collected in sediment trap and are measured
Artificial tracer tracking Sediment transport direction detected from the movement of artificial tracers.<br>
slide40. Coastal processes are highly unpredictable and is a challenge to coastal scientists.
Coastal processes are important in the case of
Prediction of environmental quality and impact
Habitat stability,
Public health risks,
Marine hazards such as ship grounding
Access to ports, seabed scouring Conclusion<br>
slide41. Siltation of harbours, infill of reservoirs and artificial lakes
And in coastline protection.
It is very crucial to understand the nearshore physical system, the consequent impact on sediment dynamics, and the coastline’s response to it.<br>
slide42. Robert G.Dean &Robert A.Dalrymple,Coastal processes with engineering applications,2002,04.
Walton Jr., T. L. and Bruno, R. O., Longshore transport at a detached break water, Phase II. J. Coast. Res., 1989, 5, 679–691.
U.S corps engineers, Coastal engineering manual.
www.googlebooks.com Refernces<br>
slide43. THANK YOU…………<br>
slide44. This powerpoint was kindly donated to
www.worldofteaching.com
http://www.worldofteaching.com
Is home to well over a thousand powerpoints submitted by teachers. This a free site. Please visit and I hope it will help in your teaching<br>
Krishnaprasad V N
M090160CE<br>
slide2. Coastal processes are the set of mechanisms that operate along a coastline, bringing about various combinations of erosion and deposition.
The land water interface along the coastline is always in a highly dynamic state and nature works towards maintaining an equilibrium condition.
The energy due to tide, waves, wind and currents is constantly working in the coastal zone. Dissipation of energy (due to tide, wind, waves and current) is often provided by the beaches, mudflats, marshes and mangroves. Introduction<br>
slide3. Human use of the coasts also requires space and herein lays the conflict, which results in unstable coastal systems. This induces coastal erosion, sediment transport and accretion.
Coastal processes are highly unpredictable and is a challenge to coastal scientists.
Some of the coastal processes are
Sediment transport
currents
Denudation
Deposition
Erosion<br>
slide4. Flooding
Diffraction
Refraction
Sediment transport is the one of the important coastal process.
The analysis and prediction of sediment transport have great commercial, aesthetic, social, and scientific importance owing to the sustainable development and coastal zone management.<br>
slide5. accretion - natural or artificial deposition of sediment in a particular location
beach nourishment - the restoration of a beach by the mechanical placement of sand on the beach for recreational and/ or shore protection purposes.
cross shore transport - the displacement of sediment perpendicular to the shore
erosion - the removal of sediment from a particular location by the action of wind or water. Sediment Transport and Coastal Processes Definitions<br>
slide6. groin - shore perpendicular structure, installed singly or as a field of groins, designed to trap sand from the littoral drift system .
longshore transport (littoral drift) - the displacement of sediment down the shore (parallel to the shore).
offshore transport - movement of sediment or water away from the shore<br>
slide7. longshore bar - offshore ridge or mound of sand, gravel or other loose material running parallel to the shore which is submerged (at least at high tide) and located a short distance from the shore.
tombolo - the combination of an offshore rock or island which is connected to the beach by a sand spit.
sand spit - low tongue of land or a relatively long, narrow shoal extending from the land.<br>
slide8. Gabions: Boulders and rocks are wired into mesh cages and usually placed in front of areas vulnerable to heavy to moderate erosion.
onshore transport - movement of sediment or water toward the shore.<br>
slide9. The offshore
Nearshore
Beach
Coast 1.Coastal profile<br>
slide10. Figure 1<br>
slide11. Changes in water level
Tides
Waves
Currents
Stream outflow Processes responsible for initiating sediment Transportation<br>
slide12. The areas, most directly affected by the forces of the sea are the beaches, the gulfs, and the nearshore zone regions that experience the full impact of the sea’s energy.
There are two general types of dynamic beach response to wave motion:
Response to normal condition
Response to storm condition Coastal response<br>
slide13. Normal condition prevail most of the time, and the wave energy is easily dissipated by the beach’s natural defence mechanisms.
When storm conditions generates waves containing increased amounts of energy, the coast must respond with extraordinary measures, such as sacrificing large section of beach and dune.
Alternate erosion and accretion may be seasonal on some beaches; the winter storm waves erode the beach, and the summer waves rebuilds it.<br>
slide14. Another nearshore dynamical system is littoral transport - the movement of sediments in the nearshore zone by waves and currents.
Littoral transport is divided into two general classes:
Longshore transport: Transport parallel to the shore.
Onshore-offshore transport:
Transport perpendicular to the shore.<br>
slide15. Sediments are transported as,
Bed load transport
The bed load is the part of the total load that is more or less in contact with the bed during the transport. It primarily includes grains that roll, slide or bounce along the bed.
experiment and theory suggest that the rate of bedload transport (qb) is proportional to the cube of the shear velocity,
i.e. qb ∝ u *3 ……………………………………………….A Modes of Sediment transport<br>
slide16. Suspended load transport.
It is the part of the total load that is moving in suspension without continuous contact with the bed.
The determination of the rate of suspended load transport is straightforward by comparison with measurement of the rate of bedload transport.
Wash load transport
It consists of very fine particles transported in water.<br>
slide17. Figure 2<br>
slide18. It is the movement of sediments most often sand, along a coast parallel to its shoreline - a zig-zag movement of sediment along the beach .
The largest beach sediment is found where the process begins, updrift, and the smallest, most easily moved, downdrift.
Where waves are strong, the coast will be eroded and sediment carried away and where they are weak sediment will be deposited.
Longshore drift can have undesirable effects for humans, such as beach erosion. To prevent this, sea defences such as groynes or gabions may be employed. Longshore drift<br>
slide19. Where beaches have become severely eroded by longshore drift and little material is replaced by natural processes, then the material may be artificially replaced by beach nourishment.
Net rate:
Gross rate:<br>
slide20. Model theories for the calculation of longshore drift are
Energy flux model
Energetic model
Suspended transport model<br>
slide21. It is the simplest model used for the calculation of total amount of material moved along the shoreline.
It is based on the amount of energy available in the waves arriving at the shoreline.
The flux energy in the wave direction is determined to be as Ϝ dl,
where
Ϝ -the energy flux of the waves per unit crest width(Ϝ=ECg),
E - the energy per unit surface area= ξgH2/8
ρ –the water density Energy flux model<br>
slide22. g-acceleration due to gravity
Cg-Group velocity
To determine the amount of this energy flux per unit length of coastline consider the figure,<br>
slide23. dx=dl/cosθ,
where θis the angle the wave ray makes with the onshore(y)direction.
Now it is supposed that the energy flux in the alongshore direction is responsible for the longshore sediment transport; therefore we multiply the energy flux per unit legth(dx=unity) of beach by sinθ to obtain
Ϝcosθsinθ= Pl=ECgsinθcosθ= (ρ gCgsin2θ)/16<br>
slide24. For many years this alongshore energy flux per unit length of beach,Pl was correlated empirically with the volume sand moved by the waves.
Amount material moved,
Q= CPnl..................................................................................B
Where C is a dimensional constant of proportionality. The power n has been found to be close to unity.
equation A as being dimensionally incorrect. Then corrected the equation as
Q=KPl/[(ρ s- ρ)g(1-p)]<br>
slide25. Where -p is the porosity of the sediment, which is typically about .3 to .4. the porosity is introduced to convert sand weight to sad volume, taking into account the voids that occur with in the sand.
K-is the dimensionless parameter, its value ranging from 0.2 to 2.<br>
slide26. Longshore sediment transport rate (LSTR) reported for different locations along the Indian coast shows local reversals in the transport direction in a number of locations along the west coast.
It was found that the annual gross sediment transport rate was high (»1 * 106m3) along the coast of south Orissa and south Kerala. Longshore Sediment transport rate at different locations in India<br>
slide27. Location Net transport Gross transport
(m3/yr) (m3/yr)
West coast of India
Kalbadevi 118,580 South 147,621
Ambolgarh 189,594 South 299,997
Vengurla 53,040 South 120,141
Calangute 90,000 South 120,000
Colva 160,000 North 160,000
Arge 69,350 North 200,773
Gangavali 142,018 South 177,239
Kasarkod 40,186 North 77,502
Maravanthe 25,372 North 29,836 Sediment transport rate at different locations in India<br>
slide28. Kasargod 736,772 South 958,478
Kannur 19,434 South 561,576
Kozhikode 114,665 South 256,697
Nattika 192,818 North 660,276
Andhakaranazhi 202,096 South 599,484
Alleppey 16,929 North 62,519
Kollam 383,784 South 805,296
Thiruvananthapuram 99,159 North 1231,153
Kolachel 302,400 West 946,500<br>
slide29. East coast of India
Ovari 1,500 South 251,300
Tiruchendur 64,100 North 87,500
Kannirajapuram 117,447 North 145,979
Naripayur 36,600 South 122,500
Muthupettai 5,200 South 8,900
Poompuhar 146,000 North 478,800
Pondichery 134,400 North 237,000
Periyakalapet 486,900 North 657,600
Tikkavanipalem 177,000 North 405,000
Gopalpur 830,046 North 949,520
Prayagi 887,528 North 997,594
Puri 735,436 North 926,637<br>
slide30. Cross shore transport is a result of the water motions due to the waves and the undertow.
Here the sediment transport is perpendicular to the shore.
Important factors in determining the cross-shore transport of sand are
The ratio of wave height to wavelength
Physical parameters of the beach;
i.e., grain-size distribution, cohesiveness, beach
slope also play an important role. Onshore-offshore transport<br>
slide31. Model theories for the calculation of Onshore-offshore transport drift are
Simple cross shore transport model
Fall time model
Traction model for cross shore transport
Energetics model
Ripple model<br>
slide32. This model was first proposed by Moore and later modified by Kriebel and Dean.
The basic concept is that, for a uniform sand size across the profile and an equilibrium beach, there is a constant energy dissipation rate per unit volume.
It is assumed that the amount of sediment moved will be dependent on the difference between the actual energy dissipation rate and that for an equilibrium profile D*.
qs= K(D- D*.)
where qs is the volumetric cross shore sediment transport rate per unit width in the offshore direction and K is a new dimensional constant. Simple cross shore transport model<br>
slide33. If D is greater than equilibrium value D* there is a greater turbulence level in the surf zone than that of for the equilibrium profile. If qs is positive then there will be a sediment transport in the offshore direction. On the other hand , for values of ᴆ less than equilibrium value, onshore transport will occur. The value D can be obtained as,
D = (5ρgk2(gh)0.5dh/dy)/16
which is dependent on the water depth and bottom slope, which has stronger effect.<br>
slide34. Onshore offshore drift and longshore drift deposit and shape debris to produce a variety of landforms. A spit is an elongated deposit that extends from the land edge out to sea. It may be shaped to produce a distinctly curved end, as in Cape Cod. Another landform that attaches an island to the mainland is known as a tombolo, while deposits may also accumulate to create barriers such as a bay barrier. Landforms of Littoral Drift<br>
slide36. Excellent recent examples of seasonal cross-shore transport and the resultant change in beach profile, -Imperial Beach, La Jolla, and Carlsbad.<br>
slide38. Coastal engineers, physical oceanographers and geomorphologists generally carry out measurements of sediment transport using the following methods :
Wave refraction studies Determines places of wave convergence or divergence and provide quantitative measurement.
Using geomorphic indicators
Based on geomorphic indicators sediment transport direction is decided. Sediment transport measurements<br>
slide39. Sedimentological methods.
Beach profile study, sediment budget measurement.
Sediment trap study Suspended sediments are collected in sediment trap and are measured
Artificial tracer tracking Sediment transport direction detected from the movement of artificial tracers.<br>
slide40. Coastal processes are highly unpredictable and is a challenge to coastal scientists.
Coastal processes are important in the case of
Prediction of environmental quality and impact
Habitat stability,
Public health risks,
Marine hazards such as ship grounding
Access to ports, seabed scouring Conclusion<br>
slide41. Siltation of harbours, infill of reservoirs and artificial lakes
And in coastline protection.
It is very crucial to understand the nearshore physical system, the consequent impact on sediment dynamics, and the coastline’s response to it.<br>
slide42. Robert G.Dean &Robert A.Dalrymple,Coastal processes with engineering applications,2002,04.
Walton Jr., T. L. and Bruno, R. O., Longshore transport at a detached break water, Phase II. J. Coast. Res., 1989, 5, 679–691.
U.S corps engineers, Coastal engineering manual.
www.googlebooks.com Refernces<br>
slide43. THANK YOU…………<br>
slide44. This powerpoint was kindly donated to
www.worldofteaching.com
http://www.worldofteaching.com
Is home to well over a thousand powerpoints submitted by teachers. This a free site. Please visit and I hope it will help in your teaching<br>