Combined Air Emissions Reporting (CAER) for the Toxics Release Inventory (TRI), the National Emissions Inventory (NEI), and the StatesLocal MunicipalitiesTribes (SLT) Emission Inventories Phase 1 2017 Program Crosswalk Completed Phase 2
"Combined Air Emissions Reporting (CAER) for the" is the property of its rightful owner. Permission is granted to
download and print the materials on this website for personal, non-commercial use only, and to display it
on your personal computer provided you do not modify the materials and that you retain all copyright
notices contained in the materials. By downloading content from our website, you accept the terms of this
agreement.
Presentation Transcript
01
Combined Air Emissions Reporting (CAER) for the Toxics Release Inventory (TRI), the National Emissions Inventory (NEI), and the States/Local Municipalities/Tribes (SLT) Emission Inventories Phase 1 2017 “Program Crosswalk” Completed
Phase 2 2018 Preliminary findings presented here 1<br>
02
TRI/NEI/SLT Project: Purpose and Scope Purpose:
Identify and evaluate consistencies and possible workflows for sharing emissions data between TRI, SLTs, and NEI.
Scope- Phase 1:
Identify differences in terminology used to define reporting requirements in each program.
Identify pollutants that are common between the TRI and NEI, and specify how they relate to each other if there is not a one-to-one match.
Research how states use TRI data for their NEI submissions.
Team Members – Phase 1:
States: MN, SC
EPA: Office of Pollution Prevention & Toxics (OPPT), Office of Air Quality Planning & Standards (OAQPS), Office of Environmental Information (OEI)
Environmental Council of the States (ECOS) 2<br>
03
TRI/NEI/SLT Phase 1: Results and Findings NEI and TRI terms and requirements comparison 3<br>
04
TRI/NEI/SLT Phase 1: Results and Findings – cont’d (2) Pollutant Crosswalk
NEI:
Criteria air pollutants & precursors (CAPs)
Ammonia, Lead, VOC, PM2.5, PM10, NOx, CO, SO2
187 hazardous air pollutants (HAPs)
TRI:
2 of the CAPs: lead (which is both a HAP and CAP) and ammonia
Almost all (about 96%) of the 187 HAPs
In all, 692 chemicals and chemical categories 4 TRI Chemicals and Chemical Categories
(692) NEI Pollutants
(8 CAPs, 187 HAPs)<br>
05
TRI/NEI/SLT Phase 1: Results and Findings – cont’d (3) Pollutant Crosswalk
TRI pollutants to NEI pollutants and vice versa
Identified overlap in categories of chemicals
Discovered and corrected issue with NEI glycol ethers 5<br>
06
TRI/NEI/SLT Phase 1: Results and Findings – cont’d (4) Pollutant Crosswalk
Original posted in Sept, update posted in April
Use pollutant crosswalk to update EPA’s Substance Registry Services (SRS) 6 EPA’s Substance Registry Services (SRS)<br>
07
TRI/NEI/SLT Phase 1: Results and Findings – cont’d (5) Survey
Three states use TRI data for their EI submission: Illinois, Minnesota, and Indiana
Illinois and Minnesota use similar approach and incorporate TRI data into EI submission.
Indiana does not include TRI data in submission, but uses it to inform what they submit.
EPA also answered survey on how TRI is incorporated into the NEI
TRI data is incorporated by EPA after the Air Emissions Reporting Requirement (AERR) deadline
States and EPA report TRI data using the engineering judgement calculation method code 7<br>
08
8 Final report and pollutant crosswalk at https://www.epa.gov/e-enterprise/product-design-team CAER webinar - https://www.youtube.com/watch?v=6r_elMUTMfY<br>
09
TRI/NEI/SLT Project: Phase 2 Scope:
Quantify differences in emissions (TRI and NEI data for 2014)
Explore reasons for differences between reporting data
Research cross-program data sharing and recommendations
Develop comparisons and crosswalks for emission estimation method codes and control/treatment codes between NEI and TRI
Team Members:
States: MN, SC, MI, GA
EPA: Office of Pollution Prevention & Toxics (OPPT), Office of Air Quality Planning & Standards (OAQPS), Office of Environmental Information (OEI)
Environmental Council of the States (ECOS) 9<br>
10
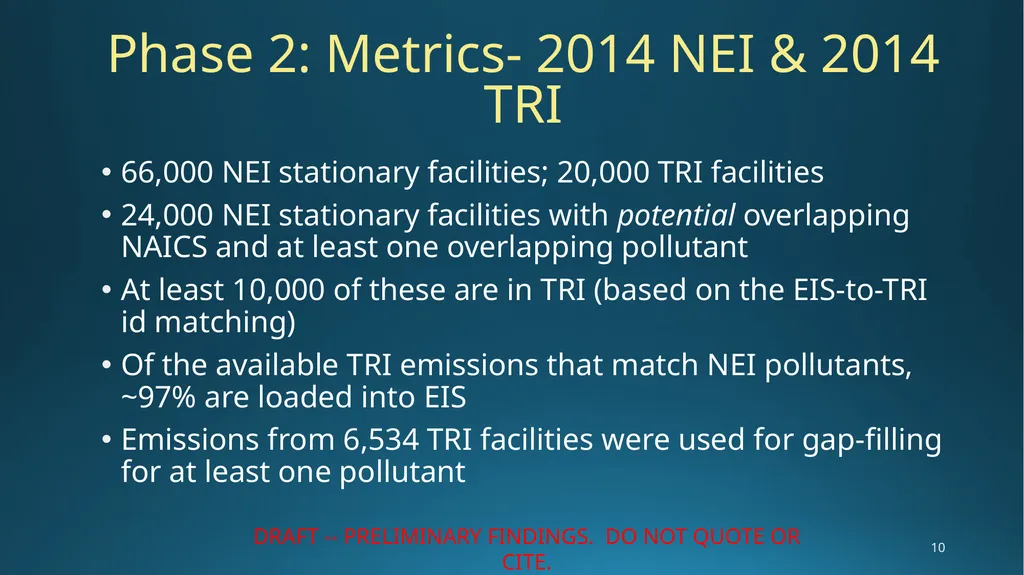
Phase 2: Metrics- 2014 NEI & 2014 TRI 66,000 NEI stationary facilities; 20,000 TRI facilities
24,000 NEI stationary facilities with potential overlapping NAICS and at least one overlapping pollutant
At least 10,000 of these are in TRI (based on the EIS-to-TRI id matching)
Of the available TRI emissions that match NEI pollutants, ~97% are loaded into EIS
Emissions from 6,534 TRI facilities were used for gap-filling for at least one pollutant 10 DRAFT -- PRELIMINARY FINDINGS. DO NOT QUOTE OR CITE.<br>
11
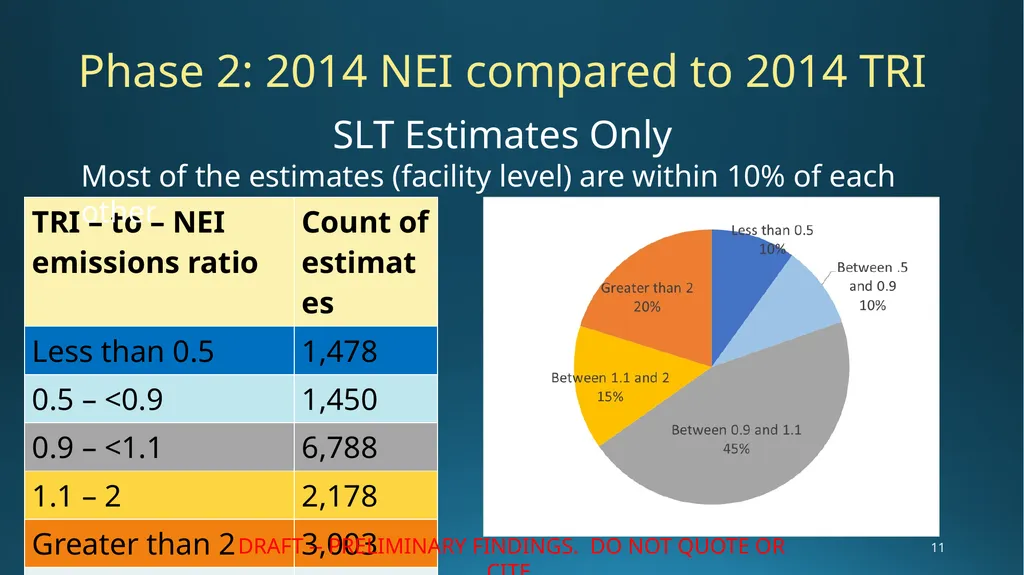
Phase 2: 2014 NEI compared to 2014 TRI 11 Most of the estimates (facility level) are within 10% of each other SLT Estimates Only DRAFT -- PRELIMINARY FINDINGS. DO NOT QUOTE OR CITE.<br>
12
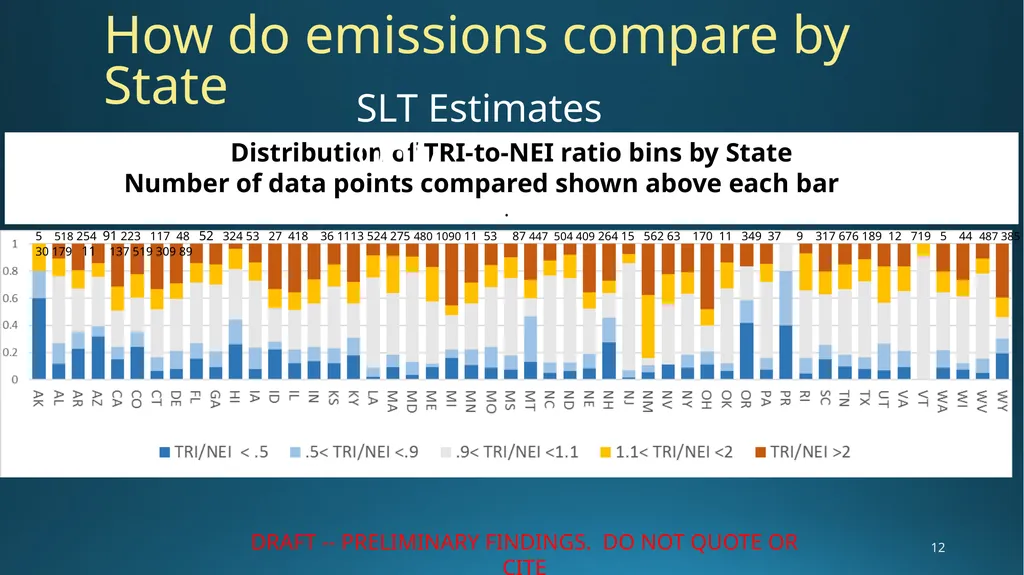
How do emissions compare by State DRAFT -- PRELIMINARY FINDINGS. DO NOT QUOTE OR CITE 12 SLT Estimates Only<br>
13
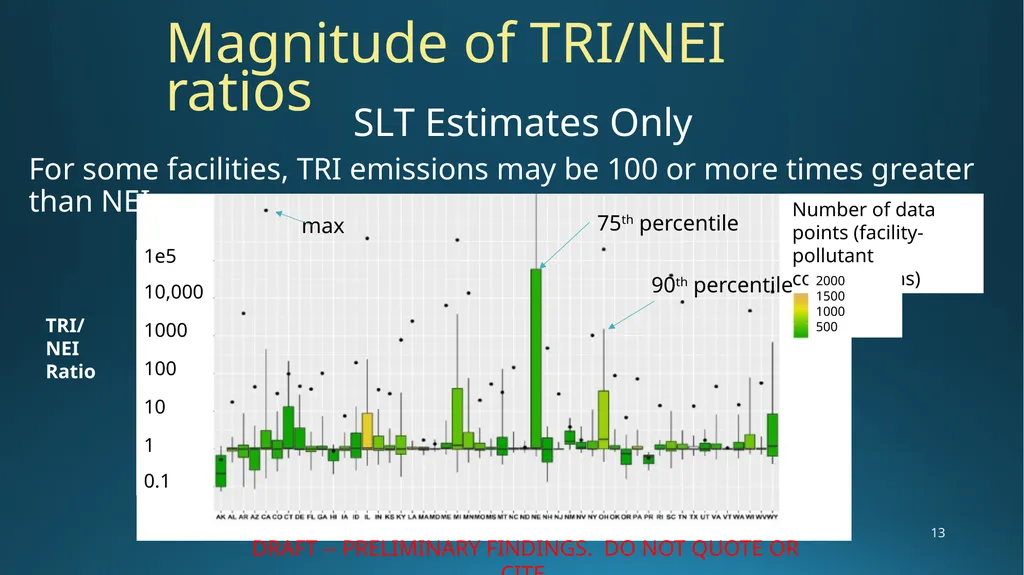
For some facilities, TRI emissions may be 100 or more times greater than NEI Magnitude of TRI/NEI ratios 13 Number of data points (facility-pollutant combinations) 1e5
10,000
1000
100
10
1
0.1 SLT Estimates Only DRAFT -- PRELIMINARY FINDINGS. DO NOT QUOTE OR CITE.<br>
14
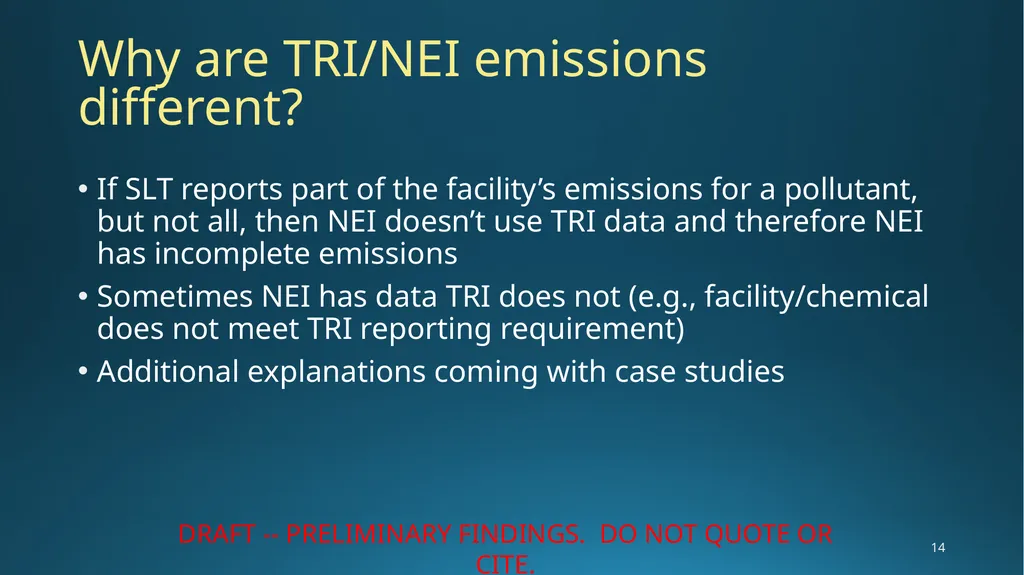
Why are TRI/NEI emissions different? If SLT reports part of the facility’s emissions for a pollutant, but not all, then NEI doesn’t use TRI data and therefore NEI has incomplete emissions
Sometimes NEI has data TRI does not (e.g., facility/chemical does not meet TRI reporting requirement)
Additional explanations coming with case studies 14 DRAFT -- PRELIMINARY FINDINGS. DO NOT QUOTE OR CITE.<br>
15
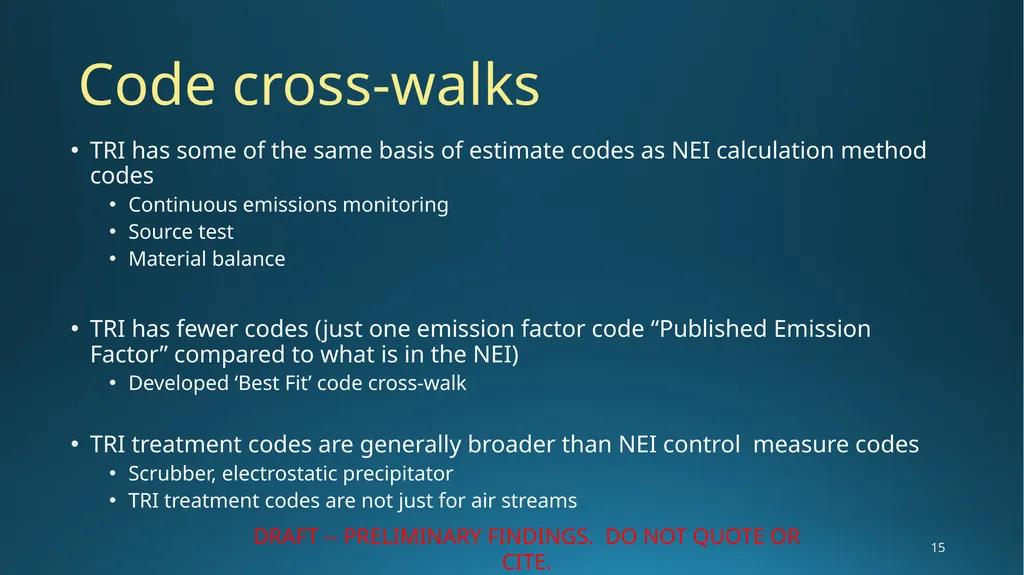
Code cross-walks TRI has some of the same basis of estimate codes as NEI calculation method codes
Continuous emissions monitoring
Source test
Material balance
TRI has fewer codes (just one emission factor code “Published Emission Factor” compared to what is in the NEI)
Developed ‘Best Fit’ code cross-walk
TRI treatment codes are generally broader than NEI control measure codes
Scrubber, electrostatic precipitator
TRI treatment codes are not just for air streams 15 DRAFT -- PRELIMINARY FINDINGS. DO NOT QUOTE OR CITE.<br>
16
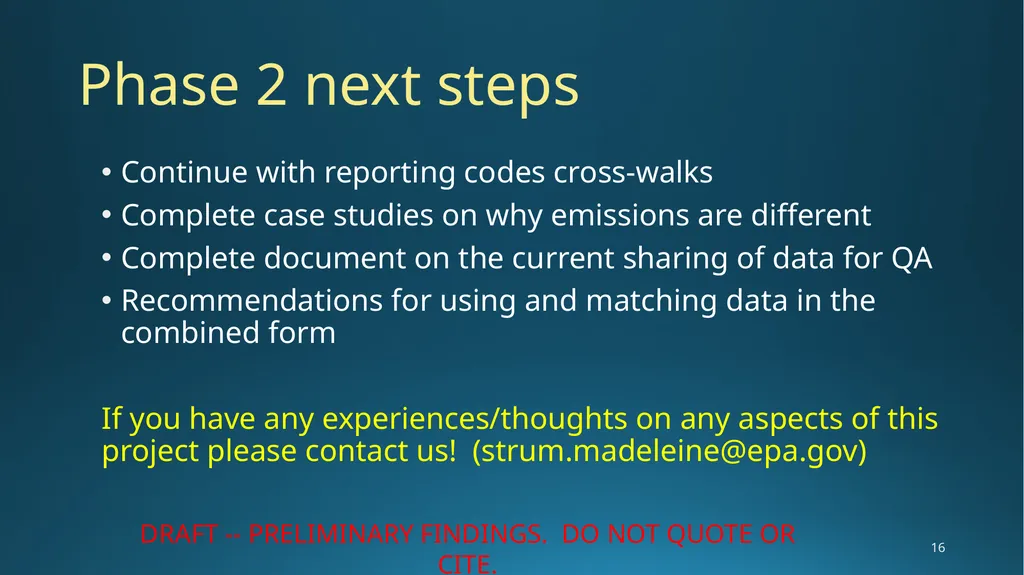
Phase 2 next steps Continue with reporting codes cross-walks
Complete case studies on why emissions are different
Complete document on the current sharing of data for QA
Recommendations for using and matching data in the combined form
If you have any experiences/thoughts on any aspects of this project please contact us! (strum.madeleine@epa.gov) 16 DRAFT -- PRELIMINARY FINDINGS. DO NOT QUOTE OR CITE.<br>