
Components of an HEC-HMS Model Basin Model Basin

Components of an HEC-HMS Model Basin Model Basin
1 / 1
Components of an HEC-HMS Model Basin Model Basin - slide 1 of 3 Components of an HEC-HMS Model Basin Model Basin - slide 2 of 3 Components of an HEC-HMS Model Basin Model Basin - slide 3 of 3
Components of an HEC-HMS Model Basin Model Basin Subbasin, Reach, Reservoir, Junction, Diversion, Source, Sink Meteorologic Model Specified hyetograph, gage weights, frequency storm, gridded precipitation, inverse distance, SCS storm

Related Topics

Download this presentation From Below

"Components of an HEC-HMS Model Basin Model Basin" is the property of its rightful owner. Permission is granted to download and print the materials on this website for personal, non-commercial use only, and to display it on your personal computer provided you do not modify the materials and that you retain all copyright notices contained in the materials. By downloading content from our website, you accept the terms of this agreement.

Presentation Transcript

01
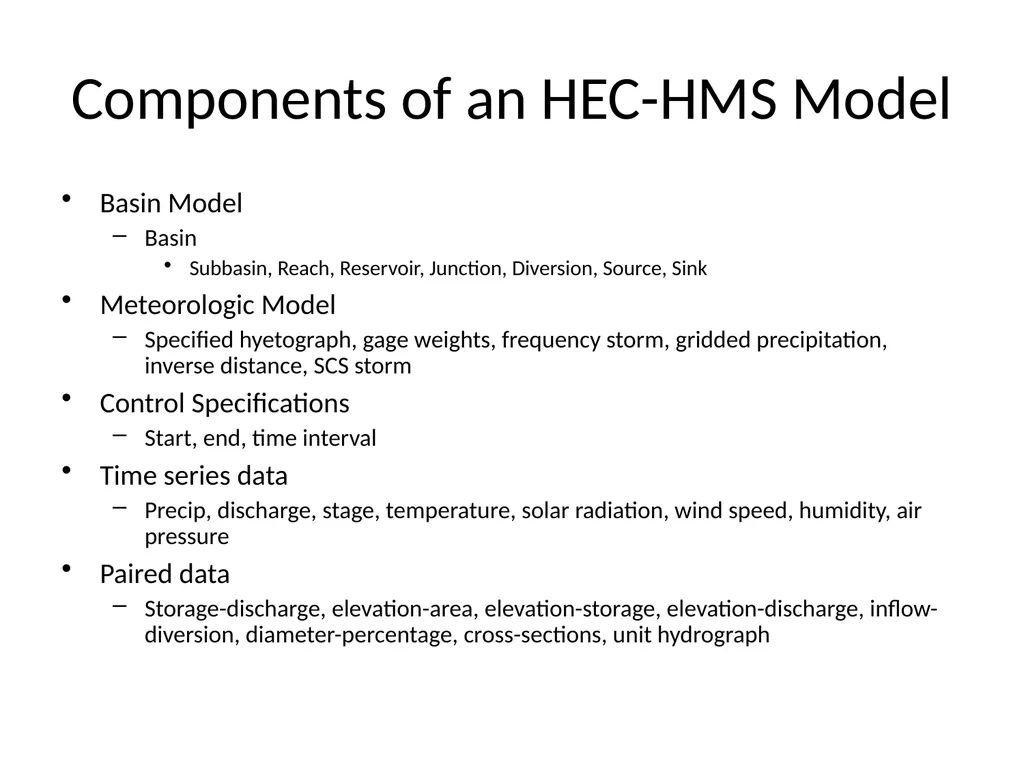
Components of an HEC-HMS Model Basin Model
Basin
Subbasin, Reach, Reservoir, Junction, Diversion, Source, Sink
Meteorologic Model
Specified hyetograph, gage weights, frequency storm, gridded precipitation, inverse distance, SCS storm
Control Specifications
Start, end, time interval
Time series data
Precip, discharge, stage, temperature, solar radiation, wind speed, humidity, air pressure
Paired data
Storage-discharge, elevation-area, elevation-storage, elevation-discharge, inflow-diversion, diameter-percentage, cross-sections, unit hydrograph<br>
02
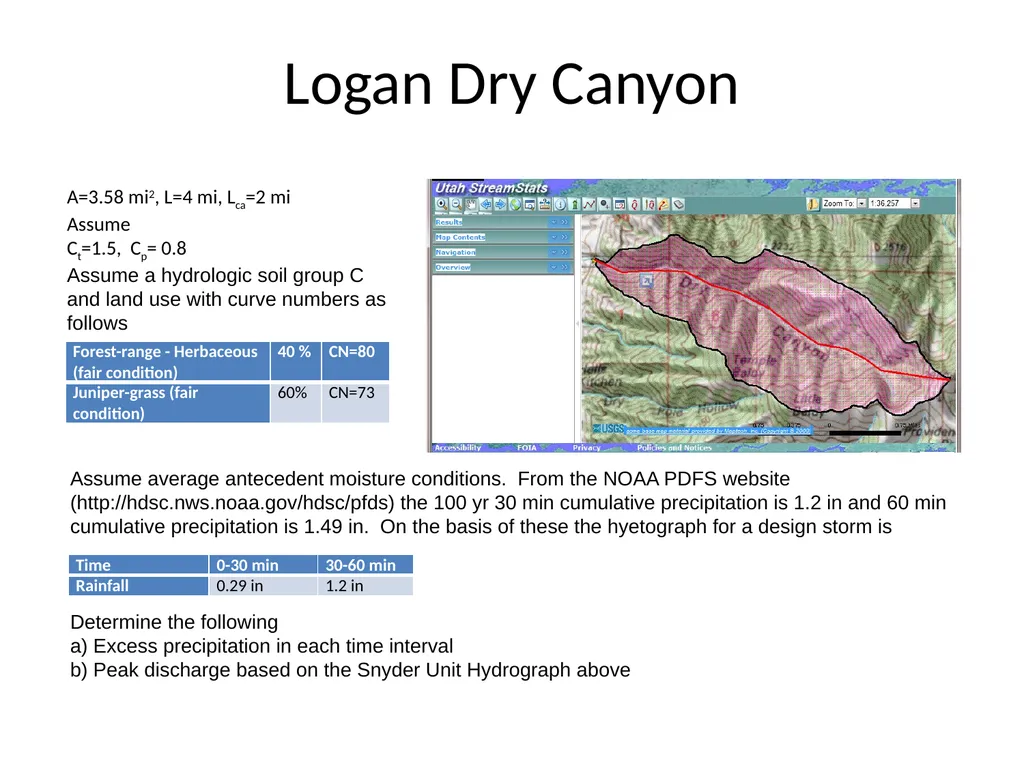
Assume average antecedent moisture conditions. From the NOAA PDFS website (http://hdsc.nws.noaa.gov/hdsc/pfds) the 100 yr 30 min cumulative precipitation is 1.2 in and 60 min cumulative precipitation is 1.49 in. On the basis of these the hyetograph for a design storm is


Determine the following
a) Excess precipitation in each time interval
b) Peak discharge based on the Snyder Unit Hydrograph above Logan Dry Canyon A=3.58 mi2, L=4 mi, Lca=2 mi
Assume
Ct=1.5, Cp= 0.8
Assume a hydrologic soil group C and land use with curve numbers as follows<br>
03
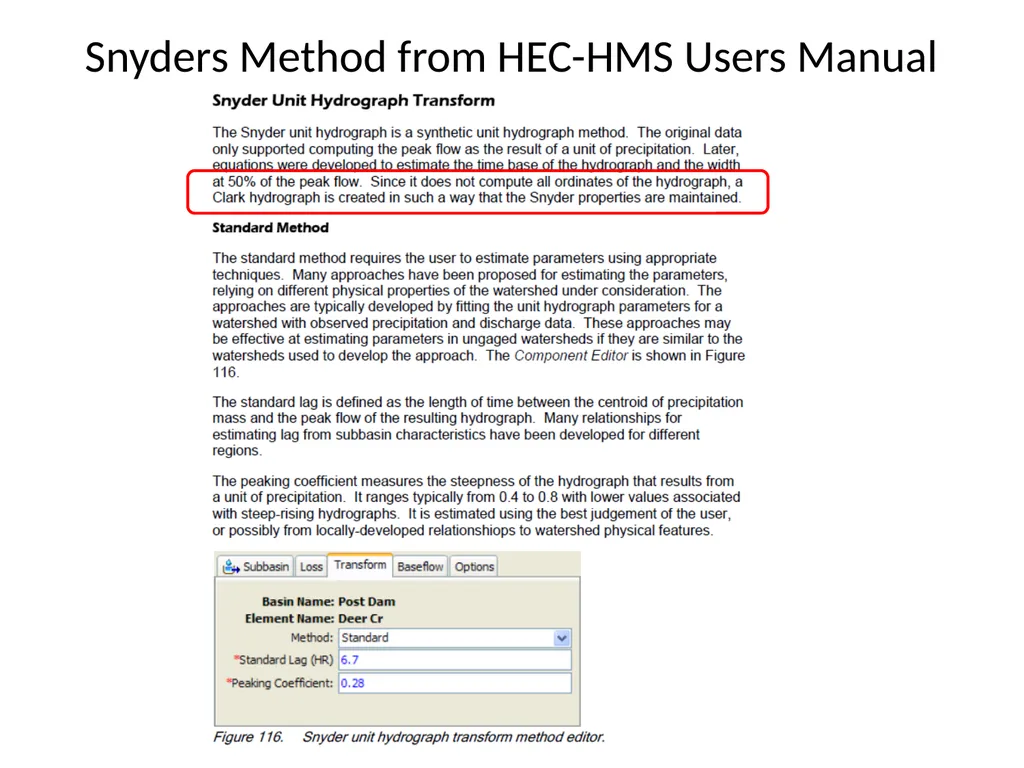
Snyders Method from HEC-HMS Users Manual<br>