
Constructing BEA Highways and Streets Net Wealth






Description: Constructing BEA Highways and Streets Net Wealth Stocks with Detailed Types of Investment and Engineering-based Estimates of Depreciation Authors: Barbara M. Fraumeni, Central University of Finance and Economics, Beijing, China National
Related Topics
Download Presentation
"Constructing BEA Highways and Streets Net Wealth" is the property of its rightful owner. Permission is granted to download and print the materials on this website for personal, non-commercial use only, and to display it on your personal computer provided you do not modify the materials and that you retain all copyright notices contained in the materials. By downloading content from our website, you accept the terms of this agreement.
Presentation Transcript
slide1. Constructing BEA Highways and Streets Net Wealth Stocks with Detailed Types of Investment and Engineering-based Estimates of Depreciation Authors: Barbara M. Fraumeni, Central University of Finance and Economics, Beijing, China & National Bureau of Economic Research
Robert Kornfeld, U.S. Bureau of Economic Analysis
Discussant: Eve Smith, Assistant Deputy Director, Non-Financial Assets, ONS<br>
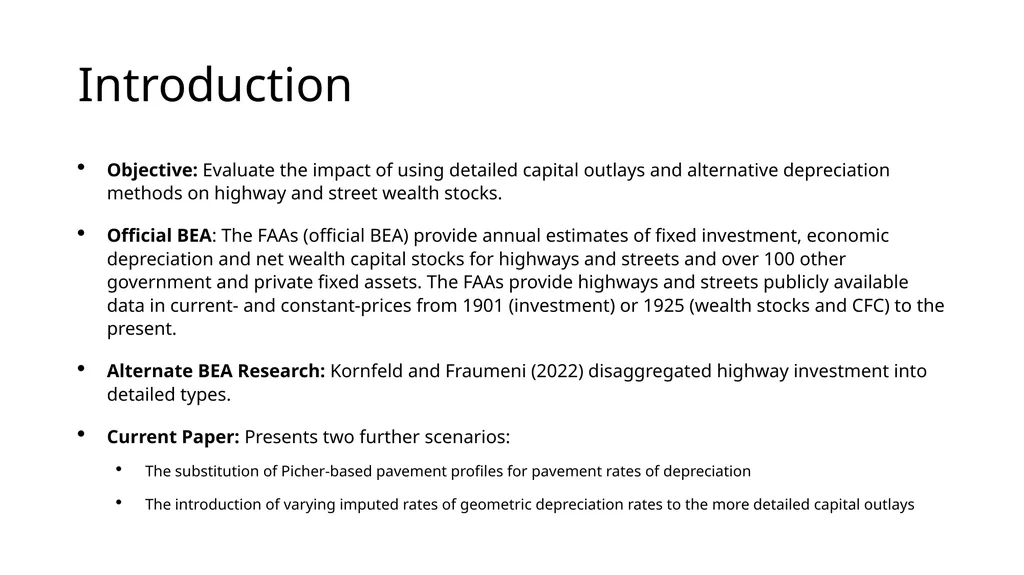
slide2. Introduction Objective: Evaluate the impact of using detailed capital outlays and alternative depreciation methods on highway and street wealth stocks.
Official BEA: The FAAs (official BEA) provide annual estimates of fixed investment, economic depreciation and net wealth capital stocks for highways and streets and over 100 other government and private fixed assets. The FAAs provide highways and streets publicly available data in current- and constant-prices from 1901 (investment) or 1925 (wealth stocks and CFC) to the present.
Alternate BEA Research: Kornfeld and Fraumeni (2022) disaggregated highway investment into detailed types.
Current Paper: Presents two further scenarios:
The substitution of Picher-based pavement profiles for pavement rates of depreciation
The introduction of varying imputed rates of geometric depreciation rates to the more detailed capital outlays<br>
slide3. Official BEA and Alternative BEA Sources and Methodologies Official BEA Sources:
Annual estimates of fixed investment, economic depreciation, and net wealth capital stocks.
Publicly available data from 1901 (investment) or 1925 (wealth stocks and CFC).
Methodology:
Use of the Perpetual Inventory Method (PIM)
Same constant-price estimates of investment in all calculations
Assume a Geometric Pattern occurs<br>
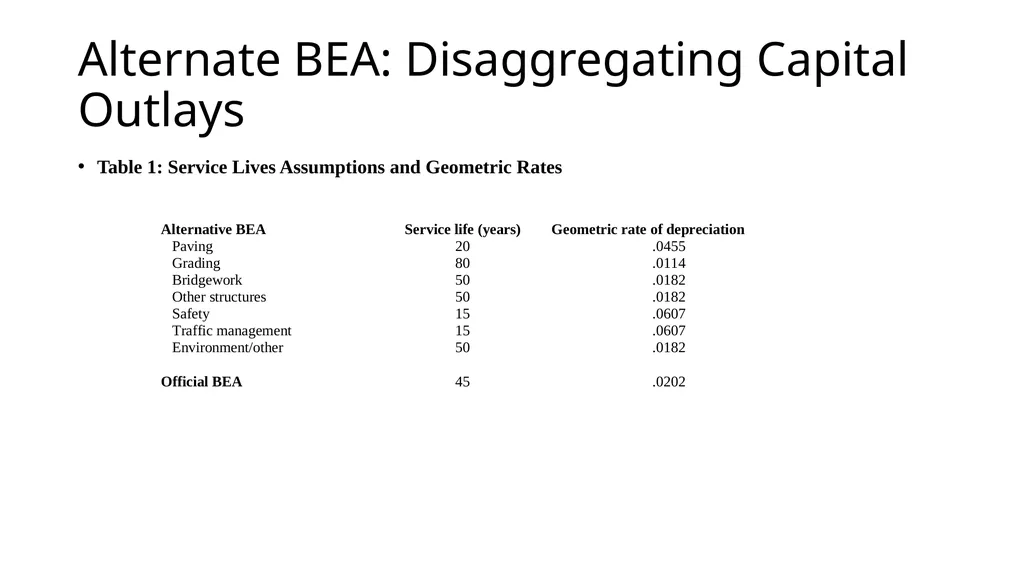
slide4. Alternate BEA: Disaggregating Capital Outlays Table 1: Service Lives Assumptions and Geometric Rates<br>
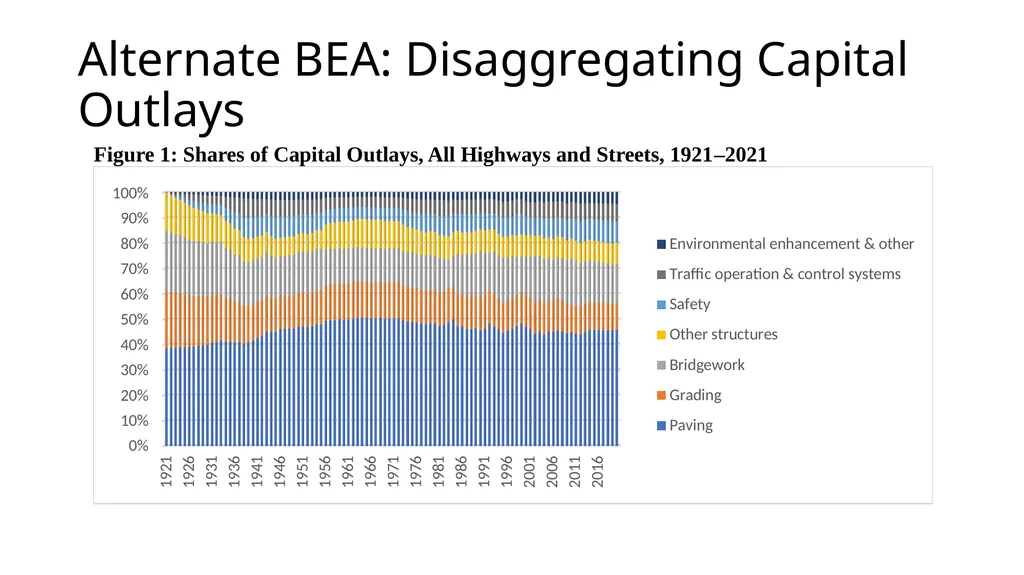
slide5. Alternate BEA: Disaggregating Capital Outlays<br>
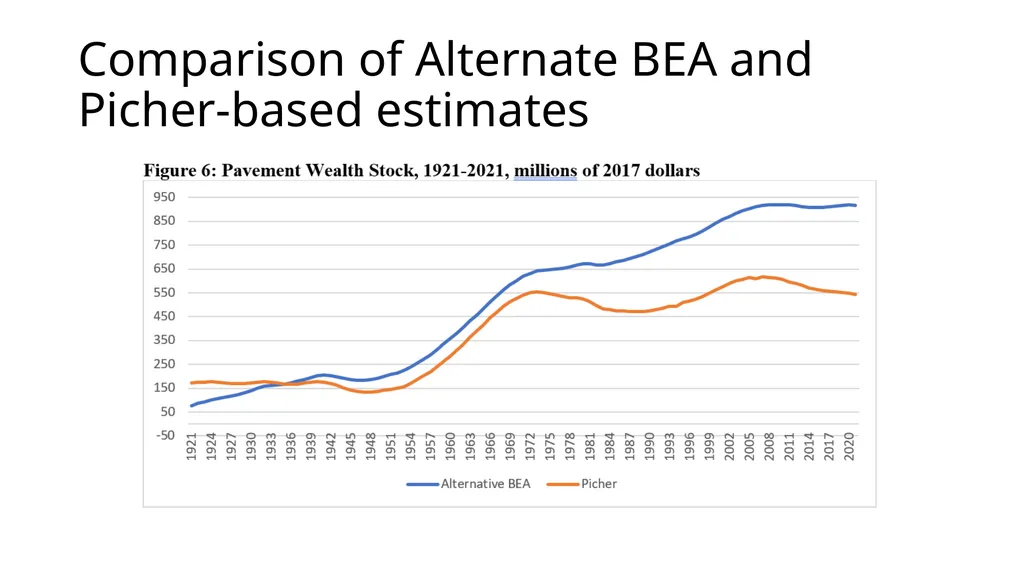
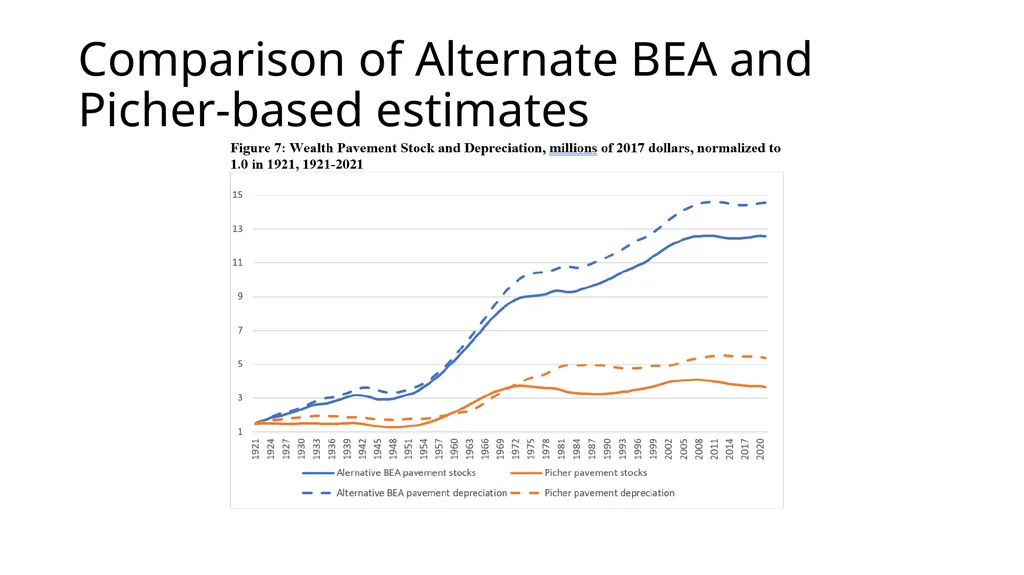
slide6. New Scenario: Picher-based paving sources and methodology Picher estimated efficiency profiles for pavement with an assumed lifetime of 20 years, as contrasted with an infinite lifetime with a geometric rate of depreciation.
Picher-based productive stock estimates were converted to wealth stock estimates to allow a comparison to the official BEA and alternative BEA wealth stocks.
Productive stocks depend on the efficiency of an asset only in the current period, whereas wealth stocks depend on the efficiency of an asset in the current and all future periods. (Lightbulb example)
Productive stocks are always greater than wealth stocks if the annual efficiency levels are the same, except in the special case of a geometric rate.<br>
slide7. Comparison of Alternate BEA and Picher-based estimates<br>
slide8. Comparison of Alternate BEA and Picher-based estimates<br>
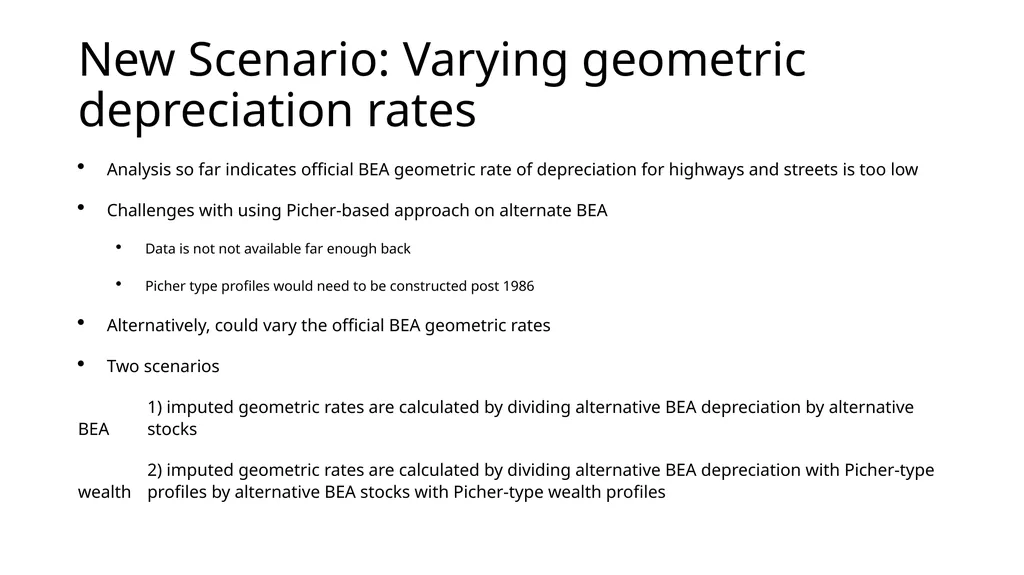
slide9. New Scenario: Varying geometric depreciation rates Analysis so far indicates official BEA geometric rate of depreciation for highways and streets is too low
Challenges with using Picher-based approach on alternate BEA
Data is not not available far enough back
Picher type profiles would need to be constructed post 1986
Alternatively, could vary the official BEA geometric rates
Two scenarios
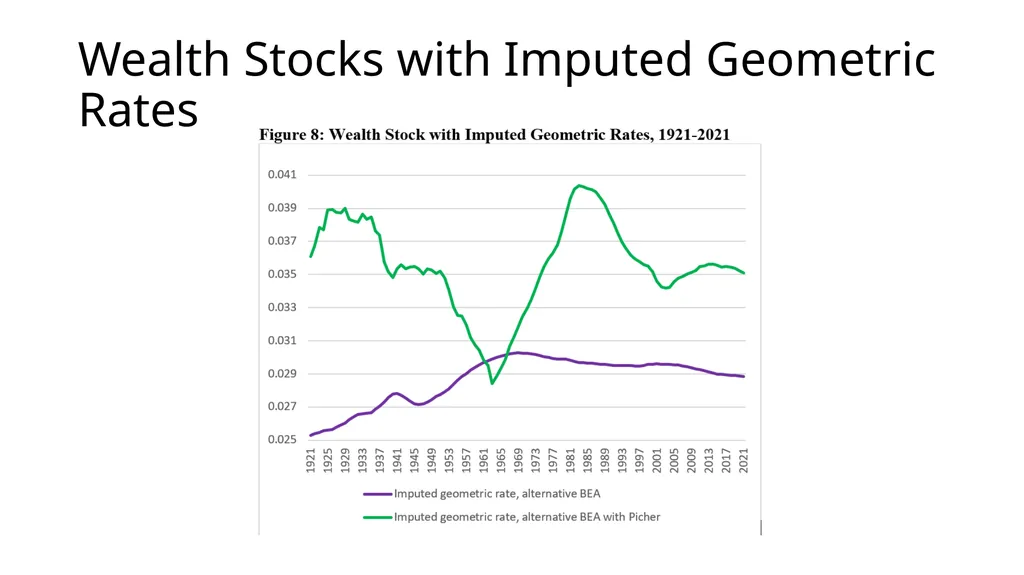
1) imputed geometric rates are calculated by dividing alternative BEA depreciation by alternative BEA stocks
2) imputed geometric rates are calculated by dividing alternative BEA depreciation with Picher-type wealth profiles by alternative BEA stocks with Picher-type wealth profiles<br>
slide10. Wealth Stocks with Imputed Geometric Rates<br>
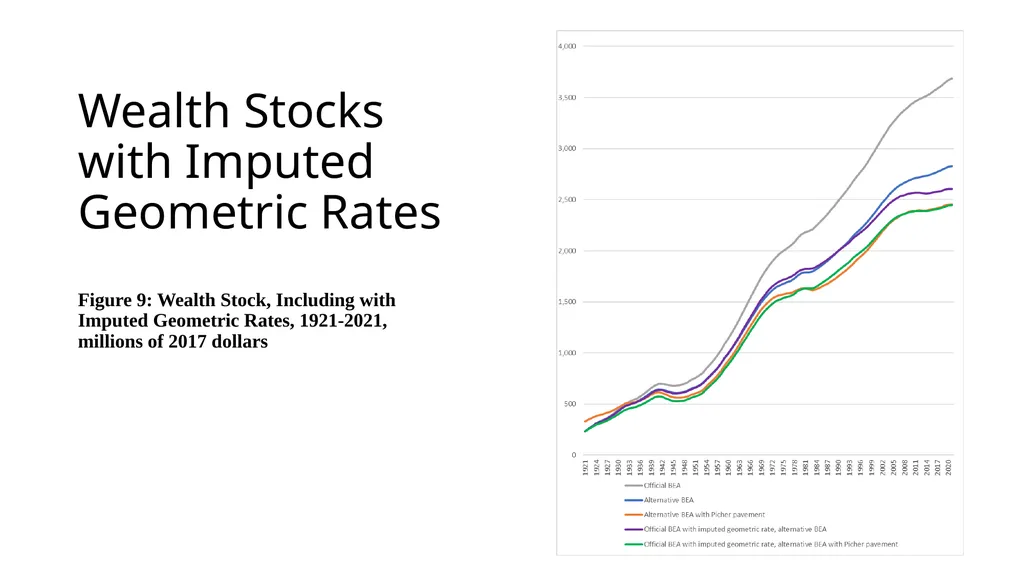
slide11. Wealth Stocks with Imputed Geometric Rates Figure 9: Wealth Stock, Including with Imputed Geometric Rates, 1921-2021, millions of 2017 dollars<br>
slide12. Conclusion Introducing a more detailed level of disaggregation of highways and streets BEA investment suggests that the official BEA geometric depreciation rate is too low. Whether or not the Picher-based estimates become the basis for pavement depreciation, a more disaggregated level of investment significantly reduces the level of wealth stocks.
The authors ask whether geometric rates in the alternative scenario for the disaggregated components are the correct rates and which of the imputed geometric rates scenarios would be an appropriate basis for geometric rates.<br>
slide13. Discussion<br>
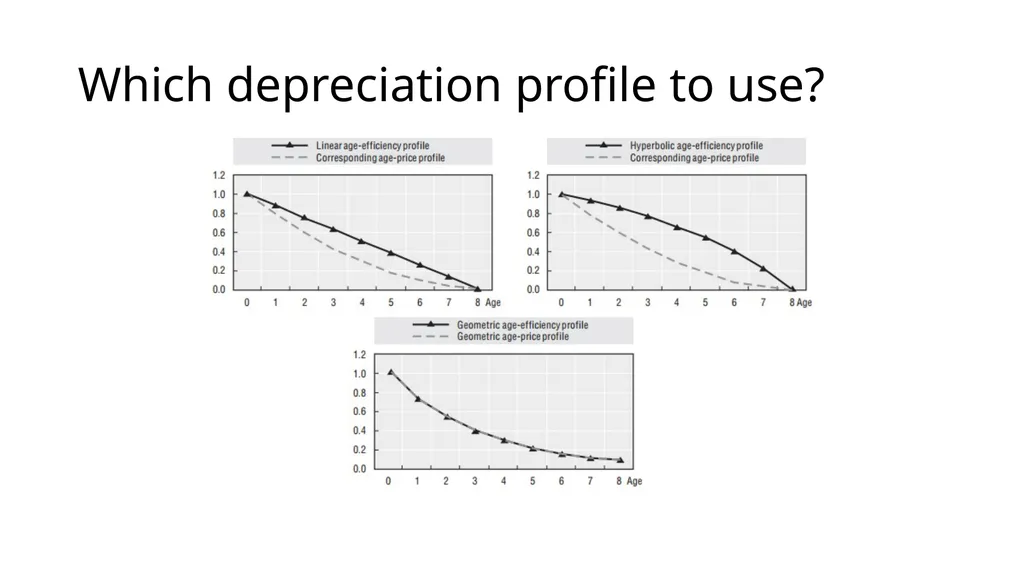
slide14. Which depreciation profile to use?<br>
slide15. Discussion Points In the world of National Accounts maintaining comparability with international guidance is important and how we translate the guidance.
How sensitive is the PIM to parameter changes and how frequently should we be reviewing our assumptions including depreciation methods and the evidence on which we make those assumptions? This is covered in the 2022 paper, particularly when talking about incomplete data.
Does the assets discussed in the paper have the appropriate profile as we can see how sensitive the PIM is to using a different profile. Does the profile reflect the economic reality of the asset?
Transparency of our parameters and reasons for updating
Other considerations is the disaggregation of assets to better inform asset lives estimates. Aggregation and risk of error (processing errors and time). How far do we go and what evidence are low level assumptions based on (low sample size)?
Not specific to the paper, there is a broader question of how do we determine the most appropriate parameters for capital stocks each asset, not just depreciation profiles. Therefore, the evidence and choice of assumptions is key<br>
Robert Kornfeld, U.S. Bureau of Economic Analysis
Discussant: Eve Smith, Assistant Deputy Director, Non-Financial Assets, ONS<br>
slide2. Introduction Objective: Evaluate the impact of using detailed capital outlays and alternative depreciation methods on highway and street wealth stocks.
Official BEA: The FAAs (official BEA) provide annual estimates of fixed investment, economic depreciation and net wealth capital stocks for highways and streets and over 100 other government and private fixed assets. The FAAs provide highways and streets publicly available data in current- and constant-prices from 1901 (investment) or 1925 (wealth stocks and CFC) to the present.
Alternate BEA Research: Kornfeld and Fraumeni (2022) disaggregated highway investment into detailed types.
Current Paper: Presents two further scenarios:
The substitution of Picher-based pavement profiles for pavement rates of depreciation
The introduction of varying imputed rates of geometric depreciation rates to the more detailed capital outlays<br>
slide3. Official BEA and Alternative BEA Sources and Methodologies Official BEA Sources:
Annual estimates of fixed investment, economic depreciation, and net wealth capital stocks.
Publicly available data from 1901 (investment) or 1925 (wealth stocks and CFC).
Methodology:
Use of the Perpetual Inventory Method (PIM)
Same constant-price estimates of investment in all calculations
Assume a Geometric Pattern occurs<br>
slide4. Alternate BEA: Disaggregating Capital Outlays Table 1: Service Lives Assumptions and Geometric Rates<br>
slide5. Alternate BEA: Disaggregating Capital Outlays<br>
slide6. New Scenario: Picher-based paving sources and methodology Picher estimated efficiency profiles for pavement with an assumed lifetime of 20 years, as contrasted with an infinite lifetime with a geometric rate of depreciation.
Picher-based productive stock estimates were converted to wealth stock estimates to allow a comparison to the official BEA and alternative BEA wealth stocks.
Productive stocks depend on the efficiency of an asset only in the current period, whereas wealth stocks depend on the efficiency of an asset in the current and all future periods. (Lightbulb example)
Productive stocks are always greater than wealth stocks if the annual efficiency levels are the same, except in the special case of a geometric rate.<br>
slide7. Comparison of Alternate BEA and Picher-based estimates<br>
slide8. Comparison of Alternate BEA and Picher-based estimates<br>
slide9. New Scenario: Varying geometric depreciation rates Analysis so far indicates official BEA geometric rate of depreciation for highways and streets is too low
Challenges with using Picher-based approach on alternate BEA
Data is not not available far enough back
Picher type profiles would need to be constructed post 1986
Alternatively, could vary the official BEA geometric rates
Two scenarios
1) imputed geometric rates are calculated by dividing alternative BEA depreciation by alternative BEA stocks
2) imputed geometric rates are calculated by dividing alternative BEA depreciation with Picher-type wealth profiles by alternative BEA stocks with Picher-type wealth profiles<br>
slide10. Wealth Stocks with Imputed Geometric Rates<br>
slide11. Wealth Stocks with Imputed Geometric Rates Figure 9: Wealth Stock, Including with Imputed Geometric Rates, 1921-2021, millions of 2017 dollars<br>
slide12. Conclusion Introducing a more detailed level of disaggregation of highways and streets BEA investment suggests that the official BEA geometric depreciation rate is too low. Whether or not the Picher-based estimates become the basis for pavement depreciation, a more disaggregated level of investment significantly reduces the level of wealth stocks.
The authors ask whether geometric rates in the alternative scenario for the disaggregated components are the correct rates and which of the imputed geometric rates scenarios would be an appropriate basis for geometric rates.<br>
slide13. Discussion<br>
slide14. Which depreciation profile to use?<br>
slide15. Discussion Points In the world of National Accounts maintaining comparability with international guidance is important and how we translate the guidance.
How sensitive is the PIM to parameter changes and how frequently should we be reviewing our assumptions including depreciation methods and the evidence on which we make those assumptions? This is covered in the 2022 paper, particularly when talking about incomplete data.
Does the assets discussed in the paper have the appropriate profile as we can see how sensitive the PIM is to using a different profile. Does the profile reflect the economic reality of the asset?
Transparency of our parameters and reasons for updating
Other considerations is the disaggregation of assets to better inform asset lives estimates. Aggregation and risk of error (processing errors and time). How far do we go and what evidence are low level assumptions based on (low sample size)?
Not specific to the paper, there is a broader question of how do we determine the most appropriate parameters for capital stocks each asset, not just depreciation profiles. Therefore, the evidence and choice of assumptions is key<br>