
Continuing Model Maintenance Maintaining Model
Description: Continuing Model Maintenance Maintaining Model Operation and Efficiency Changes in economic conditions Changing state economy Changes in state population Changing administrative priorities regarding the targeted population Changes in job
Related Topics
Download Presentation
"Continuing Model Maintenance Maintaining Model" is the property of its rightful owner. Permission is granted to download and print the materials on this website for personal, non-commercial use only, and to display it on your personal computer provided you do not modify the materials and that you retain all copyright notices contained in the materials. By downloading content from our website, you accept the terms of this agreement.
Presentation Transcript
slide1. Continuing Model Maintenance Maintaining Model Operation and Efficiency<br>
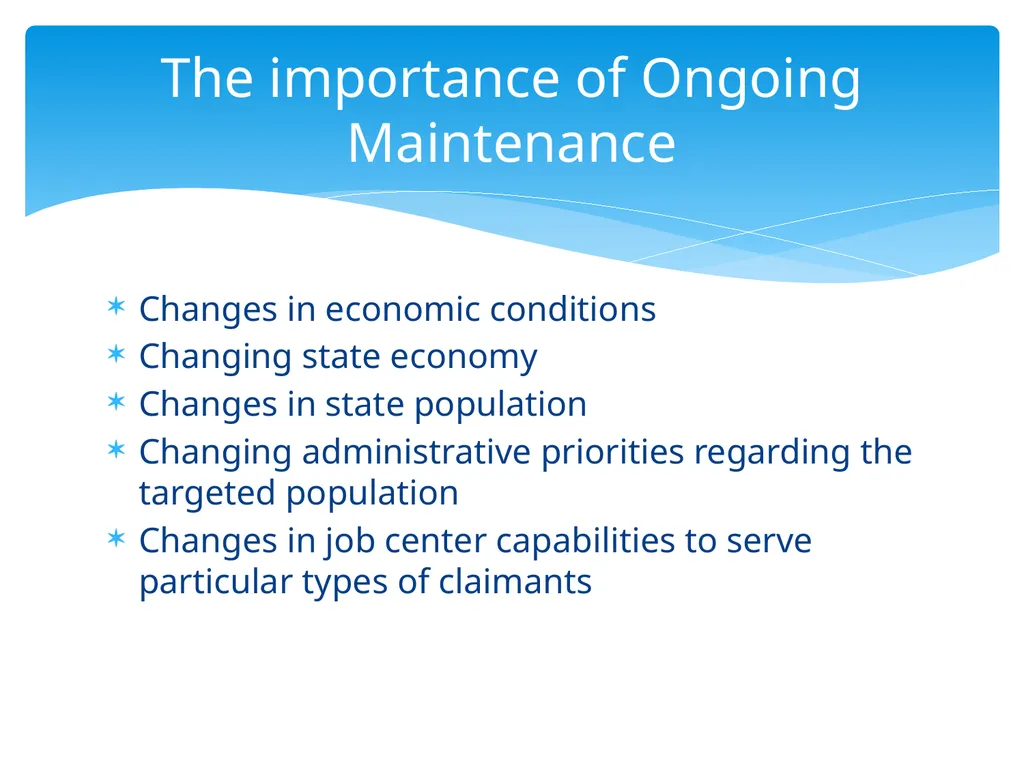
slide2. Changes in economic conditions
Changing state economy
Changes in state population
Changing administrative priorities regarding the targeted population
Changes in job center capabilities to serve particular types of claimants The importance of Ongoing Maintenance<br>
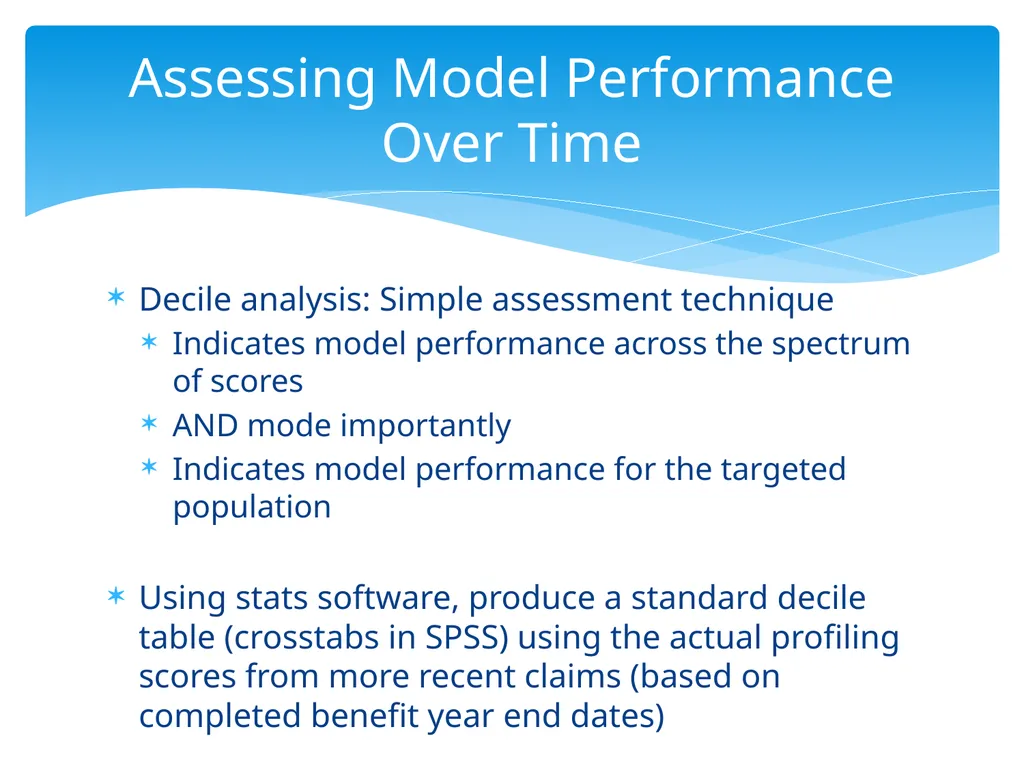
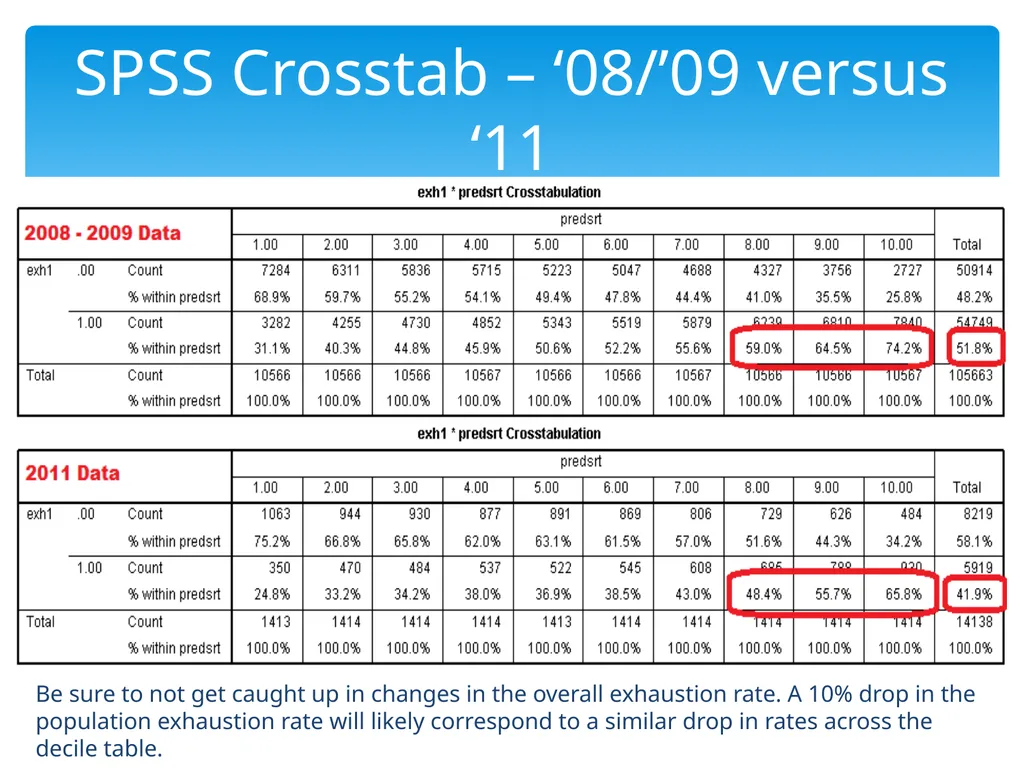
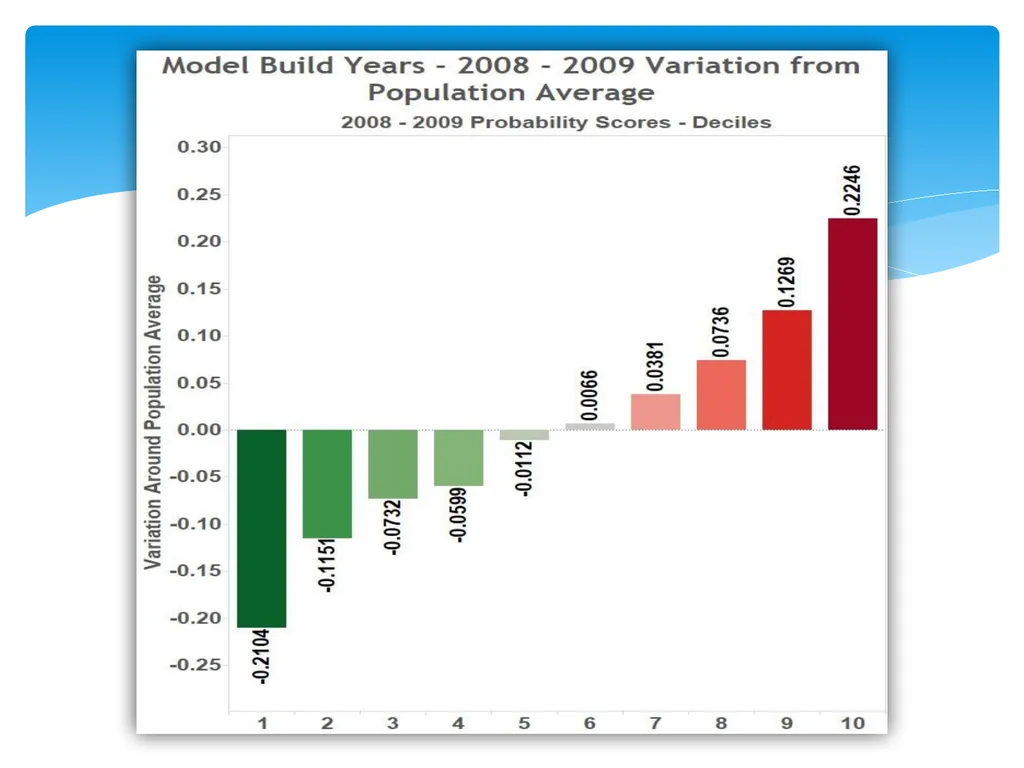
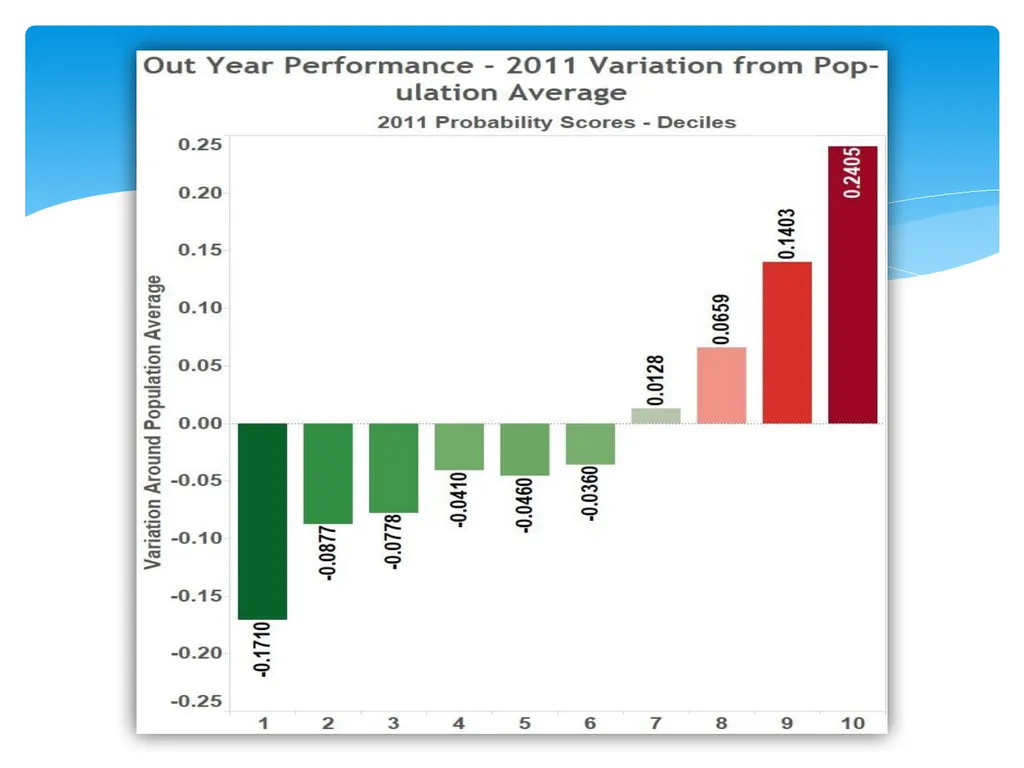
slide3. Decile analysis: Simple assessment technique
Indicates model performance across the spectrum of scores
AND mode importantly
Indicates model performance for the targeted population
Using stats software, produce a standard decile table (crosstabs in SPSS) using the actual profiling scores from more recent claims (based on completed benefit year end dates) Assessing Model Performance Over Time<br>
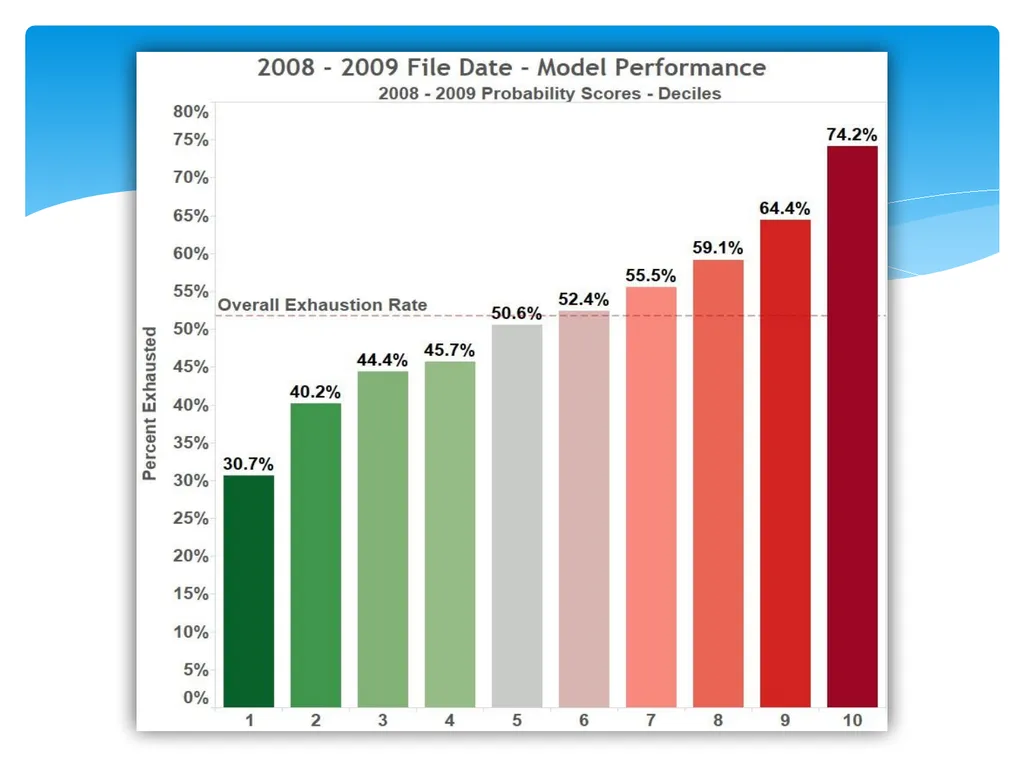
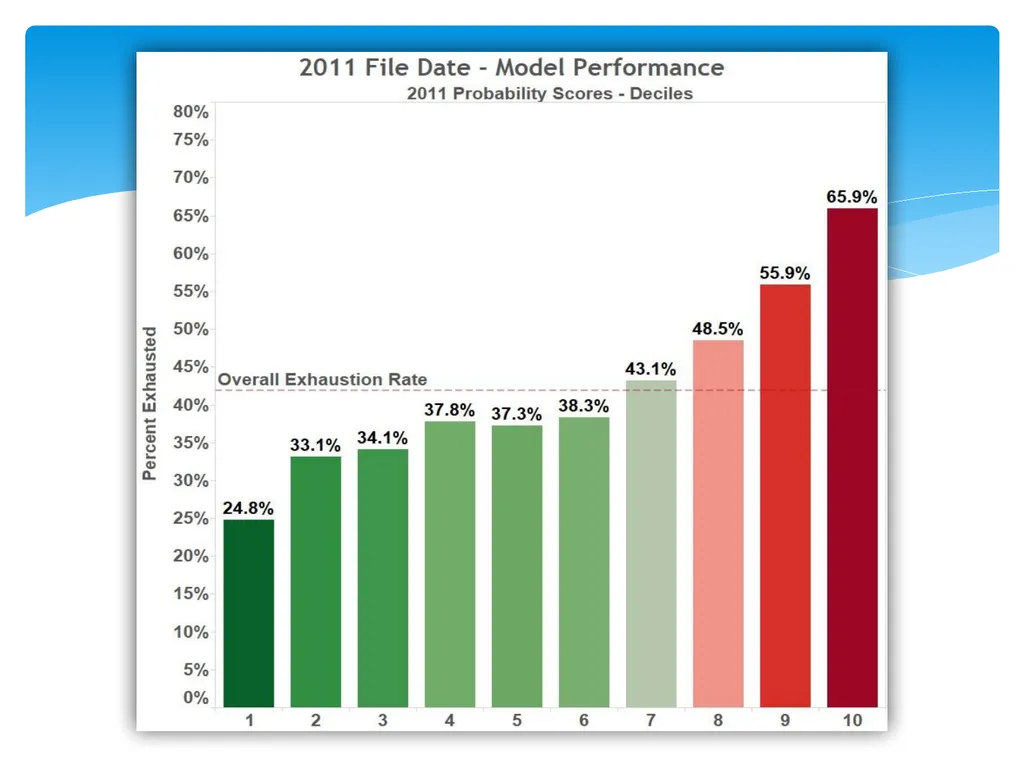
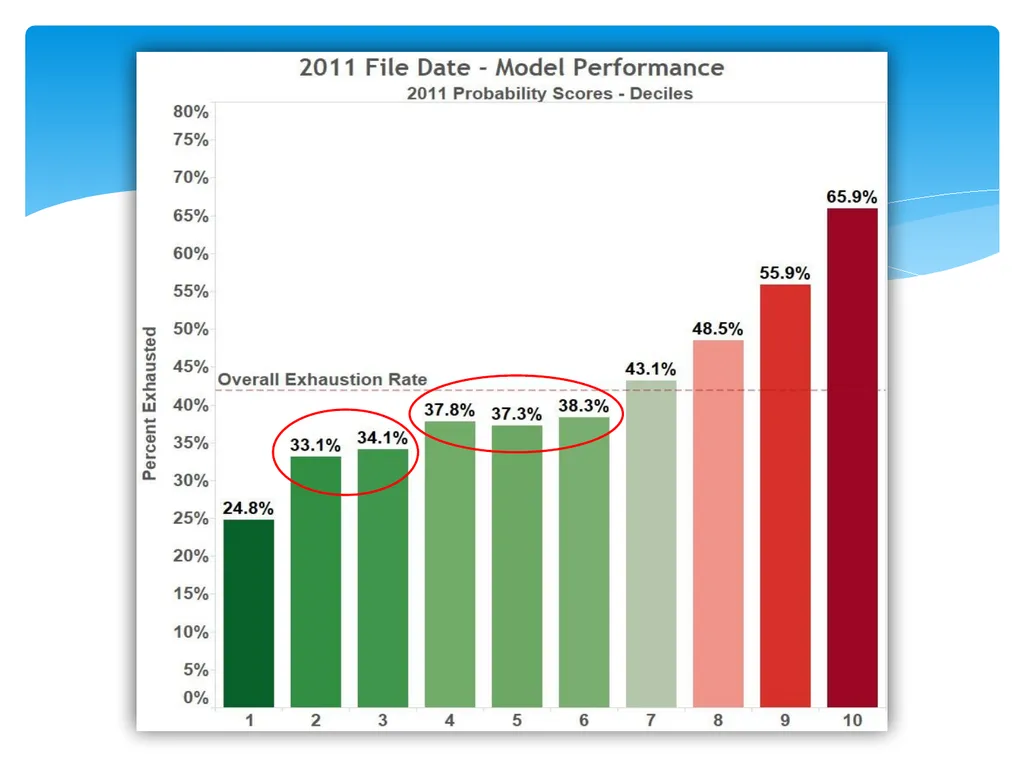
slide4. SPSS Crosstab – ‘08/’09 versus ‘11 Be sure to not get caught up in changes in the overall exhaustion rate. A 10% drop in the population exhaustion rate will likely correspond to a similar drop in rates across the decile table.<br>
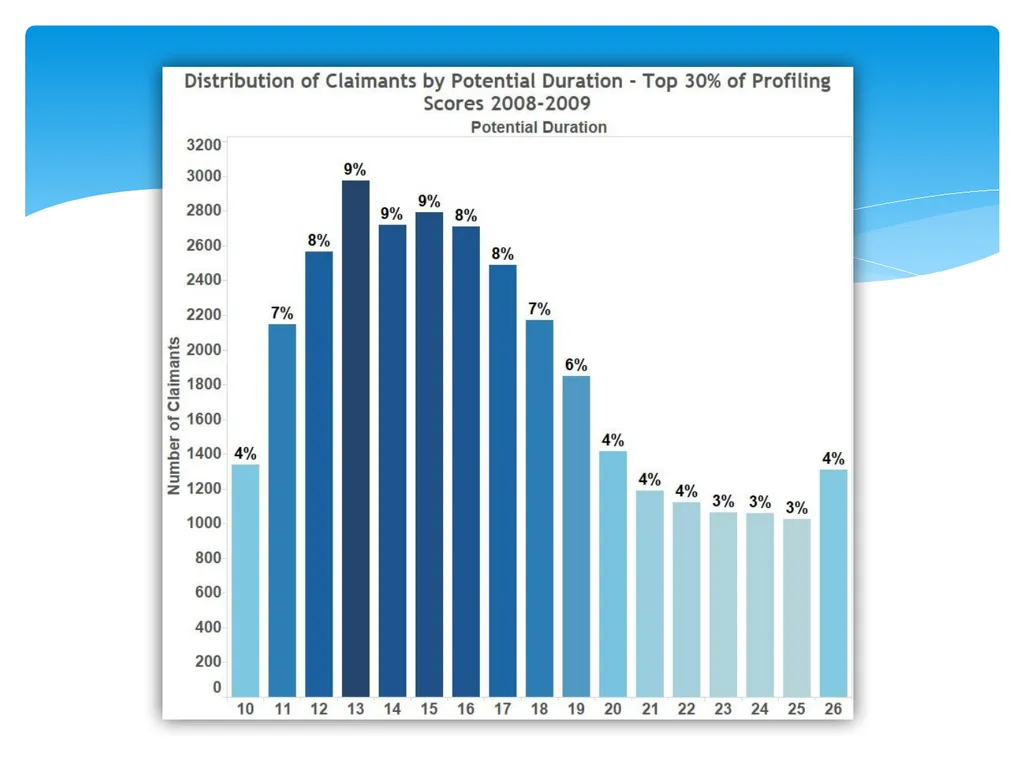
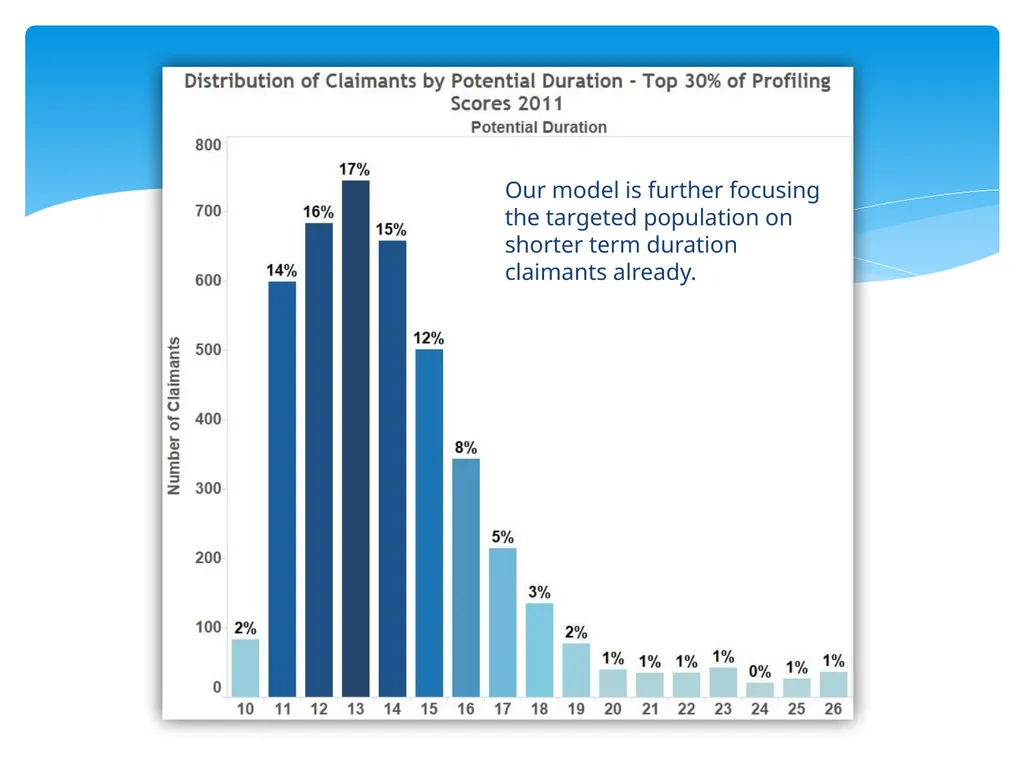
slide11. Our model is further focusing the targeted population on shorter term duration claimants already.<br>
slide12. Model is built using completed benefit year data
1/1/2008 to 12/31/2009 filing dates in UT model example correspond to data that would be pulled no earlier than 1/1/2011
Model performance can deteriorate quickly, hence the 2 to 4 year coefficient update recommendations
Particularly true during changing economic periods Things to Keep in Mind<br>
slide13. Feedback Loops
Ongoing process of communication and follow up to review program outcomes
Communication with Front Line Staff
Feedback from referred claimants
Claims data analysis
Descriptive tables to analyze characteristics and claim experience of referred claimants
Analysis of 9048 and 9049 reports
Be sure to use this feedback when building new models! Assessing Model Performance Over Time<br>
slide14. Recommended:
Develop a standard and scheduled evaluation process Evaluation Process<br>
slide15. Every 1 to 3 years
Re-estimate coefficients
Using more recent data, update model coefficients
Generally a relatively quick and simple update
data collection and clean up is most time consuming part
Every 3 to 6 years
Investigate need to overhaul model
Prior model variables may still hold, but improvements may still be available
More involved update: requires more time and effort
Timing Can vary depending on economic fluctuations over the time period. Recommendations for Model Updates<br>
slide16. Recommended: Make model updates part of the standard, scheduled process.
For example:
Regularly scheduled model updates
Every 3 years:
Coefficient review and update if necessary
Every 6 years:
Model review and update including
Model rebuild if a better model can be developed
Coefficient re-estimation if a better model not available
Most important benefit of a defined Model Update Process:
Buy-in: Programmer time, for data pull & model implementation Process for Model Upkeep<br>
slide17. Re-estimating Model Parameters Model Updating Process<br>
slide18. Duplicate original model (same variables) using more recent data
Run a logistic regression using the same variable specifications on a more recent set of data
Include a binary variable (1/0) to identify claimants referred to services
Can help assess program impacts & control for impacts of services on claimants’ probabilities of exhausting
Compare coefficients from the two models
If there are significant differences, use the new model, otherwise old model can be retained
Alternatively, you could estimate separate models for selected vs. not selected claimants & compare predicted probabilities Re-estimating Model Parameters (Coefficients)<br>
slide19. Particularly if coefficients are significantly different, be sure to evaluate re-estimated model performance
Use Decile table analysis, Hosmer-Lemeshow, Sensitivity and Specificity and ROC Curve analysis as necessary
Ensure current variable specifications are still appropriate
If evaluation of new model indicates poor performance consider building a new model from scratch Re-estimation of Parameters<br>
slide20. When Model Performance
OR
Upkeep Schedule Dictates Model Rebuild<br>
slide21. Collect data and develop a new model following the seminar steps and guidance
Use the prior model’s variable specifications as a starting point
OR
Start from scratch and ignore old model to avoid any bias in the development of the new model Model Rebuild<br>
slide22. Lookup tables for regression coefficients
Simplifies implementation of re-estimated coefficients
Automated evaluation & model update processes
Data management and improvement
Training and/or “buy in” from front line staff Final suggestions<br>
slide2. Changes in economic conditions
Changing state economy
Changes in state population
Changing administrative priorities regarding the targeted population
Changes in job center capabilities to serve particular types of claimants The importance of Ongoing Maintenance<br>
slide3. Decile analysis: Simple assessment technique
Indicates model performance across the spectrum of scores
AND mode importantly
Indicates model performance for the targeted population
Using stats software, produce a standard decile table (crosstabs in SPSS) using the actual profiling scores from more recent claims (based on completed benefit year end dates) Assessing Model Performance Over Time<br>
slide4. SPSS Crosstab – ‘08/’09 versus ‘11 Be sure to not get caught up in changes in the overall exhaustion rate. A 10% drop in the population exhaustion rate will likely correspond to a similar drop in rates across the decile table.<br>
slide11. Our model is further focusing the targeted population on shorter term duration claimants already.<br>
slide12. Model is built using completed benefit year data
1/1/2008 to 12/31/2009 filing dates in UT model example correspond to data that would be pulled no earlier than 1/1/2011
Model performance can deteriorate quickly, hence the 2 to 4 year coefficient update recommendations
Particularly true during changing economic periods Things to Keep in Mind<br>
slide13. Feedback Loops
Ongoing process of communication and follow up to review program outcomes
Communication with Front Line Staff
Feedback from referred claimants
Claims data analysis
Descriptive tables to analyze characteristics and claim experience of referred claimants
Analysis of 9048 and 9049 reports
Be sure to use this feedback when building new models! Assessing Model Performance Over Time<br>
slide14. Recommended:
Develop a standard and scheduled evaluation process Evaluation Process<br>
slide15. Every 1 to 3 years
Re-estimate coefficients
Using more recent data, update model coefficients
Generally a relatively quick and simple update
data collection and clean up is most time consuming part
Every 3 to 6 years
Investigate need to overhaul model
Prior model variables may still hold, but improvements may still be available
More involved update: requires more time and effort
Timing Can vary depending on economic fluctuations over the time period. Recommendations for Model Updates<br>
slide16. Recommended: Make model updates part of the standard, scheduled process.
For example:
Regularly scheduled model updates
Every 3 years:
Coefficient review and update if necessary
Every 6 years:
Model review and update including
Model rebuild if a better model can be developed
Coefficient re-estimation if a better model not available
Most important benefit of a defined Model Update Process:
Buy-in: Programmer time, for data pull & model implementation Process for Model Upkeep<br>
slide17. Re-estimating Model Parameters Model Updating Process<br>
slide18. Duplicate original model (same variables) using more recent data
Run a logistic regression using the same variable specifications on a more recent set of data
Include a binary variable (1/0) to identify claimants referred to services
Can help assess program impacts & control for impacts of services on claimants’ probabilities of exhausting
Compare coefficients from the two models
If there are significant differences, use the new model, otherwise old model can be retained
Alternatively, you could estimate separate models for selected vs. not selected claimants & compare predicted probabilities Re-estimating Model Parameters (Coefficients)<br>
slide19. Particularly if coefficients are significantly different, be sure to evaluate re-estimated model performance
Use Decile table analysis, Hosmer-Lemeshow, Sensitivity and Specificity and ROC Curve analysis as necessary
Ensure current variable specifications are still appropriate
If evaluation of new model indicates poor performance consider building a new model from scratch Re-estimation of Parameters<br>
slide20. When Model Performance
OR
Upkeep Schedule Dictates Model Rebuild<br>
slide21. Collect data and develop a new model following the seminar steps and guidance
Use the prior model’s variable specifications as a starting point
OR
Start from scratch and ignore old model to avoid any bias in the development of the new model Model Rebuild<br>
slide22. Lookup tables for regression coefficients
Simplifies implementation of re-estimated coefficients
Automated evaluation & model update processes
Data management and improvement
Training and/or “buy in” from front line staff Final suggestions<br>