Core Methods in Educational Data Mining EDUC6191
Description: Core Methods in Educational Data Mining EDUC6191 Fall 2024 Questions about Basic HW 1? Reminders: basic assignments You dont have to do it perfectly, you just have to do it You will NOT be penalized for using hints (appropriately) If you
Related Topics
Download Presentation
"Core Methods in Educational Data Mining EDUC6191" is the property of its rightful owner. Permission is granted to download and print the materials on this website for personal, non-commercial use only, and to display it on your personal computer provided you do not modify the materials and that you retain all copyright notices contained in the materials. By downloading content from our website, you accept the terms of this agreement.
Presentation Transcript
slide1. Core Methods in Educational Data Mining EDUC6191Fall 2024<br>
slide2. Questions about Basic HW 1?<br>
slide3. Reminders: basic assignments You don’t have to do it perfectly, you just have to do it
You will NOT be penalized for using hints (appropriately)
If you run into trouble, post to the discussion forum<br>
slide4. Note: basic assignments If it tells you to show your work, put in a couple characters there
We do not expect you to show your work
This is a glitch and we’re trying to fix it – thanks for your understanding<br>
slide5. Reminder: class time In some semesters, the video textbook is a little out of date
In those semesters, we use class time to lecture
But this semester, the video textbook is reasonably up to date
So we will use class time to discuss, answer questions, etc.<br>
slide6. What this means Bring questions<br>
slide7. Exercise on your own Do not raise your hand or tell me the answer
Who watched all the assigned videos?<br>
slide8. Exercise on your own Do not raise your hand or tell me the answer
Who watched all the assigned videos?
If you didn’t do this, you missed the key content for the week!
Even more important than coming to class<br>
slide9. Let’s get warmed up<br>
slide10. What is big data?<br>
slide11. Some definitions “Big data” is data big enough that traditional statistical significance testing becomes useless
“Big data” is data too big to input into a traditional relational database
“Big data” is data too big to work with on a single machine<br>
slide12. A moving target 2004: I reported a data set with 31,450 data points. People were impressed.
2014: A reviewer in an education journal criticized me for referring to 817,485 data points as “big data”.<br>
slide13. Not just big but open is important More and more educational data sets can be accessed by the public
The EDM Society even runs an annual best open data set competition (see previous winners)
Very different than how things used to be<br>
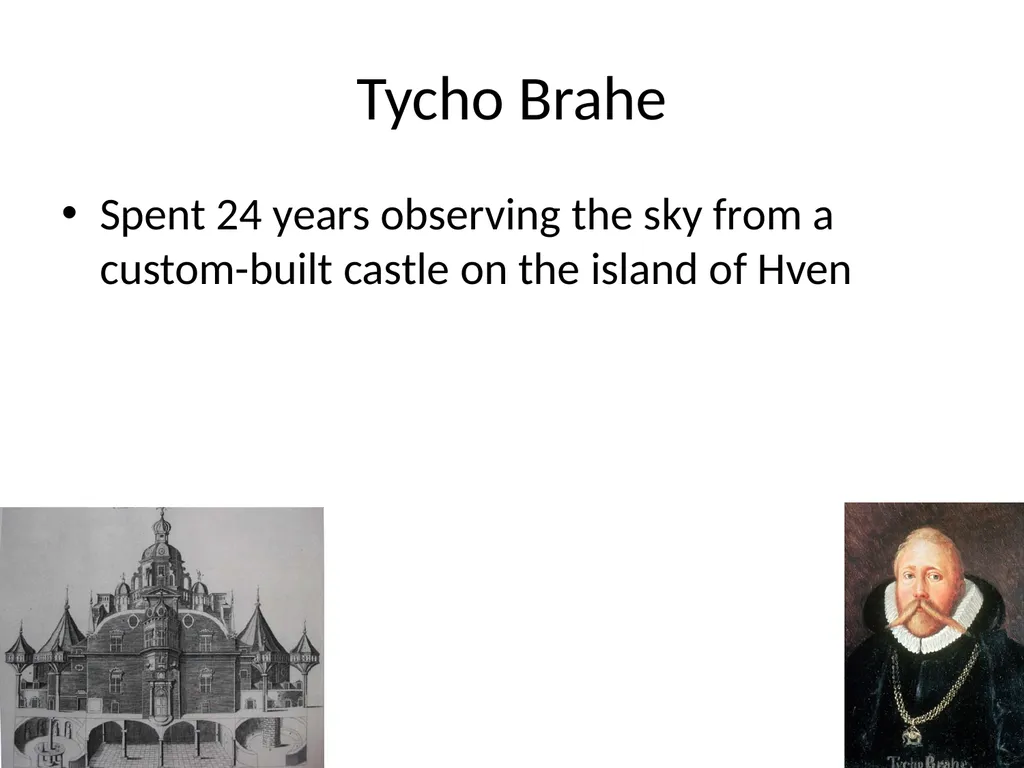
slide14. Tycho Brahe Spent 24 years observing the sky from a custom-built castle on the island of Hven<br>
slide15. Johannes Kepler Had to take a job with Brahe to get Brahe’s data<br>
slide16. Johannes Kepler Had to take a job with Brahe to get Brahe’s data
Only got unrestricted access to data…<br>
slide17. Johannes Kepler Had to take a job with Brahe to get Brahe’s data
Only got unrestricted access to data… when Brahe died<br>
slide18. Johannes Kepler Had to take a job with Brahe to get Brahe’s data
Only got unrestricted access to data… when Brahe died
and Kepler stole the data andfled to Germany<br>
slide19. What are the types of EDM method?<br>
slide20. What are the types of EDM method? According to Baker (any version)
Top-level first<br>
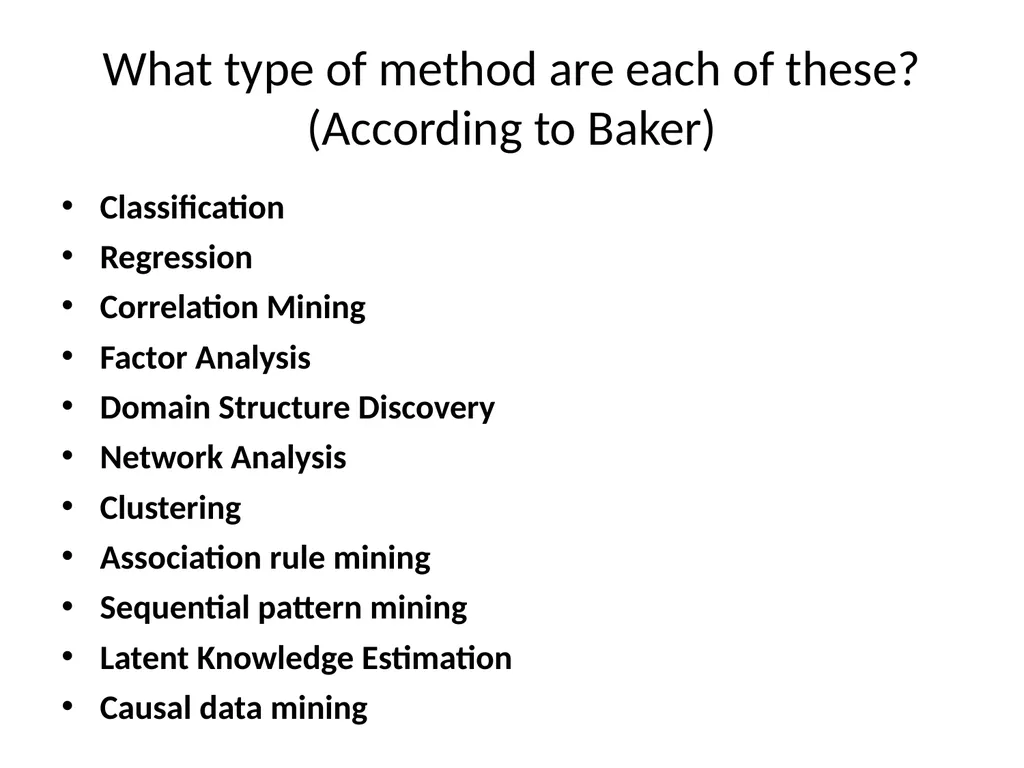
slide21. What type of method are each of these?(According to Baker) Classification
Regression
Correlation Mining
Factor Analysis
Domain Structure Discovery
Network Analysis
Clustering
Association rule mining
Sequential pattern mining
Latent Knowledge Estimation
Causal data mining<br>
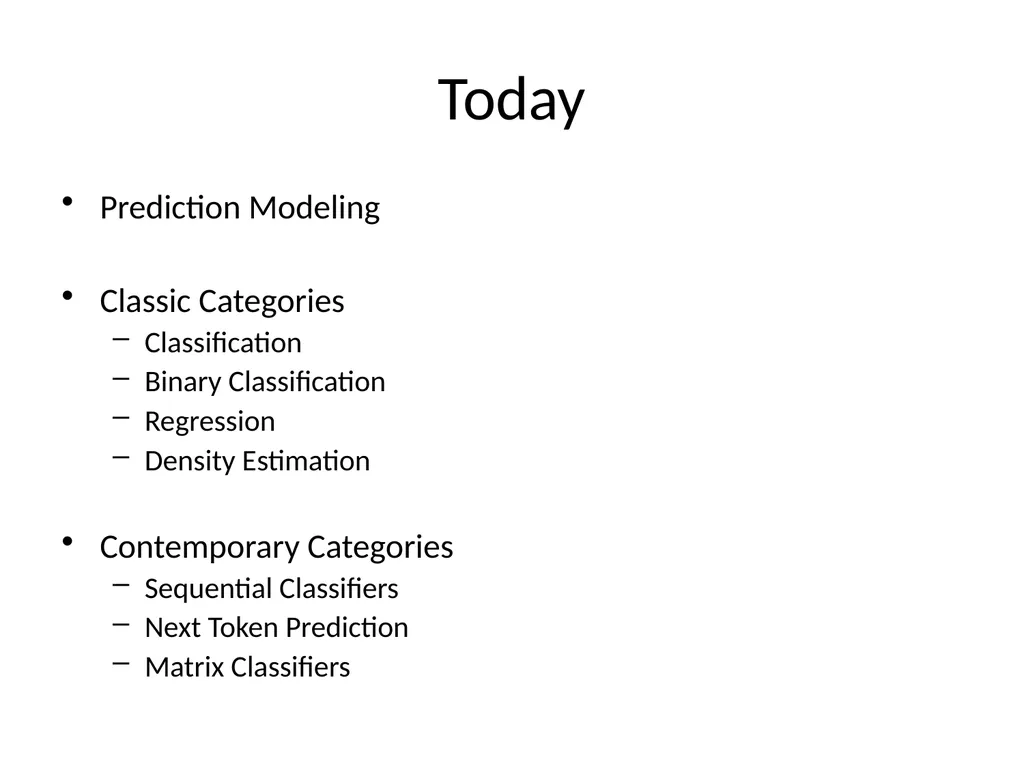
slide22. Today Prediction Modeling
Classic Categories
Classification
Binary Classification
Regression
Density Estimation
Contemporary Categories
Sequential Classifiers
Next Token Prediction
Matrix Classifiers<br>
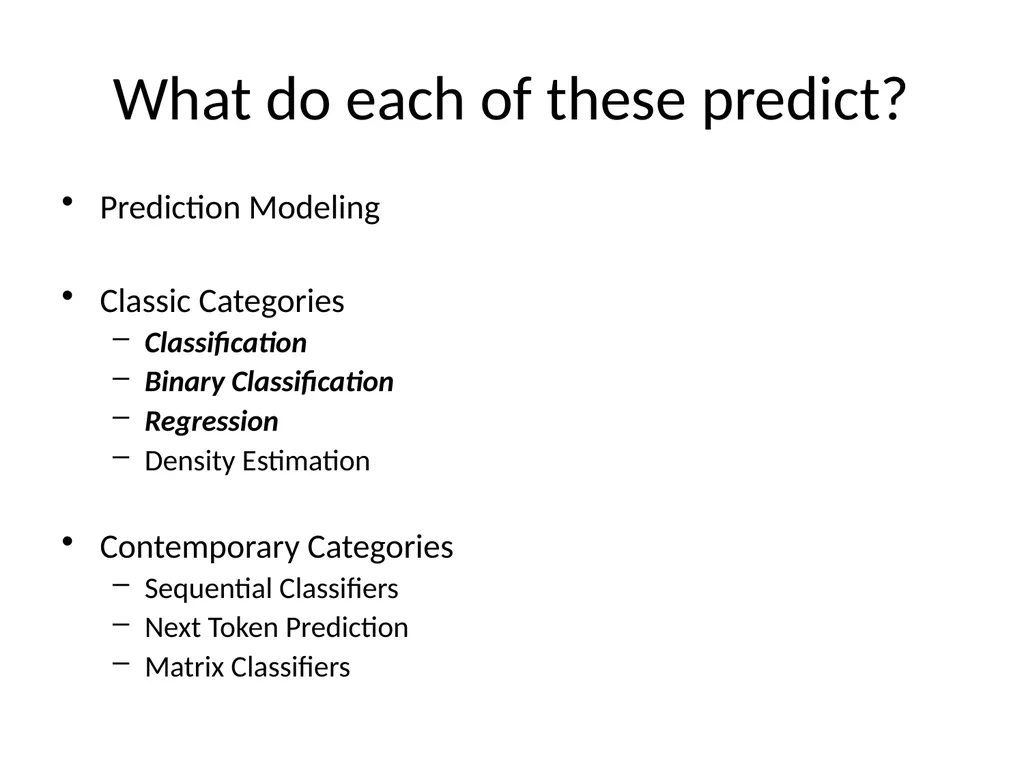
slide23. What do each of these predict? Prediction Modeling
Classic Categories
Classification
Binary Classification
Regression
Density Estimation
Contemporary Categories
Sequential Classifiers
Next Token Prediction
Matrix Classifiers<br>
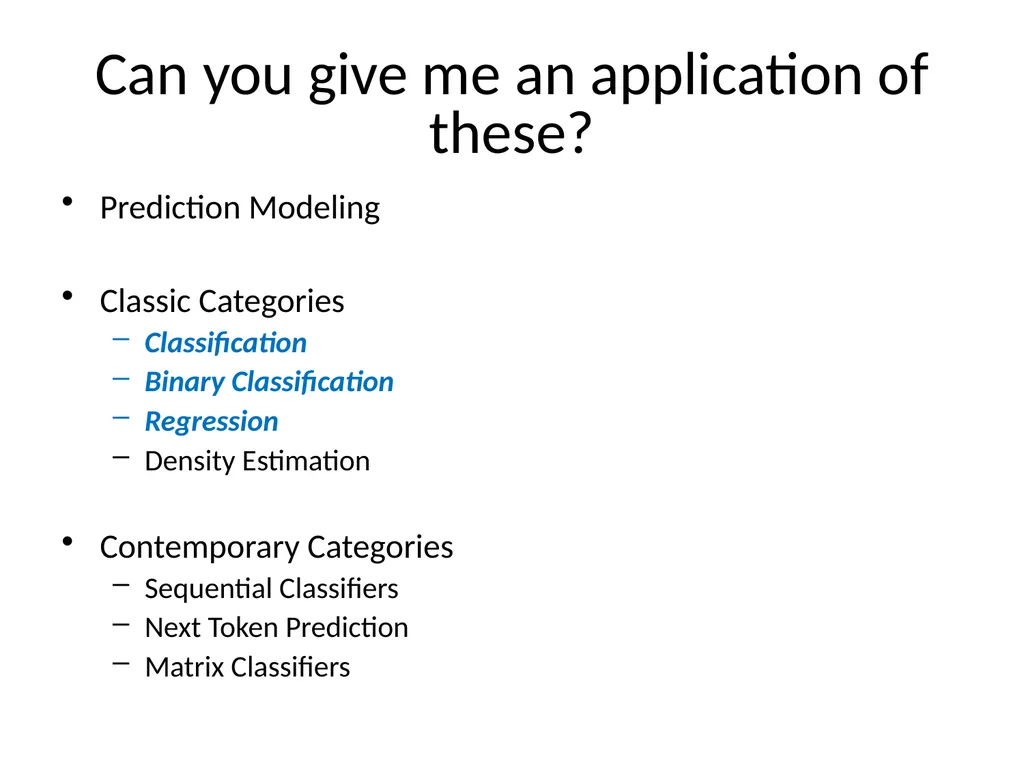
slide24. Can you give me an application of these? Prediction Modeling
Classic Categories
Classification
Binary Classification
Regression
Density Estimation
Contemporary Categories
Sequential Classifiers
Next Token Prediction
Matrix Classifiers<br>
slide25. Density Estimator Predicts a probability density function
Not used much in education
Used more in other domains<br>
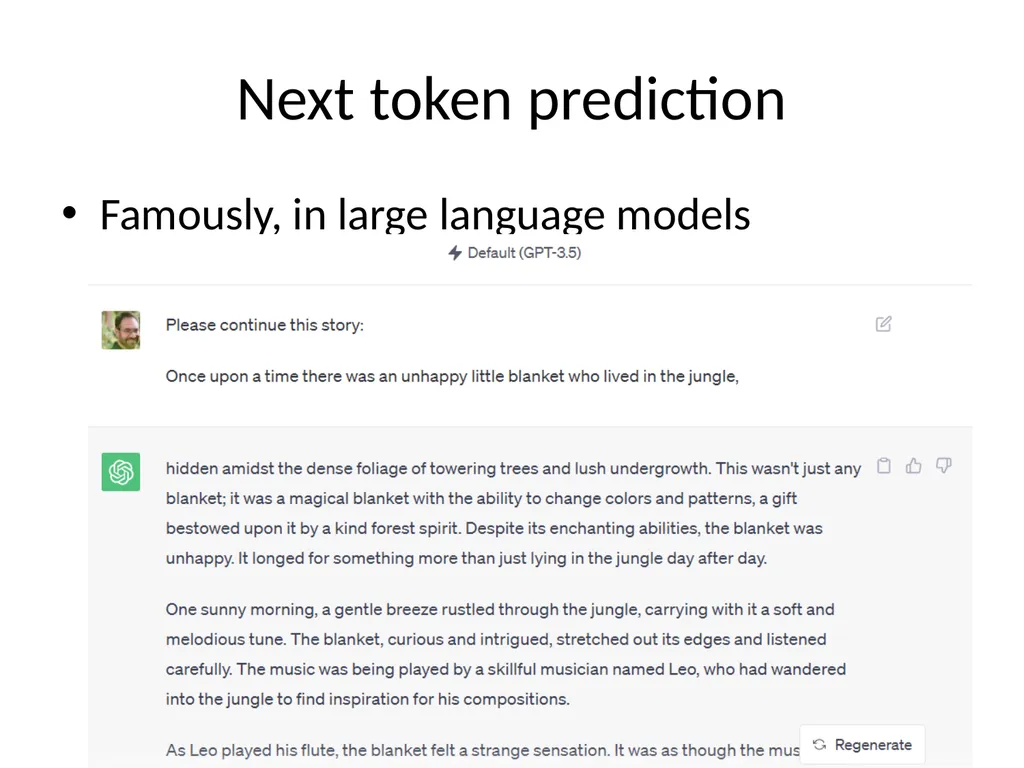
slide26. Next token prediction Famously, in large language models<br>
slide27. Matrix prediction Predicting a 2x2 or multi-dimensional matrix from
Part of the matrix
A sentence<br>
slide28. Can you give me any examples of this? Predicting a 2x2 or multi-dimensional matrix from
Part of the matrix
A sentence<br>
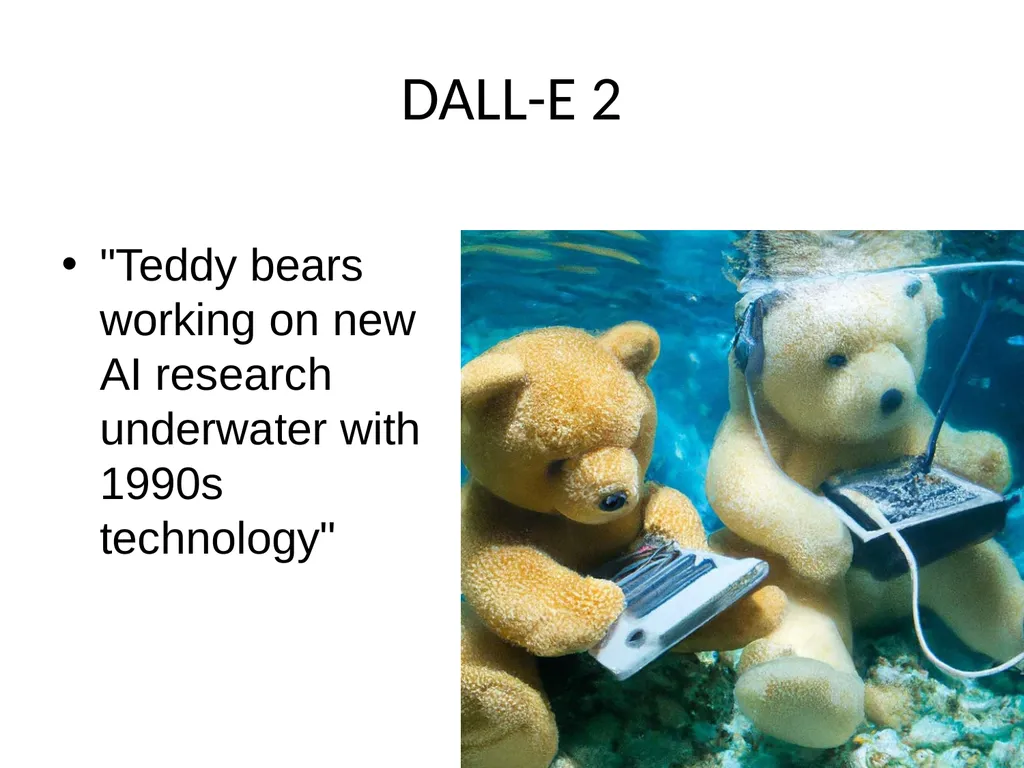
slide29. DALL-E 2 "Teddy bears working on new AI research underwater with 1990s technology"<br>
slide30. Transformer/Foundation Models Who here can tell us what a transformer model/foundation model is?<br>
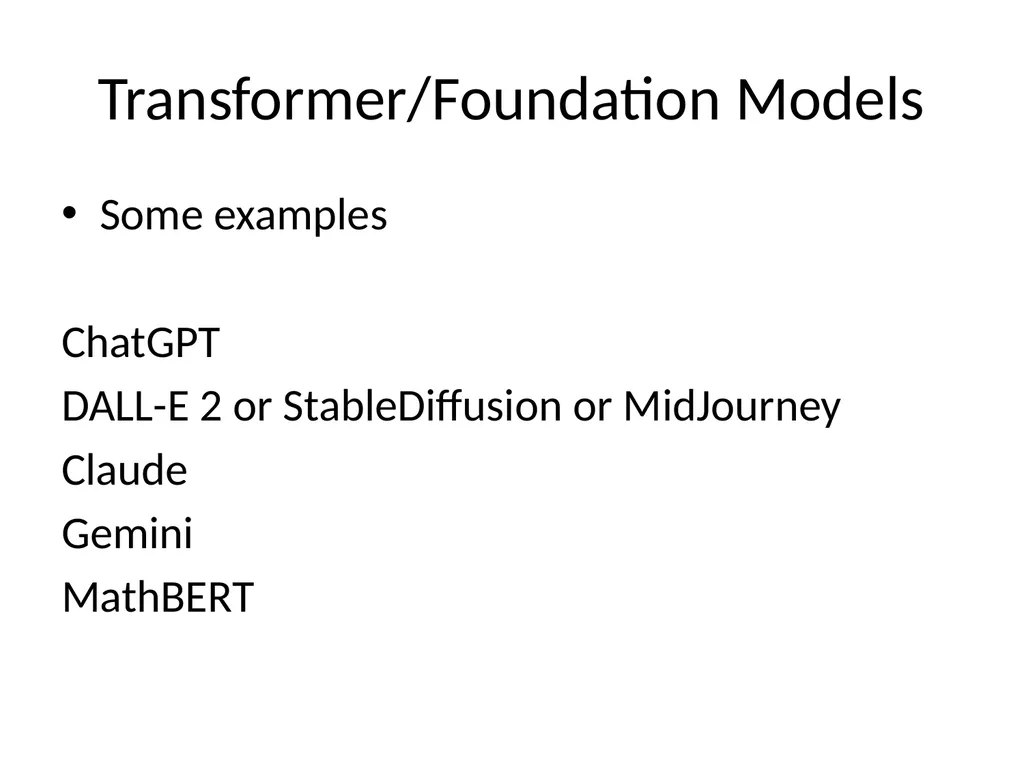
slide31. Transformer/Foundation Models Some examples
ChatGPT
DALL-E 2 or StableDiffusion or MidJourney
Claude
Gemini
MathBERT<br>
slide32. Raise Your HandsWho has used each of these? ChatGPT
DALL-E 2 or StableDiffusion or MidJourney
Claude
Gemini
MathBERT<br>
slide33. Questions? Comments?<br>
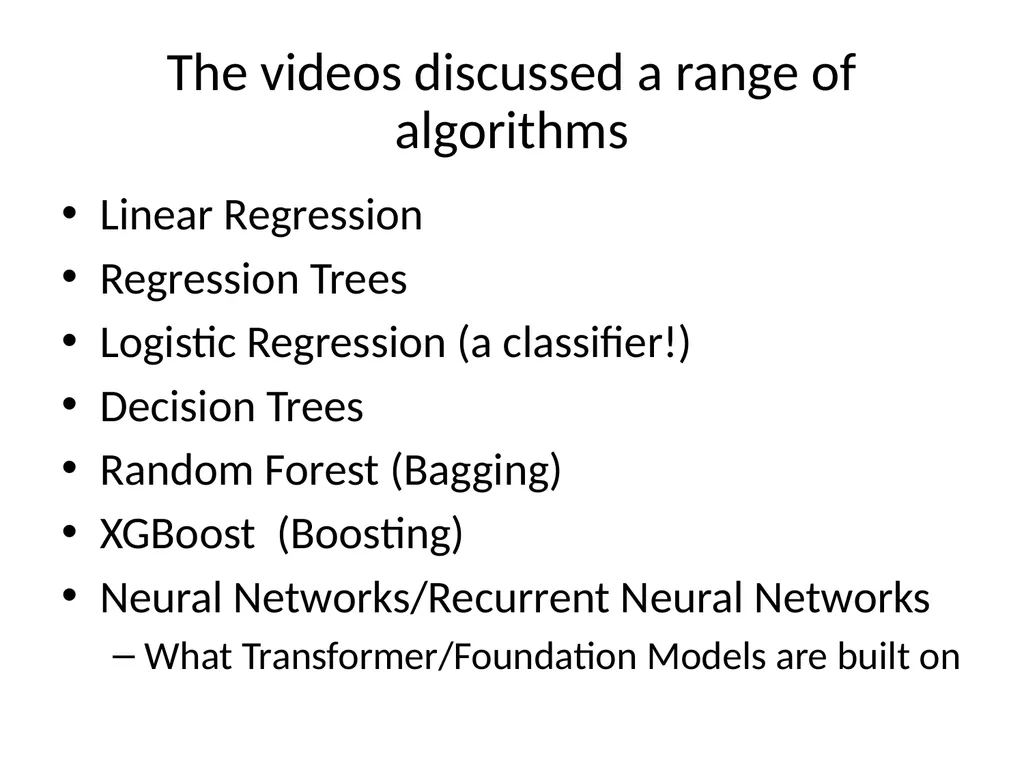
slide34. The videos discussed a range of algorithms Linear Regression
Regression Trees
Logistic Regression (a classifier!)
Decision Trees
Random Forest (Bagging)
XGBoost (Boosting)
Neural Networks/Recurrent Neural Networks
What Transformer/Foundation Models are built on<br>
slide35. Questions or comments about any of these?<br>
slide36. Has anyone Used any classification algorithms outside the set discussed/recommended in the videos?
Say more?<br>
slide37. A practical question<br>
slide38. Should you Pick one algorithm that seems really appropriate?
Run every algorithm that will actually run for your data?
Something in between?<br>
slide39. Our typical lab practice Pick a small number of algorithms that
Have worked on past similar problems
Fit different kinds of patterns from each other<br>
slide40. Is it really the algorithm? Or is it the data you put into it?
We’ll come back to this in the Feature Engineering lecture<br>
slide41. Interpreting Regression Models Let’s quickly review the example from the video<br>
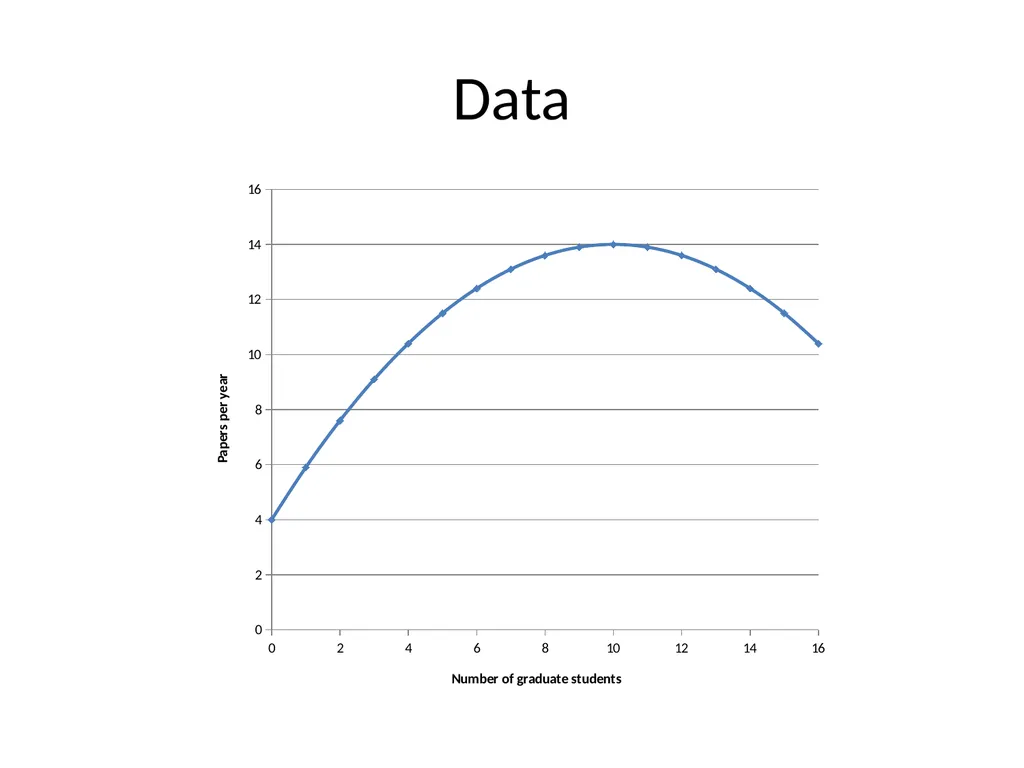
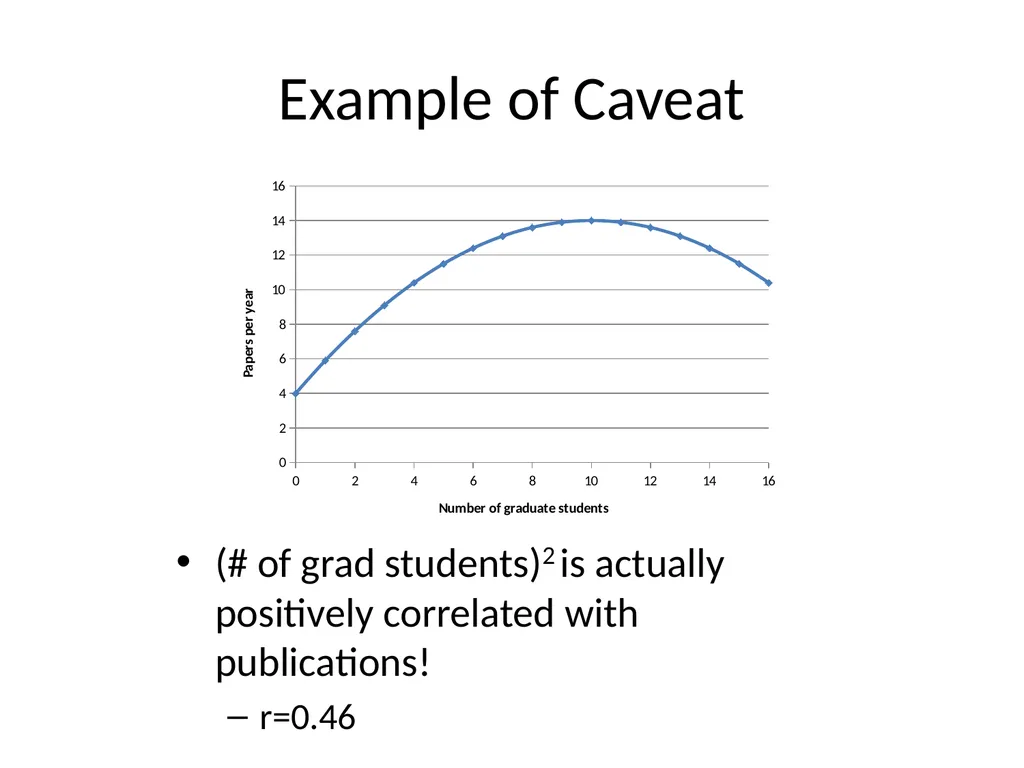
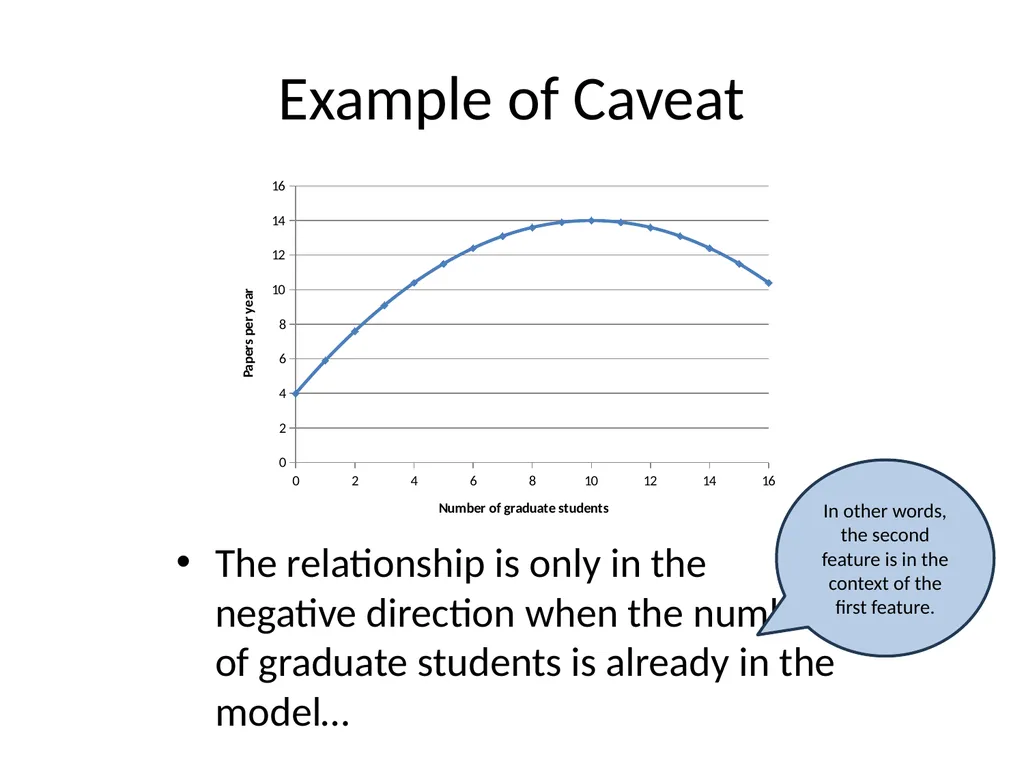
slide42. Example of Caveat Let’s graph the relationship between number of graduate students and number of papers per year<br>
slide43. Data<br>
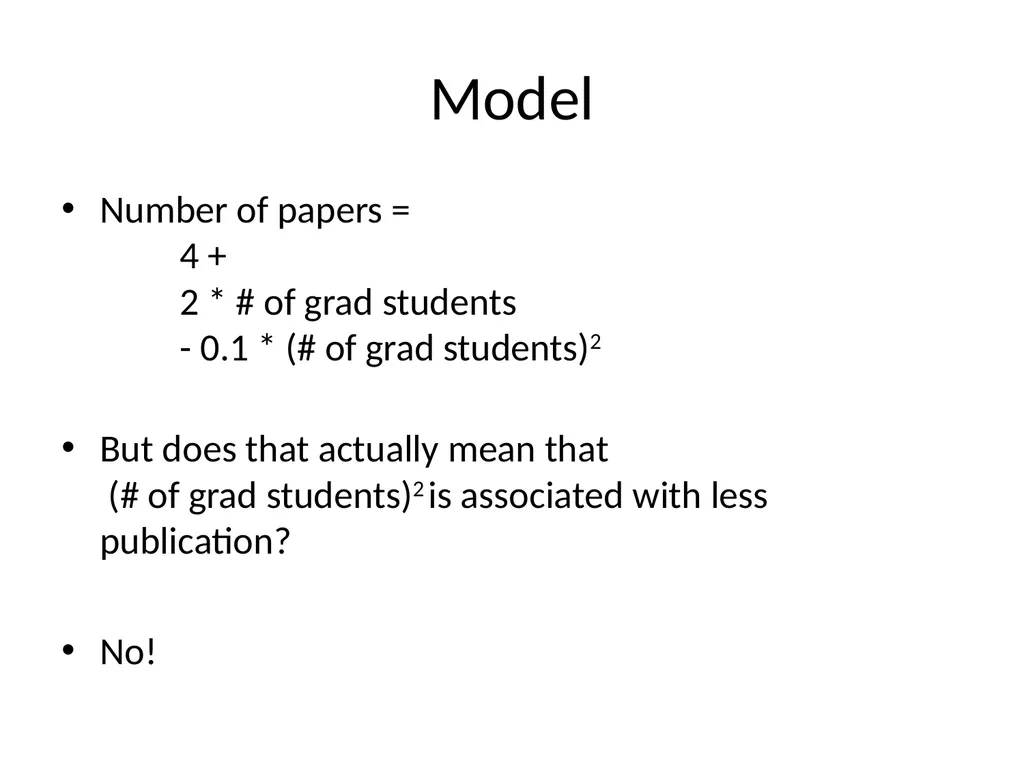
slide44. Model Number of papers = 4 + 2 * # of grad students - 0.1 * (# of grad students)2
But does that actually mean that (# of grad students)2 is associated with less publication?
No!<br>
slide45. Example of Caveat (# of grad students)2 is actually positively correlated with publications!
r=0.46<br>
slide46. Example of Caveat The relationship is only in the negative direction when the number of graduate students is already in the model… In other words, the second feature is in the context of the first feature.<br>
slide47. Questions? Comments?<br>
slide48. What is Algorithmic Bias?<br>
slide49. Algorithmic Bias: Classical Definition Biased computer systems “systematically and unfairly discriminate against individuals or groups of individuals in favor of others.
(Friedman & Nissenbaum, 1996)<br>
slide50. Algorithmic Bias: Working Definition Cases where model performance is substantially better or worse across mutually exclusive groups, separated by non-malleable factors
(Baker & Hawn, 2022)<br>
slide51. Why does algorithmic bias happen?<br>
slide52. Why does algorithmic bias matter?<br>
slide53. Why is it still rare to check for algorithmic bias?<br>
slide54. What are some paradigms and metrics to evaluate algorithmic bias?<br>
slide55. Lots of paradigms and metrics for algorithmic bias Most of the time, people in our field just check for difference in model success at making predictions (which is the Separation paradigm of algorithmic bias)
Compute AUC ROC for each group, and then compare
for example, see Zhang et al., (2022) in next week’s reading (Ch.1, V5)
We will also discuss AUC ROC next week
Here are more examples that evaluate algorithmic bias in education (the wiki page)
Why?<br>
slide56. Comments? Questions?<br>
slide57. Explainable and Interpretable AI What’s the difference?<br>
slide58. Explainable AI AI where the reasons for a specific prediction can be explained to a human<br>
slide59. Interpretable AI AI where the process leading to predictions can be understood by a human<br>
slide60. AI Methods for Explainable AI Contribution of predictor
How much worse does the model do without the predictor?
What proportion of models within an ensemble contain the predictor? (This is what Random Forest uses)
The average of the predictor’s contribution to the final prediction in all possible scenarios (SHAP values)<br>
slide61. AI Methods for Explainable AI Sensitivity analysis
If we change each of the predictors, which predictor changes most impact the prediction? (LIME)
Which predictor values cannot change, or the prediction would change? (CEM)
What are the smallest changes to predictors that would change the prediction? (DiCE)<br>
slide62. AI Methods for Explainable AI Layer-wise relevance propagation (LRP)
Take the result and run neural network backwards
Which specific predictors/values stay the same as the original data?<br>
slide63. Questions? Comments?<br>
slide64. Can you… Come up with a scenario where one or more of these explainability approaches is a clear good choice?
What’s the scenario? Which explainability approach?<br>
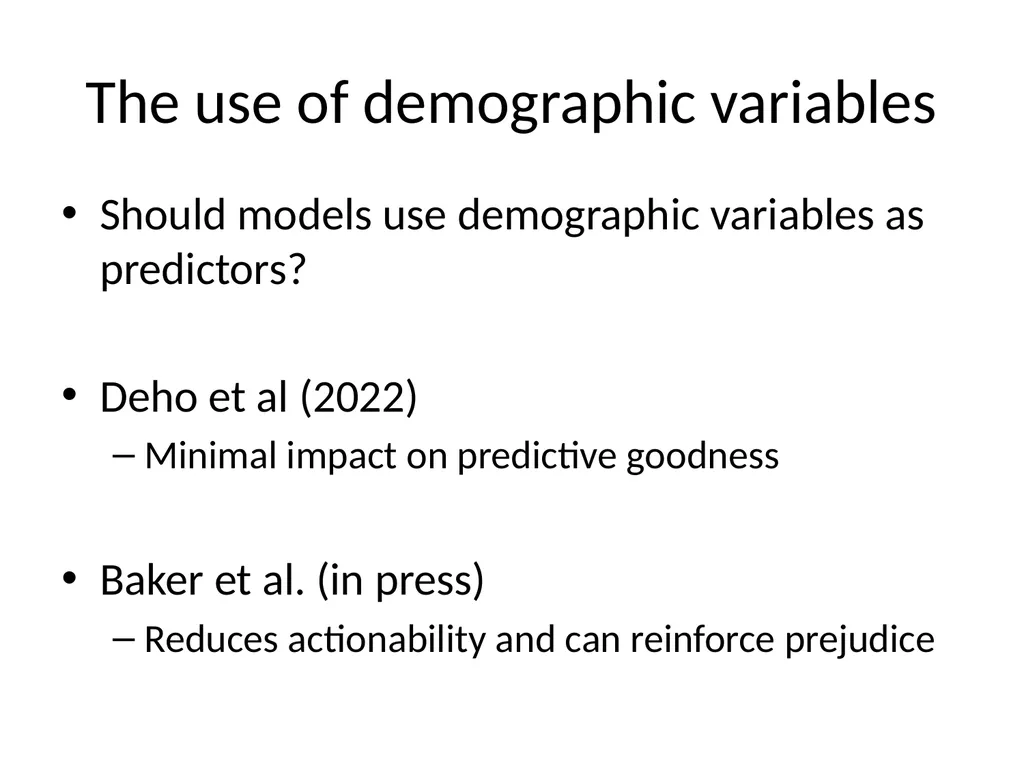
slide65. The use of demographic variables Should models use demographic variables as predictors?
Deho et al (2022)
Minimal impact on predictive goodness
Baker et al. (in press)
Reduces actionability and can reinforce prejudice<br>
slide66. Not done with prediction models 3: Behavior & Affect Modeling
4: Diagnostic Metrics
5: Feature Engineering & Tweaking Towards Optimality<br>
slide67. Any last questions or comments?<br>
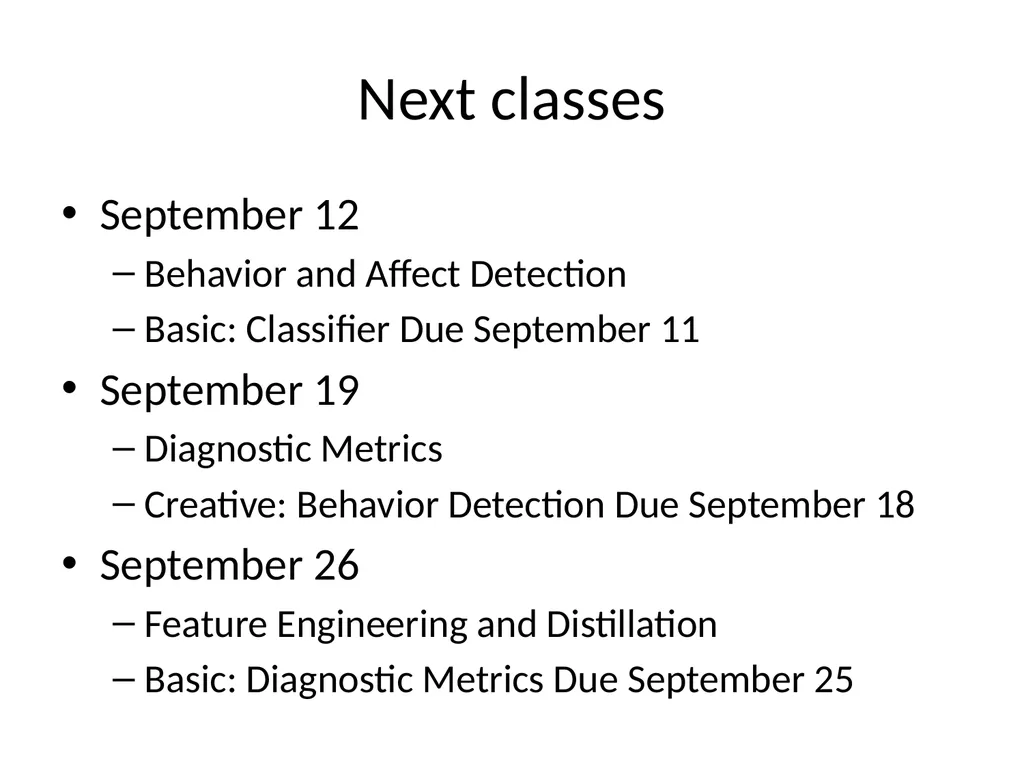
slide68. Next classes September 12
Behavior and Affect Detection
Basic: Classifier Due September 11
September 19
Diagnostic Metrics
Creative: Behavior Detection Due September 18
September 26
Feature Engineering and Distillation
Basic: Diagnostic Metrics Due September 25<br>

slide69. The End<br>
slide2. Questions about Basic HW 1?<br>
slide3. Reminders: basic assignments You don’t have to do it perfectly, you just have to do it
You will NOT be penalized for using hints (appropriately)
If you run into trouble, post to the discussion forum<br>
slide4. Note: basic assignments If it tells you to show your work, put in a couple characters there
We do not expect you to show your work
This is a glitch and we’re trying to fix it – thanks for your understanding<br>
slide5. Reminder: class time In some semesters, the video textbook is a little out of date
In those semesters, we use class time to lecture
But this semester, the video textbook is reasonably up to date
So we will use class time to discuss, answer questions, etc.<br>
slide6. What this means Bring questions<br>
slide7. Exercise on your own Do not raise your hand or tell me the answer
Who watched all the assigned videos?<br>
slide8. Exercise on your own Do not raise your hand or tell me the answer
Who watched all the assigned videos?
If you didn’t do this, you missed the key content for the week!
Even more important than coming to class<br>
slide9. Let’s get warmed up<br>
slide10. What is big data?<br>
slide11. Some definitions “Big data” is data big enough that traditional statistical significance testing becomes useless
“Big data” is data too big to input into a traditional relational database
“Big data” is data too big to work with on a single machine<br>
slide12. A moving target 2004: I reported a data set with 31,450 data points. People were impressed.
2014: A reviewer in an education journal criticized me for referring to 817,485 data points as “big data”.<br>
slide13. Not just big but open is important More and more educational data sets can be accessed by the public
The EDM Society even runs an annual best open data set competition (see previous winners)
Very different than how things used to be<br>
slide14. Tycho Brahe Spent 24 years observing the sky from a custom-built castle on the island of Hven<br>
slide15. Johannes Kepler Had to take a job with Brahe to get Brahe’s data<br>
slide16. Johannes Kepler Had to take a job with Brahe to get Brahe’s data
Only got unrestricted access to data…<br>
slide17. Johannes Kepler Had to take a job with Brahe to get Brahe’s data
Only got unrestricted access to data… when Brahe died<br>
slide18. Johannes Kepler Had to take a job with Brahe to get Brahe’s data
Only got unrestricted access to data… when Brahe died
and Kepler stole the data andfled to Germany<br>
slide19. What are the types of EDM method?<br>
slide20. What are the types of EDM method? According to Baker (any version)
Top-level first<br>
slide21. What type of method are each of these?(According to Baker) Classification
Regression
Correlation Mining
Factor Analysis
Domain Structure Discovery
Network Analysis
Clustering
Association rule mining
Sequential pattern mining
Latent Knowledge Estimation
Causal data mining<br>
slide22. Today Prediction Modeling
Classic Categories
Classification
Binary Classification
Regression
Density Estimation
Contemporary Categories
Sequential Classifiers
Next Token Prediction
Matrix Classifiers<br>
slide23. What do each of these predict? Prediction Modeling
Classic Categories
Classification
Binary Classification
Regression
Density Estimation
Contemporary Categories
Sequential Classifiers
Next Token Prediction
Matrix Classifiers<br>
slide24. Can you give me an application of these? Prediction Modeling
Classic Categories
Classification
Binary Classification
Regression
Density Estimation
Contemporary Categories
Sequential Classifiers
Next Token Prediction
Matrix Classifiers<br>
slide25. Density Estimator Predicts a probability density function
Not used much in education
Used more in other domains<br>
slide26. Next token prediction Famously, in large language models<br>
slide27. Matrix prediction Predicting a 2x2 or multi-dimensional matrix from
Part of the matrix
A sentence<br>
slide28. Can you give me any examples of this? Predicting a 2x2 or multi-dimensional matrix from
Part of the matrix
A sentence<br>
slide29. DALL-E 2 "Teddy bears working on new AI research underwater with 1990s technology"<br>
slide30. Transformer/Foundation Models Who here can tell us what a transformer model/foundation model is?<br>
slide31. Transformer/Foundation Models Some examples
ChatGPT
DALL-E 2 or StableDiffusion or MidJourney
Claude
Gemini
MathBERT<br>
slide32. Raise Your HandsWho has used each of these? ChatGPT
DALL-E 2 or StableDiffusion or MidJourney
Claude
Gemini
MathBERT<br>
slide33. Questions? Comments?<br>
slide34. The videos discussed a range of algorithms Linear Regression
Regression Trees
Logistic Regression (a classifier!)
Decision Trees
Random Forest (Bagging)
XGBoost (Boosting)
Neural Networks/Recurrent Neural Networks
What Transformer/Foundation Models are built on<br>
slide35. Questions or comments about any of these?<br>
slide36. Has anyone Used any classification algorithms outside the set discussed/recommended in the videos?
Say more?<br>
slide37. A practical question<br>
slide38. Should you Pick one algorithm that seems really appropriate?
Run every algorithm that will actually run for your data?
Something in between?<br>
slide39. Our typical lab practice Pick a small number of algorithms that
Have worked on past similar problems
Fit different kinds of patterns from each other<br>
slide40. Is it really the algorithm? Or is it the data you put into it?
We’ll come back to this in the Feature Engineering lecture<br>
slide41. Interpreting Regression Models Let’s quickly review the example from the video<br>
slide42. Example of Caveat Let’s graph the relationship between number of graduate students and number of papers per year<br>
slide43. Data<br>
slide44. Model Number of papers = 4 + 2 * # of grad students - 0.1 * (# of grad students)2
But does that actually mean that (# of grad students)2 is associated with less publication?
No!<br>
slide45. Example of Caveat (# of grad students)2 is actually positively correlated with publications!
r=0.46<br>
slide46. Example of Caveat The relationship is only in the negative direction when the number of graduate students is already in the model… In other words, the second feature is in the context of the first feature.<br>
slide47. Questions? Comments?<br>
slide48. What is Algorithmic Bias?<br>
slide49. Algorithmic Bias: Classical Definition Biased computer systems “systematically and unfairly discriminate against individuals or groups of individuals in favor of others.
(Friedman & Nissenbaum, 1996)<br>
slide50. Algorithmic Bias: Working Definition Cases where model performance is substantially better or worse across mutually exclusive groups, separated by non-malleable factors
(Baker & Hawn, 2022)<br>
slide51. Why does algorithmic bias happen?<br>
slide52. Why does algorithmic bias matter?<br>
slide53. Why is it still rare to check for algorithmic bias?<br>
slide54. What are some paradigms and metrics to evaluate algorithmic bias?<br>
slide55. Lots of paradigms and metrics for algorithmic bias Most of the time, people in our field just check for difference in model success at making predictions (which is the Separation paradigm of algorithmic bias)
Compute AUC ROC for each group, and then compare
for example, see Zhang et al., (2022) in next week’s reading (Ch.1, V5)
We will also discuss AUC ROC next week
Here are more examples that evaluate algorithmic bias in education (the wiki page)
Why?<br>
slide56. Comments? Questions?<br>
slide57. Explainable and Interpretable AI What’s the difference?<br>
slide58. Explainable AI AI where the reasons for a specific prediction can be explained to a human<br>
slide59. Interpretable AI AI where the process leading to predictions can be understood by a human<br>
slide60. AI Methods for Explainable AI Contribution of predictor
How much worse does the model do without the predictor?
What proportion of models within an ensemble contain the predictor? (This is what Random Forest uses)
The average of the predictor’s contribution to the final prediction in all possible scenarios (SHAP values)<br>
slide61. AI Methods for Explainable AI Sensitivity analysis
If we change each of the predictors, which predictor changes most impact the prediction? (LIME)
Which predictor values cannot change, or the prediction would change? (CEM)
What are the smallest changes to predictors that would change the prediction? (DiCE)<br>
slide62. AI Methods for Explainable AI Layer-wise relevance propagation (LRP)
Take the result and run neural network backwards
Which specific predictors/values stay the same as the original data?<br>
slide63. Questions? Comments?<br>
slide64. Can you… Come up with a scenario where one or more of these explainability approaches is a clear good choice?
What’s the scenario? Which explainability approach?<br>
slide65. The use of demographic variables Should models use demographic variables as predictors?
Deho et al (2022)
Minimal impact on predictive goodness
Baker et al. (in press)
Reduces actionability and can reinforce prejudice<br>
slide66. Not done with prediction models 3: Behavior & Affect Modeling
4: Diagnostic Metrics
5: Feature Engineering & Tweaking Towards Optimality<br>
slide67. Any last questions or comments?<br>
slide68. Next classes September 12
Behavior and Affect Detection
Basic: Classifier Due September 11
September 19
Diagnostic Metrics
Creative: Behavior Detection Due September 18
September 26
Feature Engineering and Distillation
Basic: Diagnostic Metrics Due September 25<br>

slide69. The End<br>