
Corporate Finance for Long-Term Value Chapter 15:



Description: Corporate Finance for Long-Term Value Chapter 15: Capital structure Chapter 15: Capital structure Part 5: Corporate financial policies The BIG Picture 3 How should companies decide on their capital structure? Capital structure is the
Related Topics
Download Presentation
"Corporate Finance for Long-Term Value Chapter 15:" is the property of its rightful owner. Permission is granted to download and print the materials on this website for personal, non-commercial use only, and to display it on your personal computer provided you do not modify the materials and that you retain all copyright notices contained in the materials. By downloading content from our website, you accept the terms of this agreement.
Presentation Transcript
slide1. Corporate Finance for
Long-Term Value Chapter 15: Capital structure<br>
slide2. Chapter 15: Capital structure Part 5: Corporate financial policies<br>
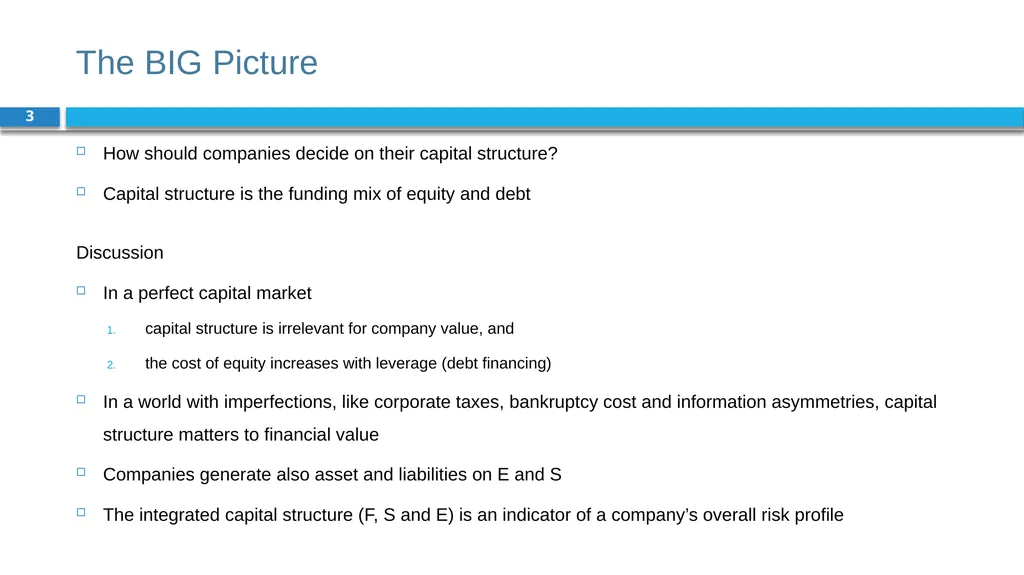
slide3. The BIG Picture 3 How should companies decide on their capital structure?
Capital structure is the funding mix of equity and debt
Discussion
In a perfect capital market
capital structure is irrelevant for company value, and
the cost of equity increases with leverage (debt financing)
In a world with imperfections, like corporate taxes, bankruptcy cost and information asymmetries, capital structure matters to financial value
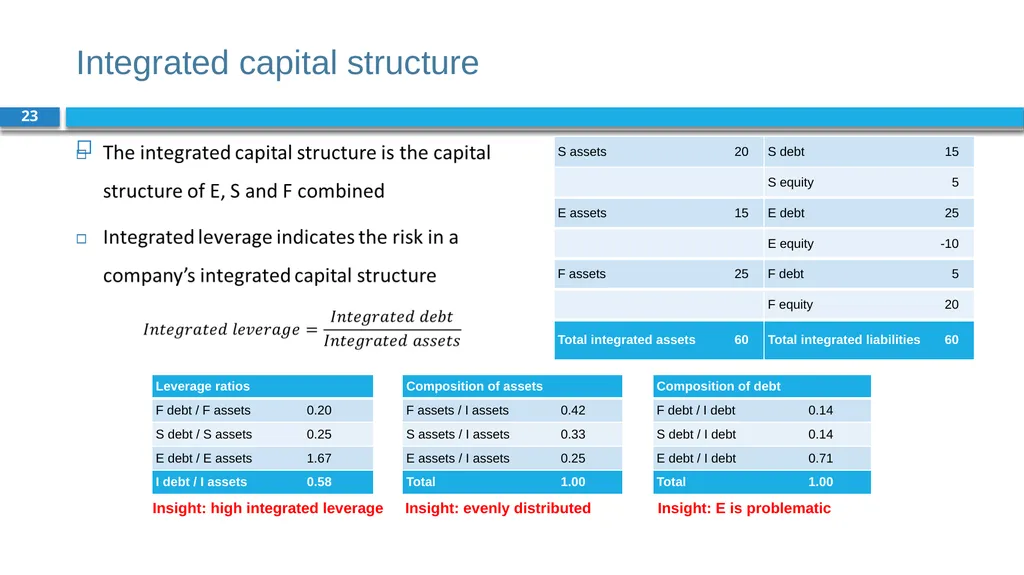
Companies generate also asset and liabilities on E and S
The integrated capital structure (F, S and E) is an indicator of a company’s overall risk profile<br>
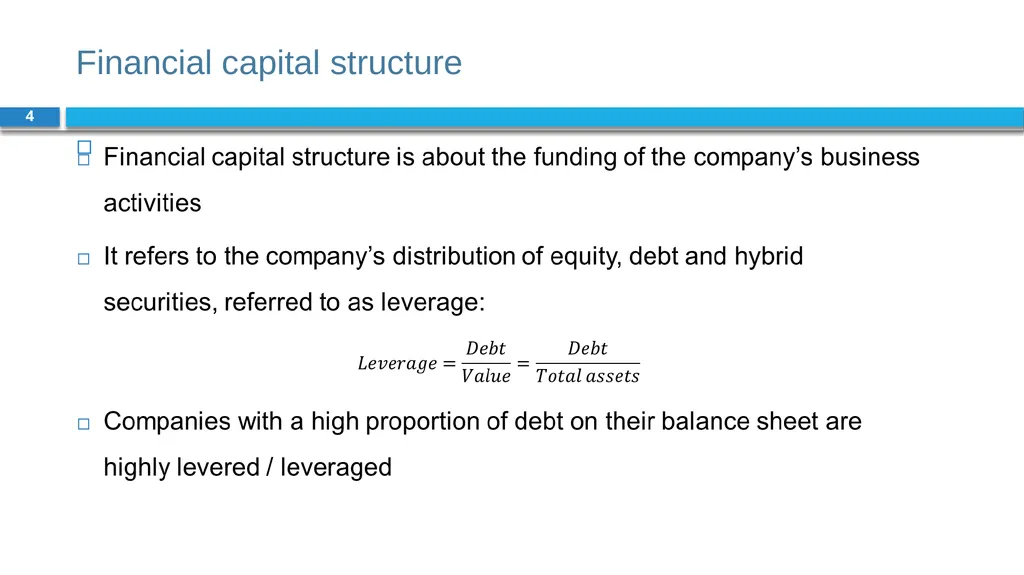
slide4. Financial capital structure 4<br>
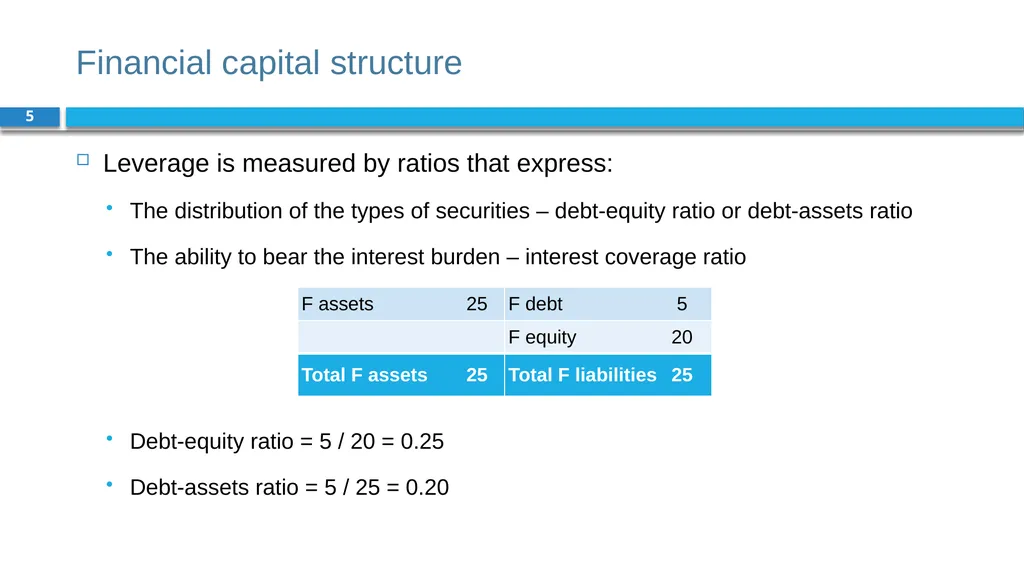
slide5. Financial capital structure 5 Leverage is measured by ratios that express:
The distribution of the types of securities – debt-equity ratio or debt-assets ratio
The ability to bear the interest burden – interest coverage ratio
Debt-equity ratio = 5 / 20 = 0.25
Debt-assets ratio = 5 / 25 = 0.20<br>
slide6. Theories on perfect capital markets 6 Modigliani and Miller (1958): corporate finance in the real world is a complex topic
Arbitrage argument: due to buying and selling a company’s shares with borrowed funds, price differences on leverage should disappear
Two MM propositions:
MM1: In a perfect capital market, the value of the levered company VL equals the value of the unlevered company VU
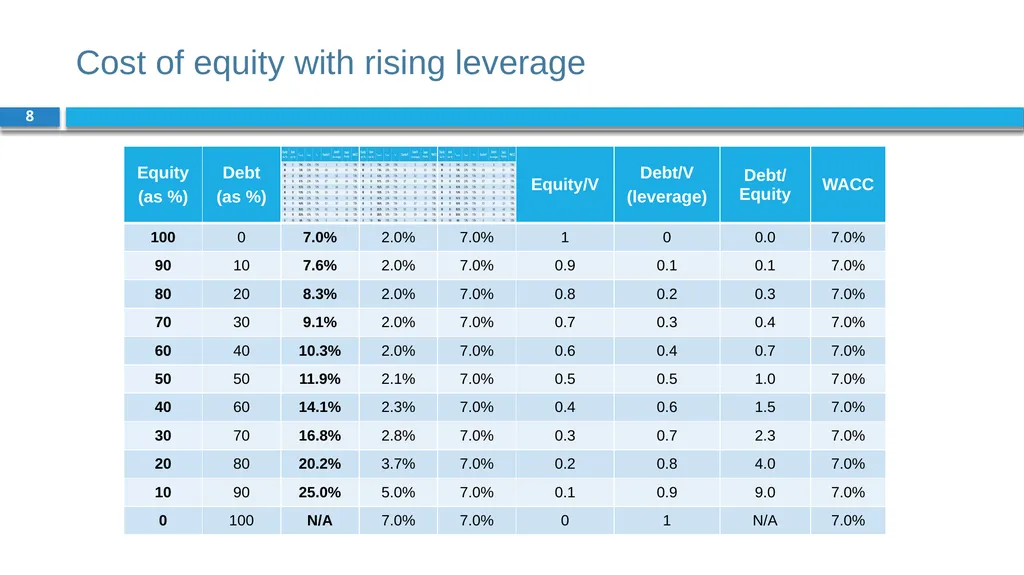
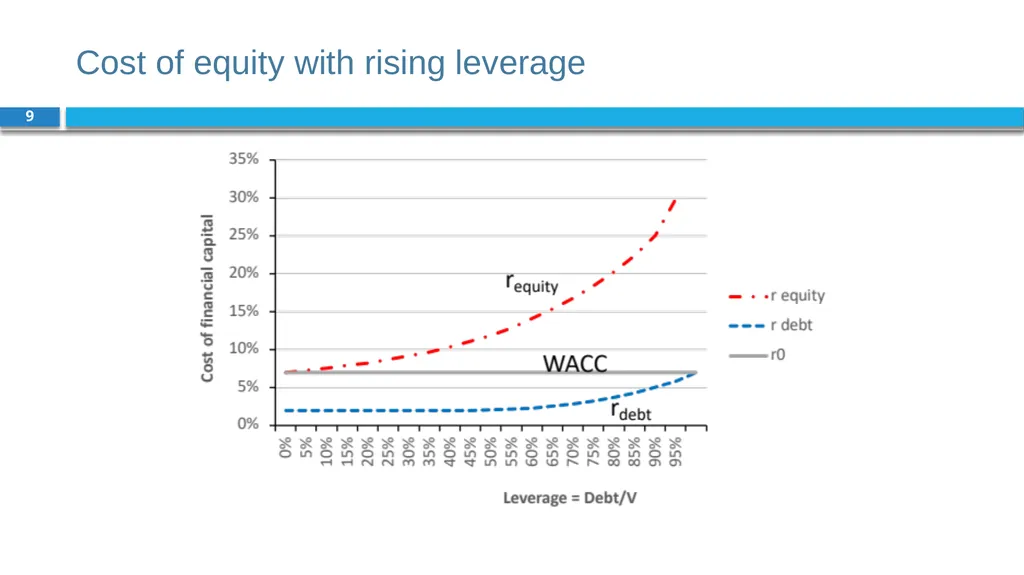
MM2: The cost of capital of levered equity increases with the company’s debt-equity ratio (based on market values of debt and equity)<br>
slide7. Theories on perfect capital markets 7<br>
slide8. Cost of equity with rising leverage 8<br>
slide9. Cost of equity with rising leverage 9<br>
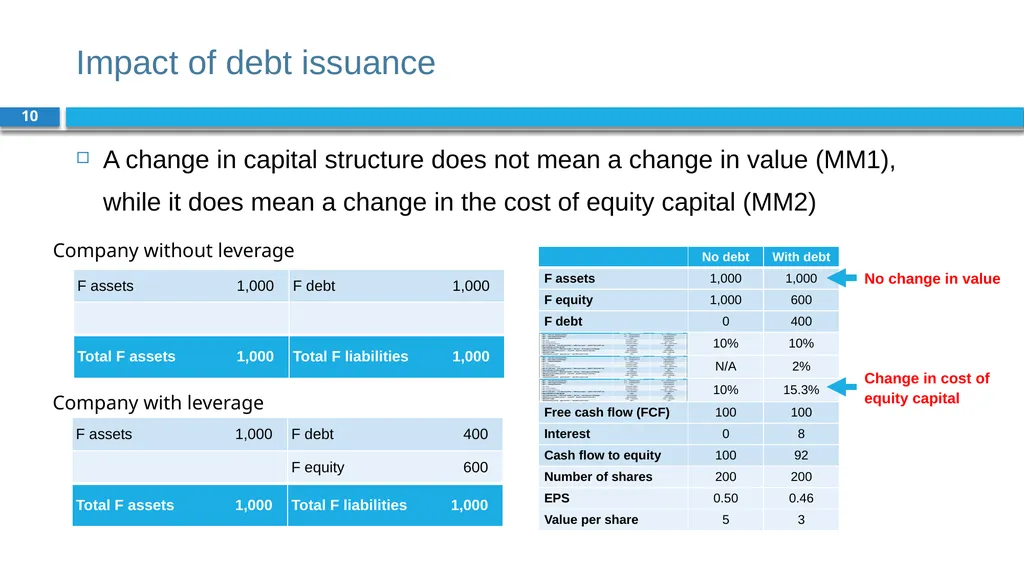
slide10. Impact of debt issuance 10 Company without leverage Company with leverage A change in capital structure does not mean a change in value (MM1), while it does mean a change in the cost of equity capital (MM2) No change in value Change in cost of equity capital<br>
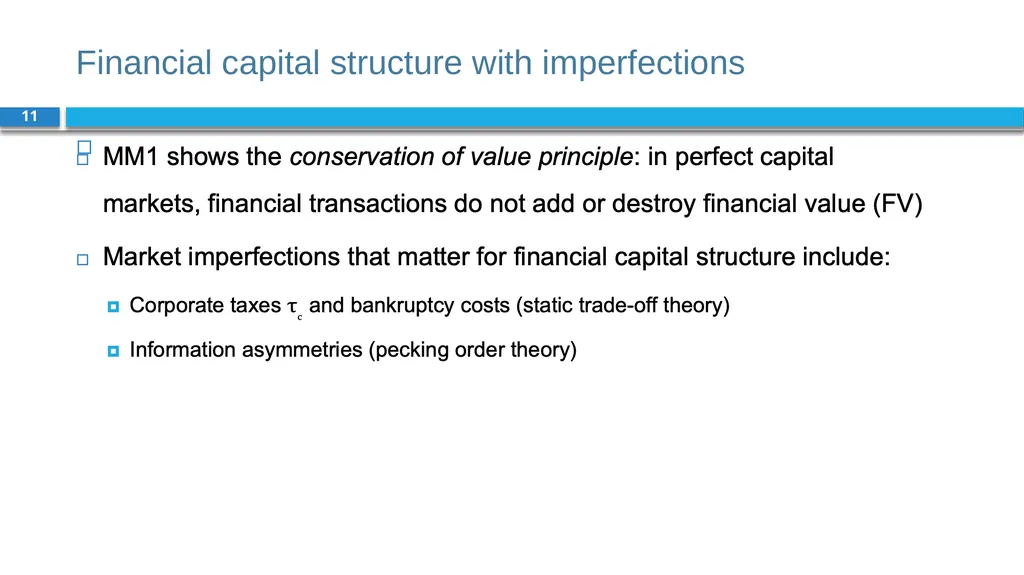
slide11. Financial capital structure with imperfections 11<br>
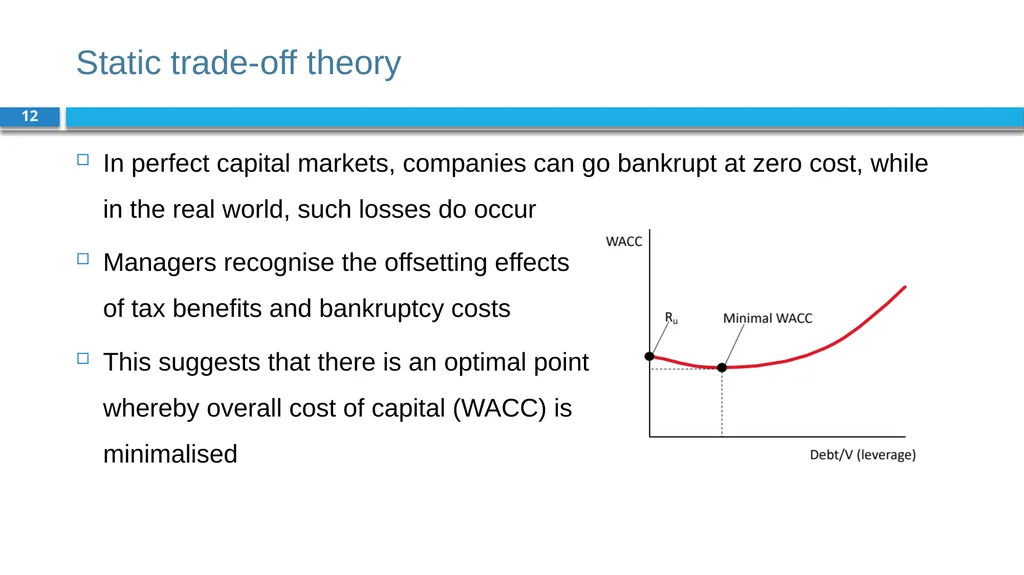
slide12. Static trade-off theory 12 In perfect capital markets, companies can go bankrupt at zero cost, while in the real world, such losses do occur
Managers recognise the offsetting effects of tax benefits and bankruptcy costs
This suggests that there is an optimal point whereby overall cost of capital (WACC) is minimalised<br>
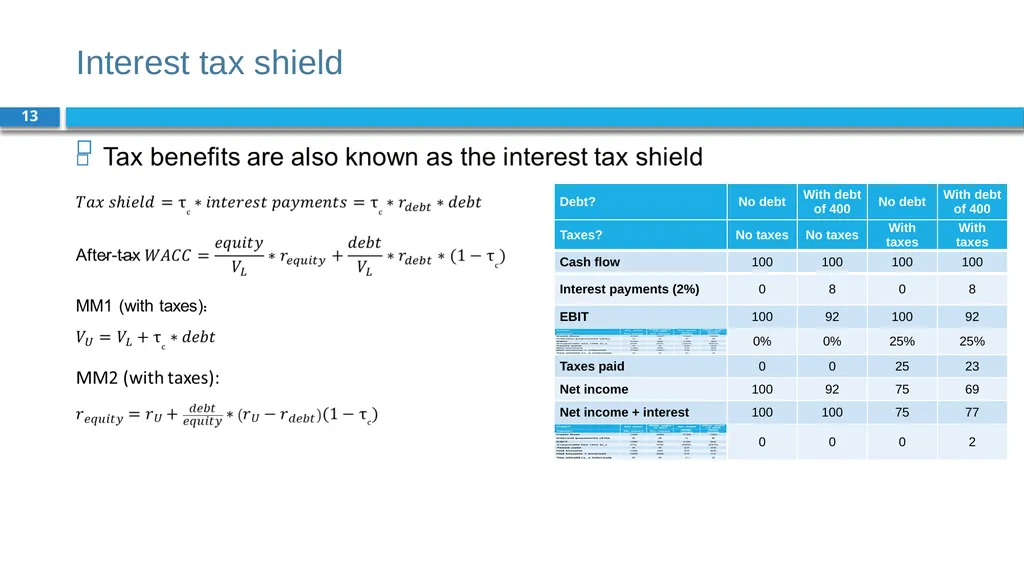
slide13. Interest tax shield 13<br>
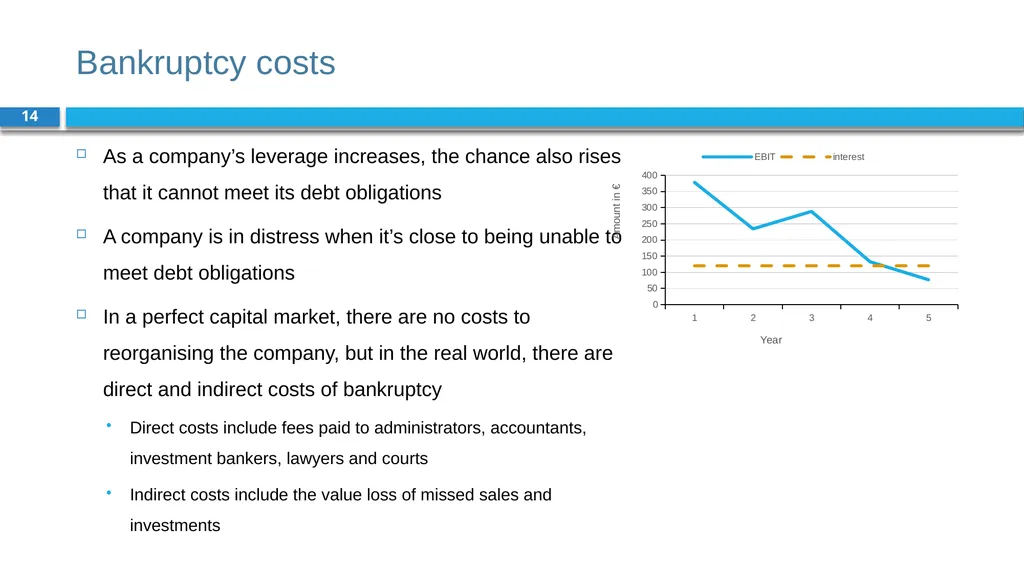
slide14. Bankruptcy costs 14 As a company’s leverage increases, the chance also rises that it cannot meet its debt obligations
A company is in distress when it’s close to being unable to meet debt obligations
In a perfect capital market, there are no costs to reorganising the company, but in the real world, there are direct and indirect costs of bankruptcy
Direct costs include fees paid to administrators, accountants, investment bankers, lawyers and courts
Indirect costs include the value loss of missed sales and investments<br>
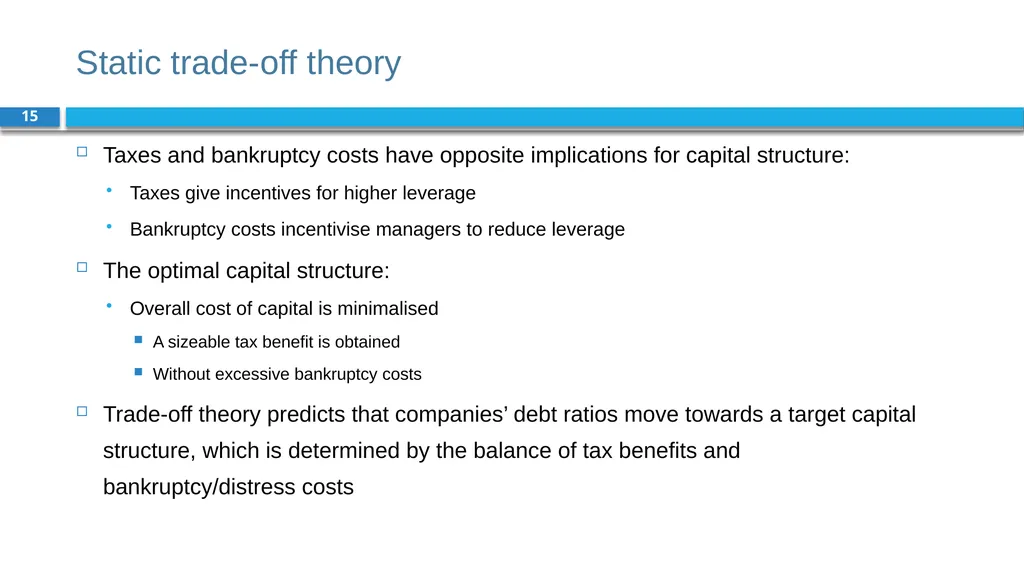
slide15. Static trade-off theory 15 Taxes and bankruptcy costs have opposite implications for capital structure:
Taxes give incentives for higher leverage
Bankruptcy costs incentivise managers to reduce leverage
The optimal capital structure:
Overall cost of capital is minimalised
A sizeable tax benefit is obtained
Without excessive bankruptcy costs
Trade-off theory predicts that companies’ debt ratios move towards a target capital structure, which is determined by the balance of tax benefits and bankruptcy/distress costs<br>
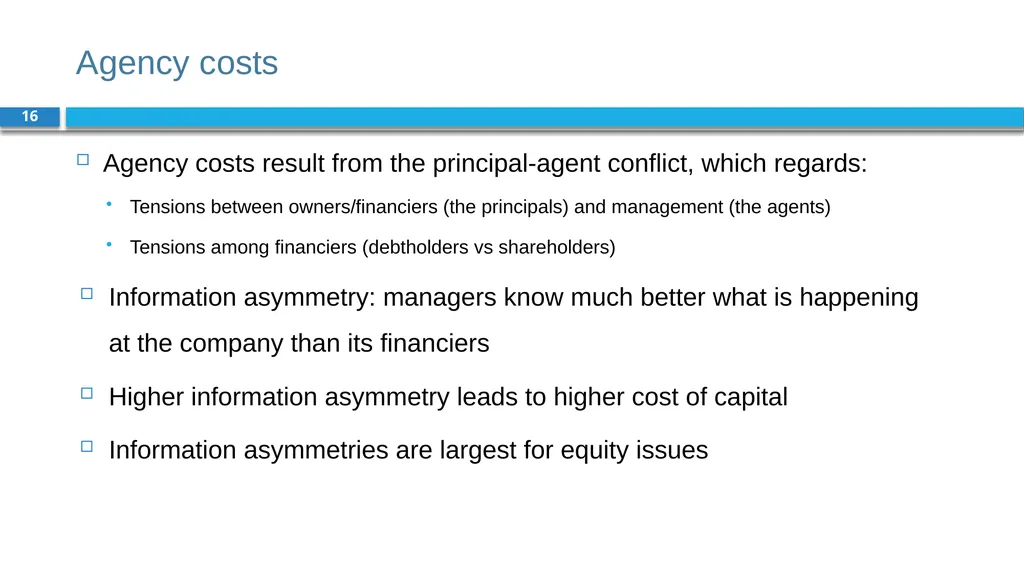
slide16. Agency costs 16 Agency costs result from the principal-agent conflict, which regards:
Tensions between owners/financiers (the principals) and management (the agents)
Tensions among financiers (debtholders vs shareholders)
Information asymmetry: managers know much better what is happening at the company than its financiers
Higher information asymmetry leads to higher cost of capital
Information asymmetries are largest for equity issues<br>
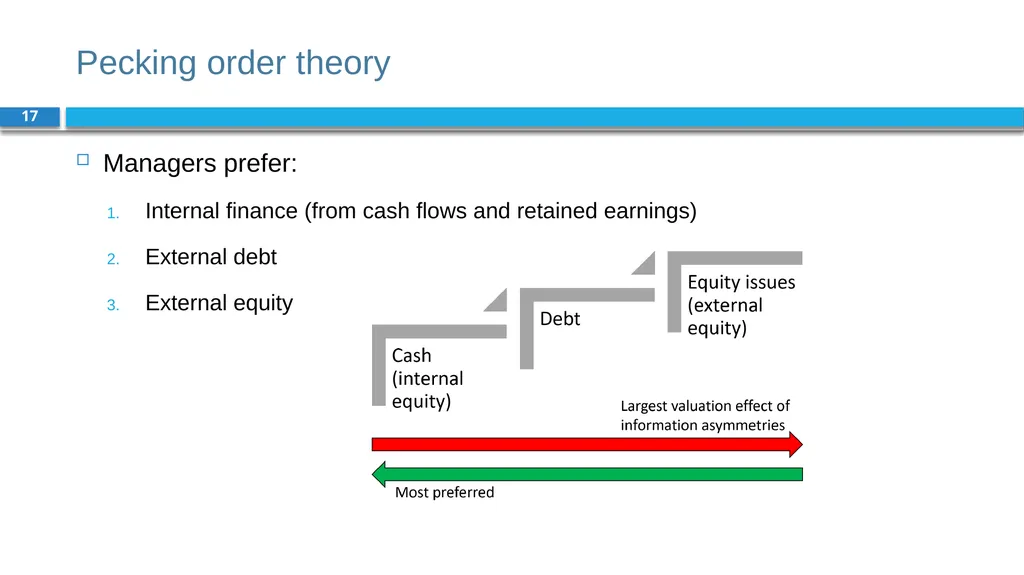
slide17. Pecking order theory 17 Managers prefer:
Internal finance (from cash flows and retained earnings)
External debt
External equity<br>
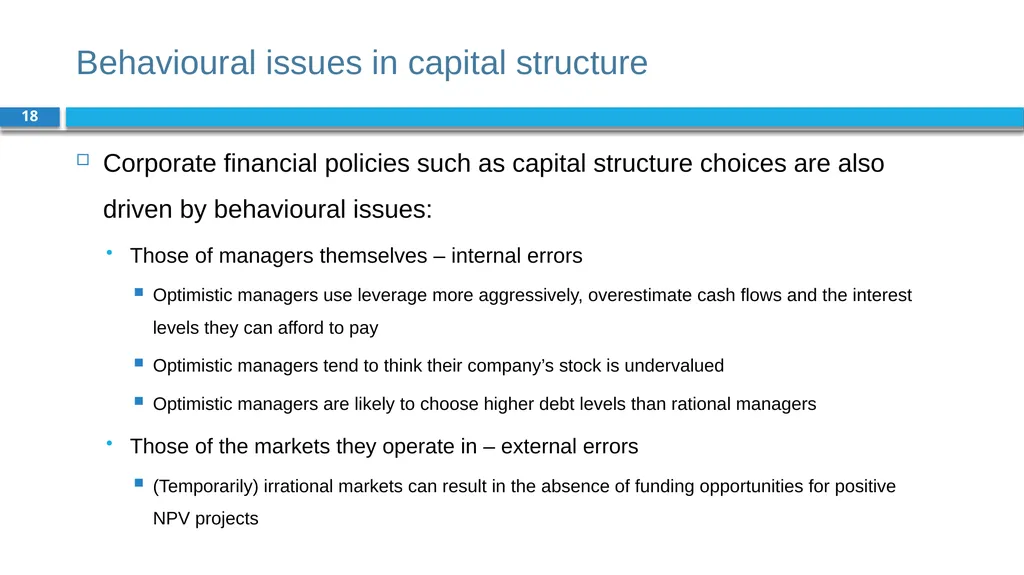
slide18. Behavioural issues in capital structure 18 Corporate financial policies such as capital structure choices are also driven by behavioural issues:
Those of managers themselves – internal errors
Optimistic managers use leverage more aggressively, overestimate cash flows and the interest levels they can afford to pay
Optimistic managers tend to think their company’s stock is undervalued
Optimistic managers are likely to choose higher debt levels than rational managers
Those of the markets they operate in – external errors
(Temporarily) irrational markets can result in the absence of funding opportunities for positive NPV projects<br>
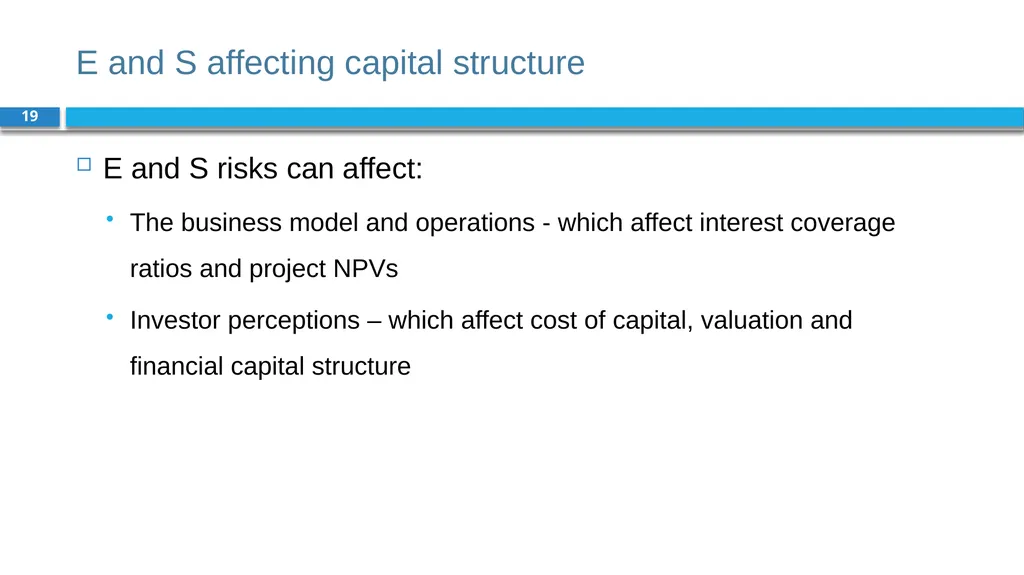
slide19. E and S affecting capital structure 19 E and S risks can affect:
The business model and operations - which affect interest coverage ratios and project NPVs
Investor perceptions – which affect cost of capital, valuation and financial capital structure<br>
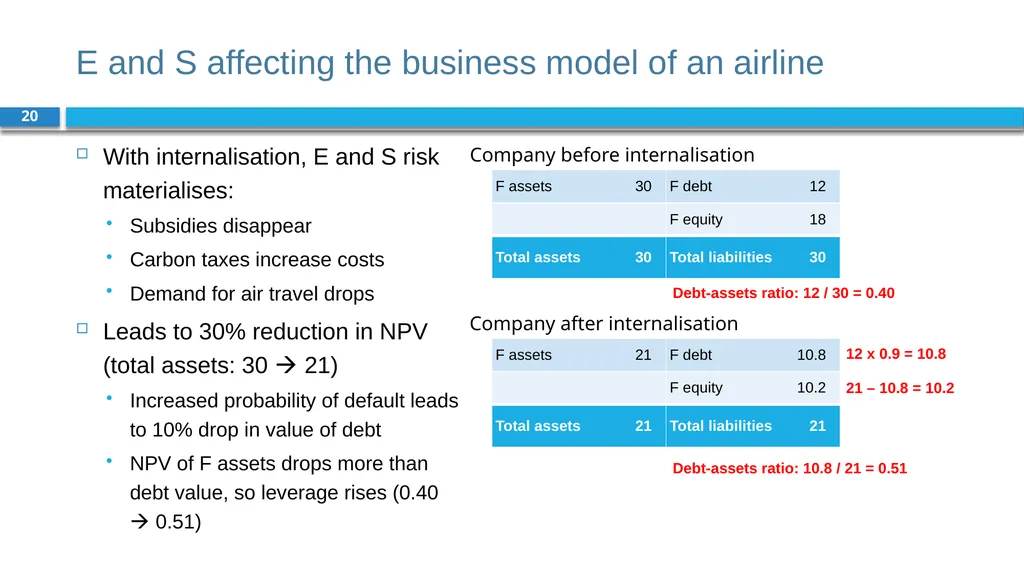
slide20. E and S affecting the business model of an airline 20 With internalisation, E and S risk materialises:
Subsidies disappear
Carbon taxes increase costs
Demand for air travel drops
Leads to 30% reduction in NPV (total assets: 30 21)
Increased probability of default leads to 10% drop in value of debt
NPV of F assets drops more than debt value, so leverage rises (0.40 0.51) Company before internalisation Company after internalisation 12 x 0.9 = 10.8 21 – 10.8 = 10.2 Debt-assets ratio: 10.8 / 21 = 0.51 Debt-assets ratio: 12 / 30 = 0.40<br>
slide21. E and S affecting investor perceptions 21 In anticipation of possible internalisation of E and S, investors may perceive higher financial risk
Leads to lower asset value due to higher discount rate and/or lower expected cash flows
Lower expected cash flows result from investors attaching higher probabilities to more negative scenarios
Higher cost of capital results from higher expected variations in outcomes and sensitivity to market returns<br>
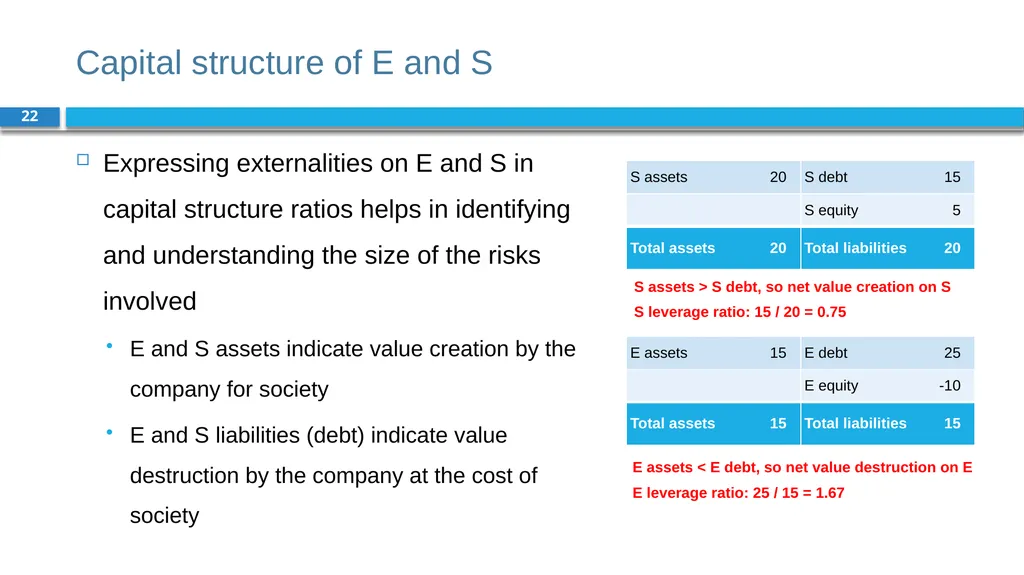
slide22. Capital structure of E and S 22 Expressing externalities on E and S in capital structure ratios helps in identifying and understanding the size of the risks involved
E and S assets indicate value creation by the company for society
E and S liabilities (debt) indicate value destruction by the company at the cost of society S assets > S debt, so net value creation on S
S leverage ratio: 15 / 20 = 0.75 E assets < E debt, so net value destruction on E
E leverage ratio: 25 / 15 = 1.67<br>
slide23. Integrated capital structure 23 Insight: high integrated leverage Insight: evenly distributed Insight: E is problematic<br>
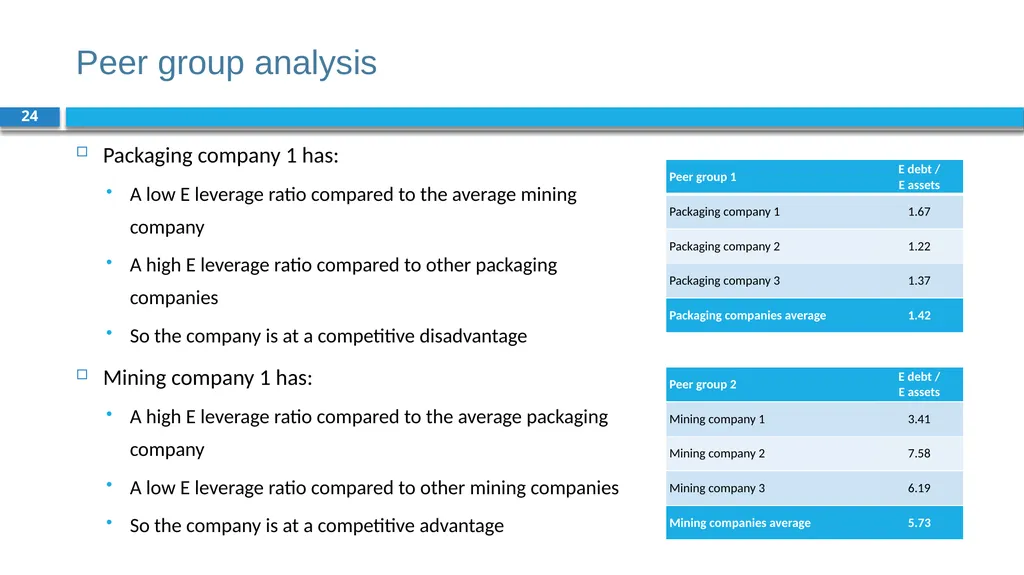
slide24. Peer group analysis 24 Packaging company 1 has:
A low E leverage ratio compared to the average mining company
A high E leverage ratio compared to other packaging companies
So the company is at a competitive disadvantage
Mining company 1 has:
A high E leverage ratio compared to the average packaging company
A low E leverage ratio compared to other mining companies
So the company is at a competitive advantage<br>
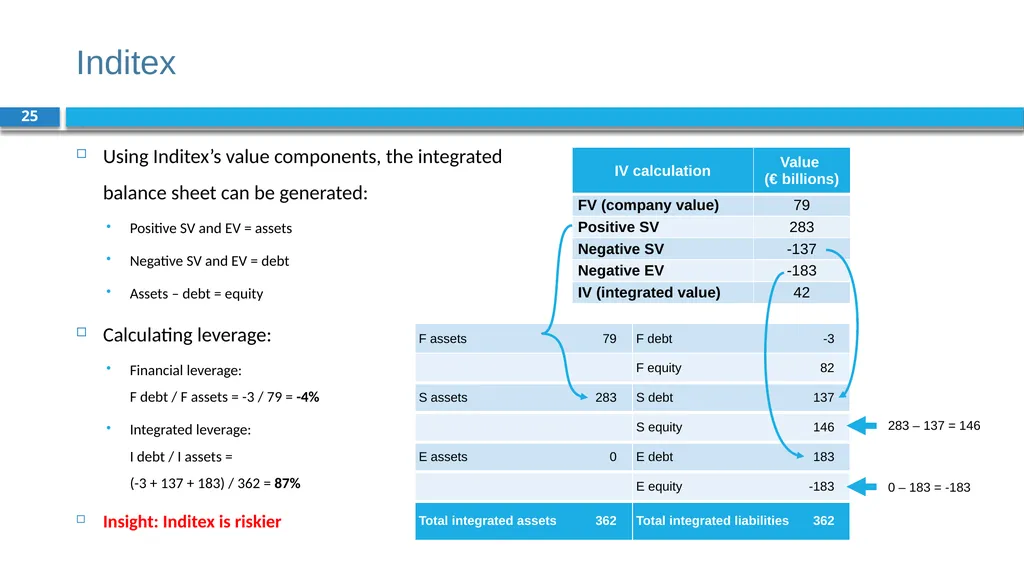
slide25. Inditex 25 Using Inditex’s value components, the integrated balance sheet can be generated:
Positive SV and EV = assets
Negative SV and EV = debt
Assets – debt = equity
Calculating leverage:
Financial leverage: F debt / F assets = -3 / 79 = -4%
Integrated leverage: I debt / I assets = (-3 + 137 + 183) / 362 = 87%
Insight: Inditex is riskier 283 – 137 = 146 0 – 183 = -183<br>
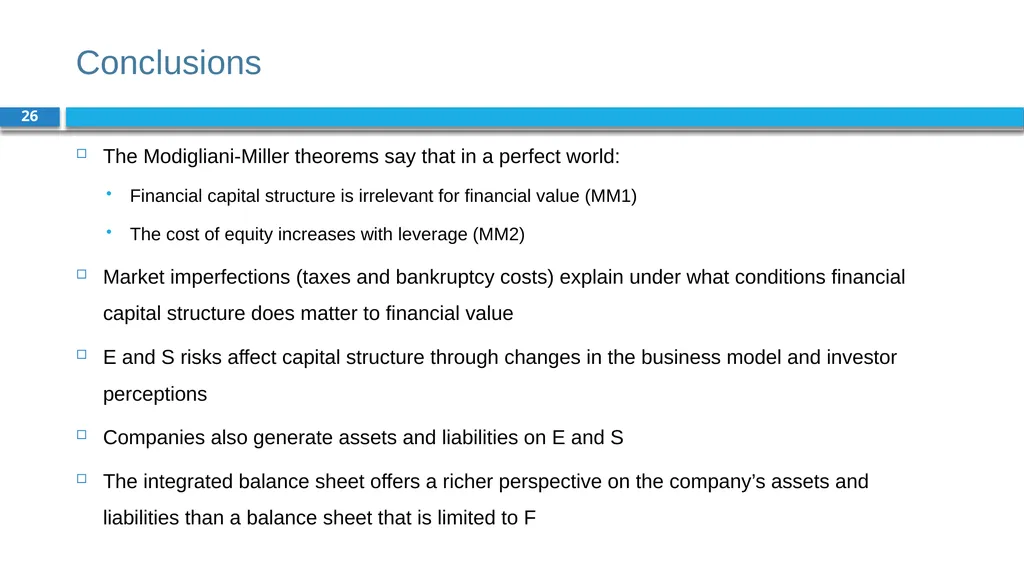
slide26. Conclusions 26 The Modigliani-Miller theorems say that in a perfect world:
Financial capital structure is irrelevant for financial value (MM1)
The cost of equity increases with leverage (MM2)
Market imperfections (taxes and bankruptcy costs) explain under what conditions financial capital structure does matter to financial value
E and S risks affect capital structure through changes in the business model and investor perceptions
Companies also generate assets and liabilities on E and S
The integrated balance sheet offers a richer perspective on the company’s assets and liabilities than a balance sheet that is limited to F<br>
slide2. Chapter 15: Capital structure Part 5: Corporate financial policies<br>
slide3. The BIG Picture 3 How should companies decide on their capital structure?
Capital structure is the funding mix of equity and debt
Discussion
In a perfect capital market
capital structure is irrelevant for company value, and
the cost of equity increases with leverage (debt financing)
In a world with imperfections, like corporate taxes, bankruptcy cost and information asymmetries, capital structure matters to financial value
Companies generate also asset and liabilities on E and S
The integrated capital structure (F, S and E) is an indicator of a company’s overall risk profile<br>
slide4. Financial capital structure 4<br>
slide5. Financial capital structure 5 Leverage is measured by ratios that express:
The distribution of the types of securities – debt-equity ratio or debt-assets ratio
The ability to bear the interest burden – interest coverage ratio
Debt-equity ratio = 5 / 20 = 0.25
Debt-assets ratio = 5 / 25 = 0.20<br>
slide6. Theories on perfect capital markets 6 Modigliani and Miller (1958): corporate finance in the real world is a complex topic
Arbitrage argument: due to buying and selling a company’s shares with borrowed funds, price differences on leverage should disappear
Two MM propositions:
MM1: In a perfect capital market, the value of the levered company VL equals the value of the unlevered company VU
MM2: The cost of capital of levered equity increases with the company’s debt-equity ratio (based on market values of debt and equity)<br>
slide7. Theories on perfect capital markets 7<br>
slide8. Cost of equity with rising leverage 8<br>
slide9. Cost of equity with rising leverage 9<br>
slide10. Impact of debt issuance 10 Company without leverage Company with leverage A change in capital structure does not mean a change in value (MM1), while it does mean a change in the cost of equity capital (MM2) No change in value Change in cost of equity capital<br>
slide11. Financial capital structure with imperfections 11<br>
slide12. Static trade-off theory 12 In perfect capital markets, companies can go bankrupt at zero cost, while in the real world, such losses do occur
Managers recognise the offsetting effects of tax benefits and bankruptcy costs
This suggests that there is an optimal point whereby overall cost of capital (WACC) is minimalised<br>
slide13. Interest tax shield 13<br>
slide14. Bankruptcy costs 14 As a company’s leverage increases, the chance also rises that it cannot meet its debt obligations
A company is in distress when it’s close to being unable to meet debt obligations
In a perfect capital market, there are no costs to reorganising the company, but in the real world, there are direct and indirect costs of bankruptcy
Direct costs include fees paid to administrators, accountants, investment bankers, lawyers and courts
Indirect costs include the value loss of missed sales and investments<br>
slide15. Static trade-off theory 15 Taxes and bankruptcy costs have opposite implications for capital structure:
Taxes give incentives for higher leverage
Bankruptcy costs incentivise managers to reduce leverage
The optimal capital structure:
Overall cost of capital is minimalised
A sizeable tax benefit is obtained
Without excessive bankruptcy costs
Trade-off theory predicts that companies’ debt ratios move towards a target capital structure, which is determined by the balance of tax benefits and bankruptcy/distress costs<br>
slide16. Agency costs 16 Agency costs result from the principal-agent conflict, which regards:
Tensions between owners/financiers (the principals) and management (the agents)
Tensions among financiers (debtholders vs shareholders)
Information asymmetry: managers know much better what is happening at the company than its financiers
Higher information asymmetry leads to higher cost of capital
Information asymmetries are largest for equity issues<br>
slide17. Pecking order theory 17 Managers prefer:
Internal finance (from cash flows and retained earnings)
External debt
External equity<br>
slide18. Behavioural issues in capital structure 18 Corporate financial policies such as capital structure choices are also driven by behavioural issues:
Those of managers themselves – internal errors
Optimistic managers use leverage more aggressively, overestimate cash flows and the interest levels they can afford to pay
Optimistic managers tend to think their company’s stock is undervalued
Optimistic managers are likely to choose higher debt levels than rational managers
Those of the markets they operate in – external errors
(Temporarily) irrational markets can result in the absence of funding opportunities for positive NPV projects<br>
slide19. E and S affecting capital structure 19 E and S risks can affect:
The business model and operations - which affect interest coverage ratios and project NPVs
Investor perceptions – which affect cost of capital, valuation and financial capital structure<br>
slide20. E and S affecting the business model of an airline 20 With internalisation, E and S risk materialises:
Subsidies disappear
Carbon taxes increase costs
Demand for air travel drops
Leads to 30% reduction in NPV (total assets: 30 21)
Increased probability of default leads to 10% drop in value of debt
NPV of F assets drops more than debt value, so leverage rises (0.40 0.51) Company before internalisation Company after internalisation 12 x 0.9 = 10.8 21 – 10.8 = 10.2 Debt-assets ratio: 10.8 / 21 = 0.51 Debt-assets ratio: 12 / 30 = 0.40<br>
slide21. E and S affecting investor perceptions 21 In anticipation of possible internalisation of E and S, investors may perceive higher financial risk
Leads to lower asset value due to higher discount rate and/or lower expected cash flows
Lower expected cash flows result from investors attaching higher probabilities to more negative scenarios
Higher cost of capital results from higher expected variations in outcomes and sensitivity to market returns<br>
slide22. Capital structure of E and S 22 Expressing externalities on E and S in capital structure ratios helps in identifying and understanding the size of the risks involved
E and S assets indicate value creation by the company for society
E and S liabilities (debt) indicate value destruction by the company at the cost of society S assets > S debt, so net value creation on S
S leverage ratio: 15 / 20 = 0.75 E assets < E debt, so net value destruction on E
E leverage ratio: 25 / 15 = 1.67<br>
slide23. Integrated capital structure 23 Insight: high integrated leverage Insight: evenly distributed Insight: E is problematic<br>
slide24. Peer group analysis 24 Packaging company 1 has:
A low E leverage ratio compared to the average mining company
A high E leverage ratio compared to other packaging companies
So the company is at a competitive disadvantage
Mining company 1 has:
A high E leverage ratio compared to the average packaging company
A low E leverage ratio compared to other mining companies
So the company is at a competitive advantage<br>
slide25. Inditex 25 Using Inditex’s value components, the integrated balance sheet can be generated:
Positive SV and EV = assets
Negative SV and EV = debt
Assets – debt = equity
Calculating leverage:
Financial leverage: F debt / F assets = -3 / 79 = -4%
Integrated leverage: I debt / I assets = (-3 + 137 + 183) / 362 = 87%
Insight: Inditex is riskier 283 – 137 = 146 0 – 183 = -183<br>
slide26. Conclusions 26 The Modigliani-Miller theorems say that in a perfect world:
Financial capital structure is irrelevant for financial value (MM1)
The cost of equity increases with leverage (MM2)
Market imperfections (taxes and bankruptcy costs) explain under what conditions financial capital structure does matter to financial value
E and S risks affect capital structure through changes in the business model and investor perceptions
Companies also generate assets and liabilities on E and S
The integrated balance sheet offers a richer perspective on the company’s assets and liabilities than a balance sheet that is limited to F<br>