Court Ordered Debt: Performance measures &
Description: Court Ordered Debt: Performance measures Benchmarks Judicial Council, Budget services February 2022 1 Delinquent Court Ordered Debt Court-ordered debt can be processed by one or more of these programs: 58 courtcounty programs 13 private
Related Topics
Download Presentation
"Court Ordered Debt: Performance measures &" is the property of its rightful owner. Permission is granted to download and print the materials on this website for personal, non-commercial use only, and to display it on your personal computer provided you do not modify the materials and that you retain all copyright notices contained in the materials. By downloading content from our website, you accept the terms of this agreement.
Presentation Transcript
slide1. Court Ordered Debt:Performance measures & BenchmarksJudicial Council, Budget servicesFebruary 2022 1<br>
slide2. Delinquent Court Ordered Debt Court-ordered debt can be processed by one or more of these programs:
58 court/county programs
13 private collection agencies
2 Franchise Tax Board programs (COD and IIC)
2 Intra-branch programs (Ventura Court, Shasta Court)
Until paid in full or discharged from accountability deemed uncollectible 2<br>
slide3. Performance Measures and Benchmarks (PMB) 3<br>
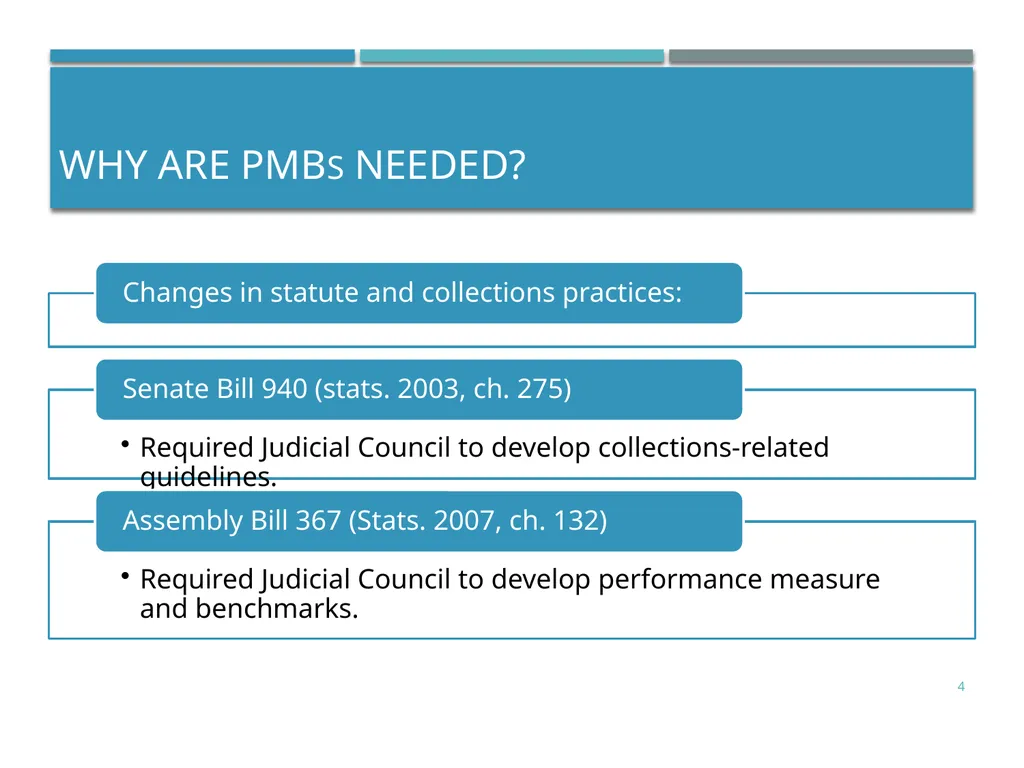
slide4. Why are PMBs needed? 4<br>
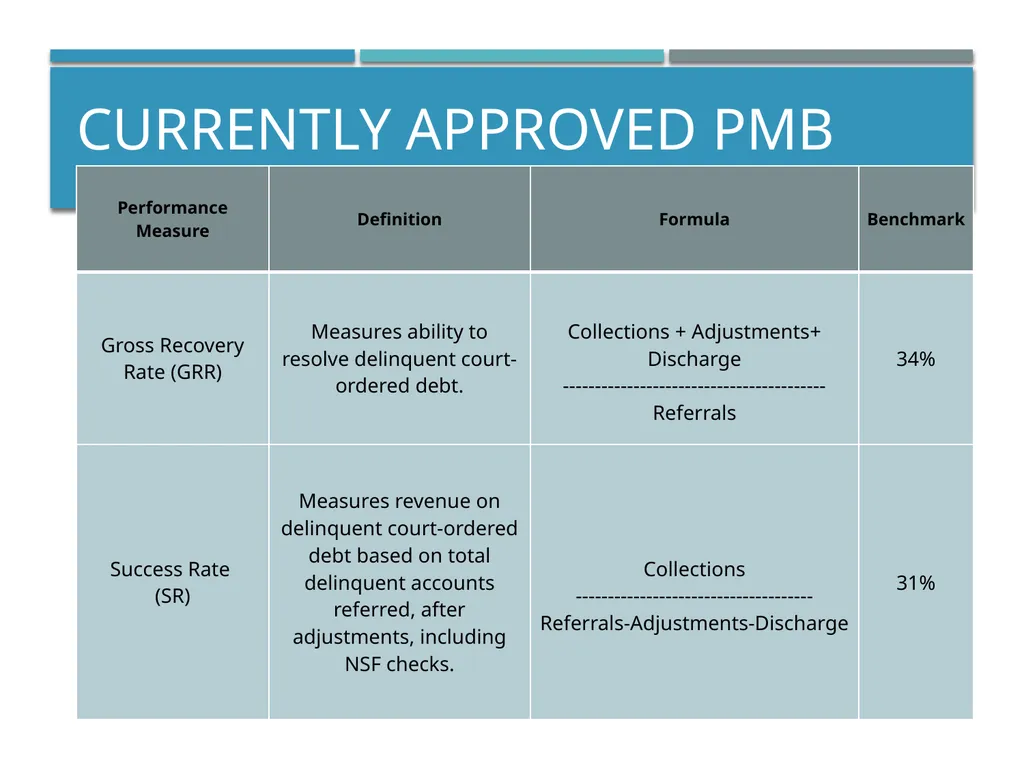
slide5. Currently Approved PMB<br>
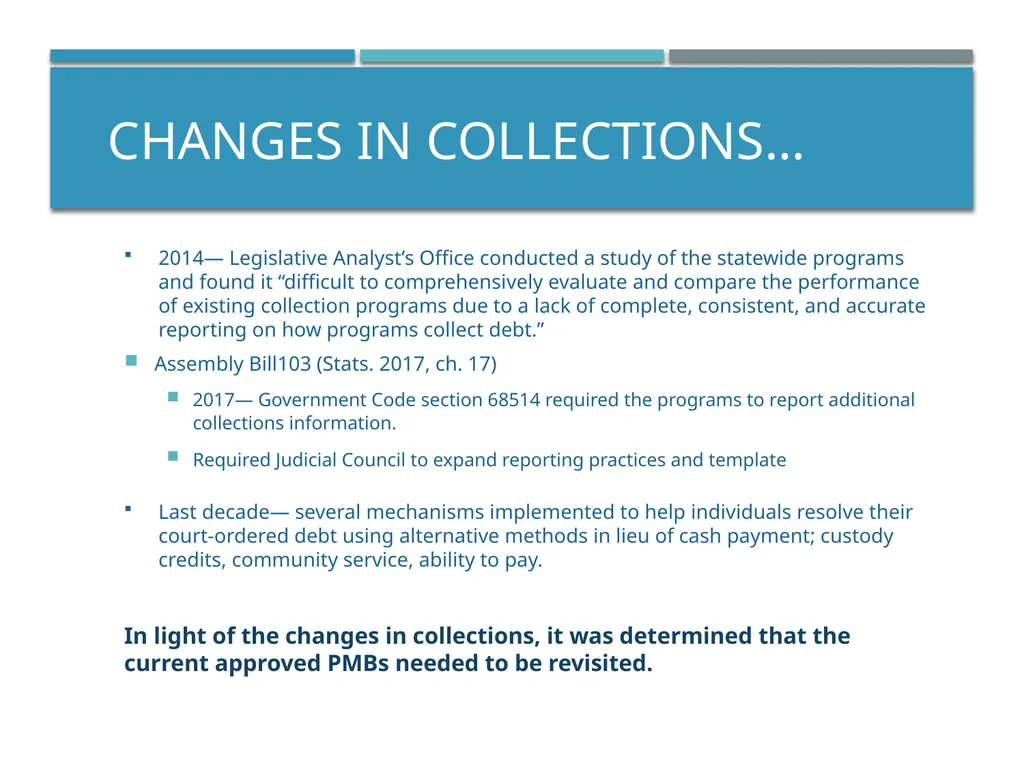
slide6. Changes in collections… 2014— Legislative Analyst’s Office conducted a study of the statewide programs and found it “difficult to comprehensively evaluate and compare the performance of existing collection programs due to a lack of complete, consistent, and accurate reporting on how programs collect debt.”
Assembly Bill103 (Stats. 2017, ch. 17)
2017— Government Code section 68514 required the programs to report additional collections information.
Required Judicial Council to expand reporting practices and template
Last decade— several mechanisms implemented to help individuals resolve their court-ordered debt using alternative methods in lieu of cash payment; custody credits, community service, ability to pay.
In light of the changes in collections, it was determined that the current approved PMBs needed to be revisited.<br>
slide7. How were the PMBs developed 7<br>
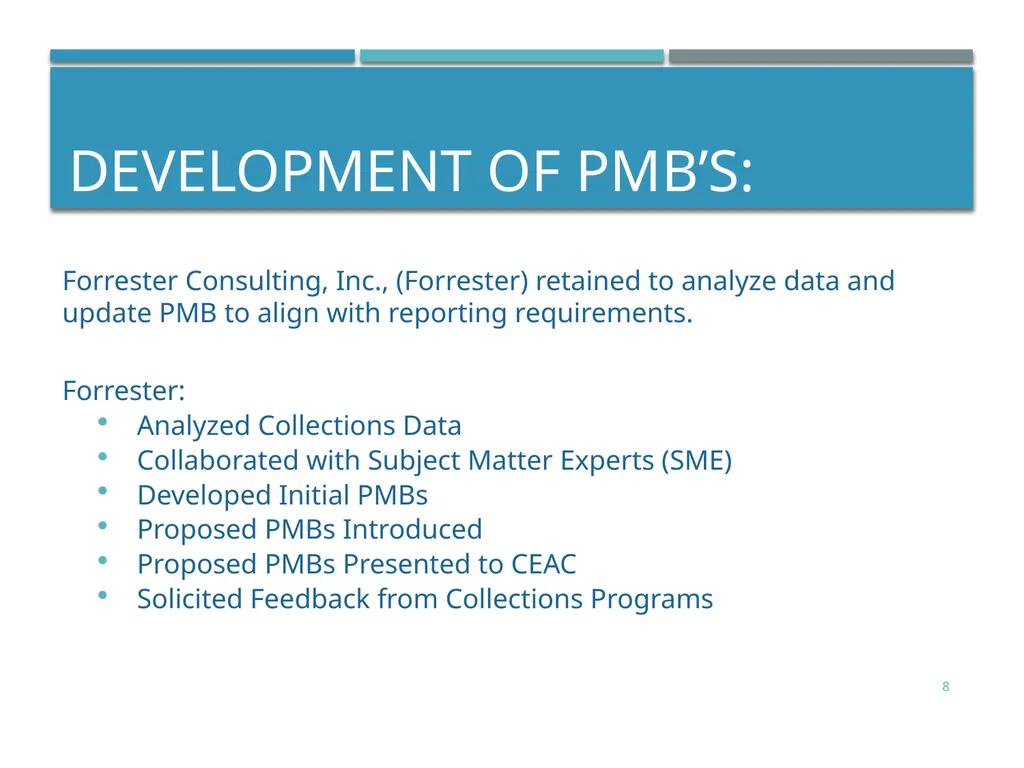
slide8. Development of PMB’s: Forrester Consulting, Inc., (Forrester) retained to analyze data and update PMB to align with reporting requirements.
Forrester:
Analyzed Collections Data
Collaborated with Subject Matter Experts (SME)
Developed Initial PMBs
Proposed PMBs Introduced
Proposed PMBs Presented to CEAC
Solicited Feedback from Collections Programs 8<br>
slide9. Subject matter Experts 9<br>
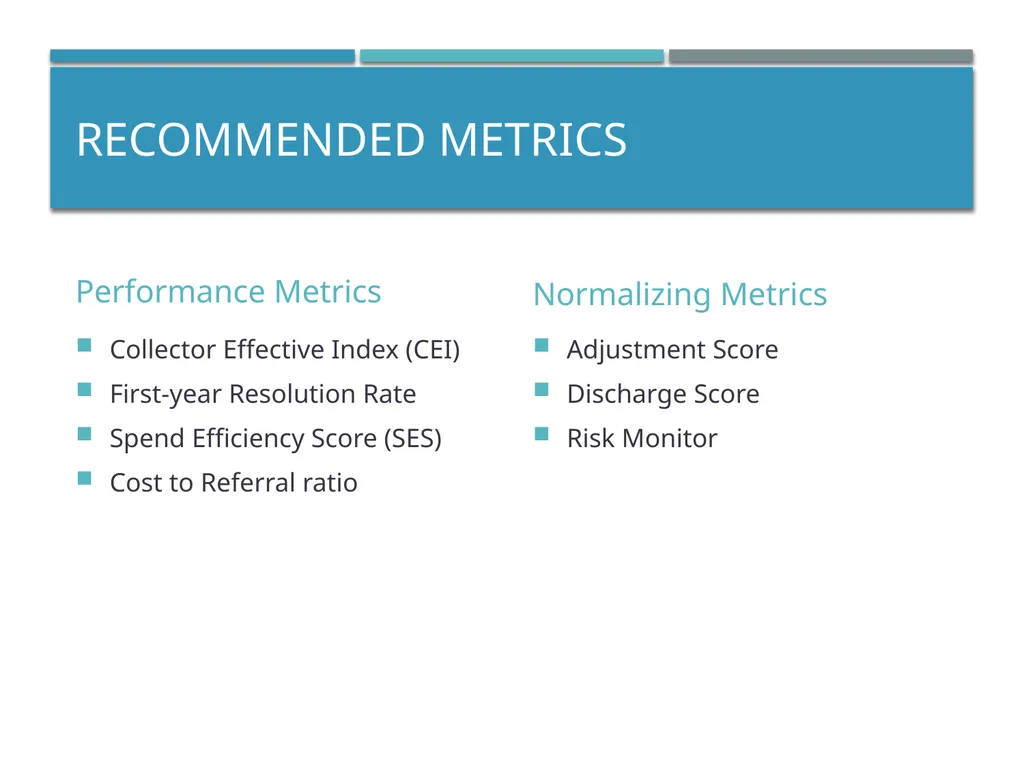
slide10. Recommended Metrics Performance Metrics Collector Effective Index (CEI)
First-year Resolution Rate
Spend Efficiency Score (SES)
Cost to Referral ratio Normalizing Metrics Adjustment Score
Discharge Score
Risk Monitor 10<br>
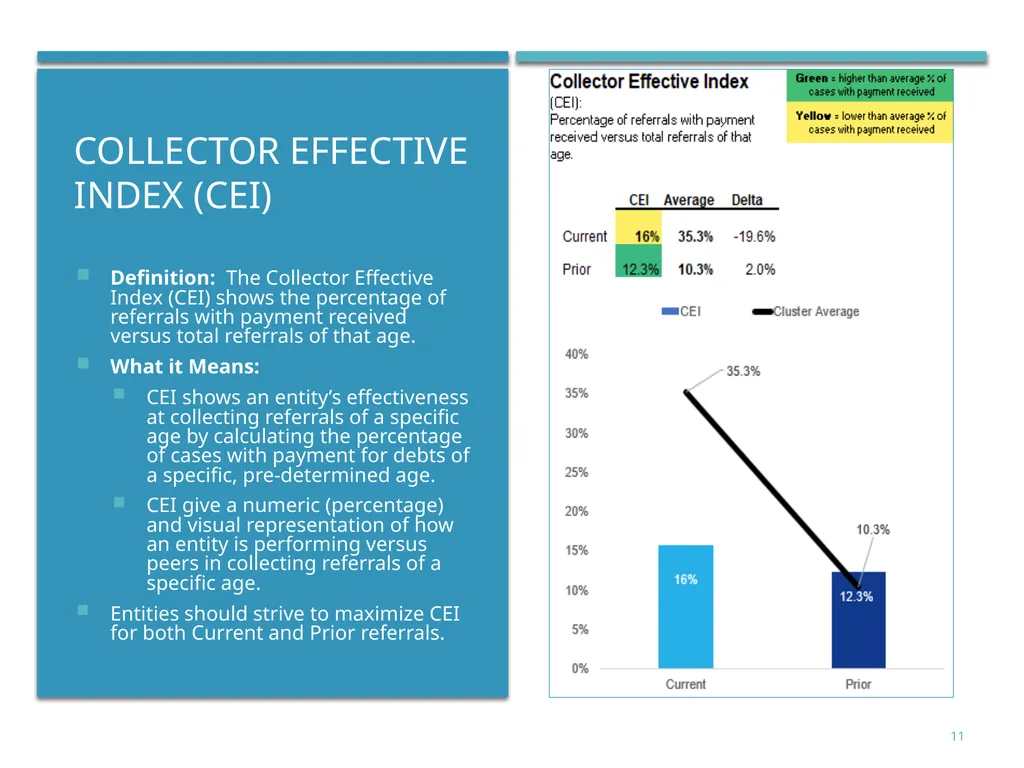
slide11. Collector Effective Index (CEI) Definition: The Collector Effective Index (CEI) shows the percentage of referrals with payment received versus total referrals of that age.
What it Means:
CEI shows an entity’s effectiveness at collecting referrals of a specific age by calculating the percentage of cases with payment for debts of a specific, pre-determined age.
CEI give a numeric (percentage) and visual representation of how an entity is performing versus peers in collecting referrals of a specific age.
Entities should strive to maximize CEI for both Current and Prior referrals. 11<br>
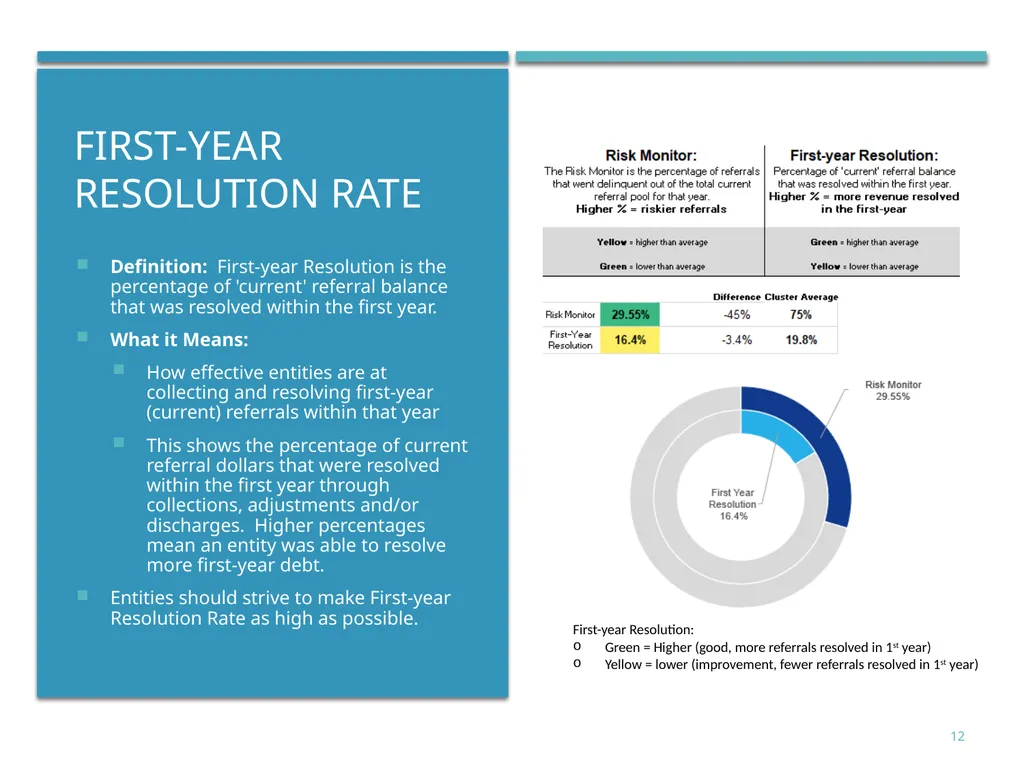
slide12. First-Year resolution rate Definition: First-year Resolution is the percentage of 'current' referral balance that was resolved within the first year.
What it Means:
How effective entities are at collecting and resolving first-year (current) referrals within that year
This shows the percentage of current referral dollars that were resolved within the first year through collections, adjustments and/or discharges. Higher percentages mean an entity was able to resolve more first-year debt.
Entities should strive to make First-year Resolution Rate as high as possible. 12 First-year Resolution:
Green = Higher (good, more referrals resolved in 1st year)
Yellow = lower (improvement, fewer referrals resolved in 1st year)<br>
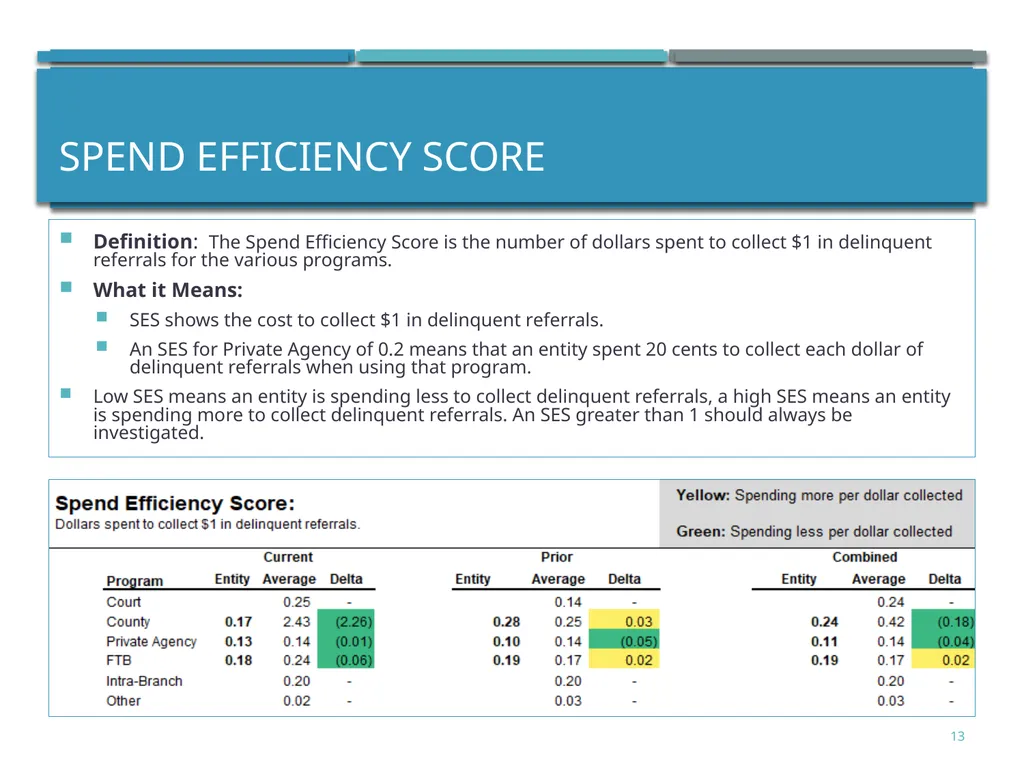
slide13. Spend Efficiency Score Definition: The Spend Efficiency Score is the number of dollars spent to collect $1 in delinquent referrals for the various programs.
What it Means:
SES shows the cost to collect $1 in delinquent referrals.
An SES for Private Agency of 0.2 means that an entity spent 20 cents to collect each dollar of delinquent referrals when using that program.
Low SES means an entity is spending less to collect delinquent referrals, a high SES means an entity is spending more to collect delinquent referrals. An SES greater than 1 should always be investigated. 13<br>
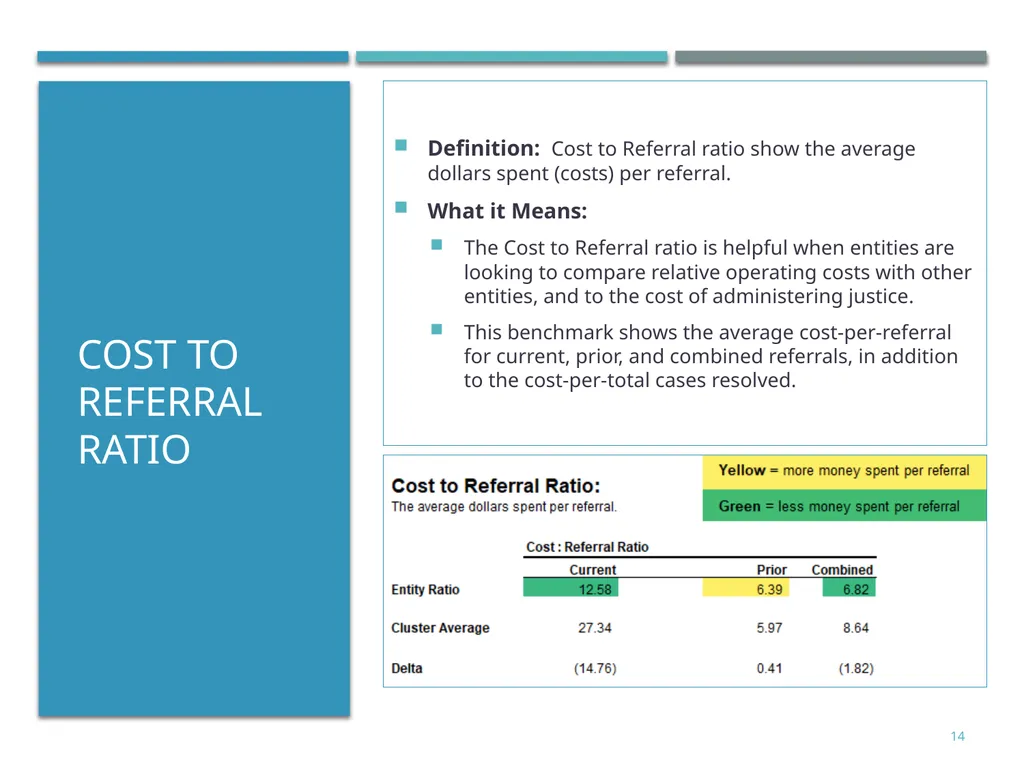
slide14. Cost to referral ratio Definition: Cost to Referral ratio show the average dollars spent (costs) per referral.
What it Means:
The Cost to Referral ratio is helpful when entities are looking to compare relative operating costs with other entities, and to the cost of administering justice.
This benchmark shows the average cost-per-referral for current, prior, and combined referrals, in addition to the cost-per-total cases resolved. 14<br>
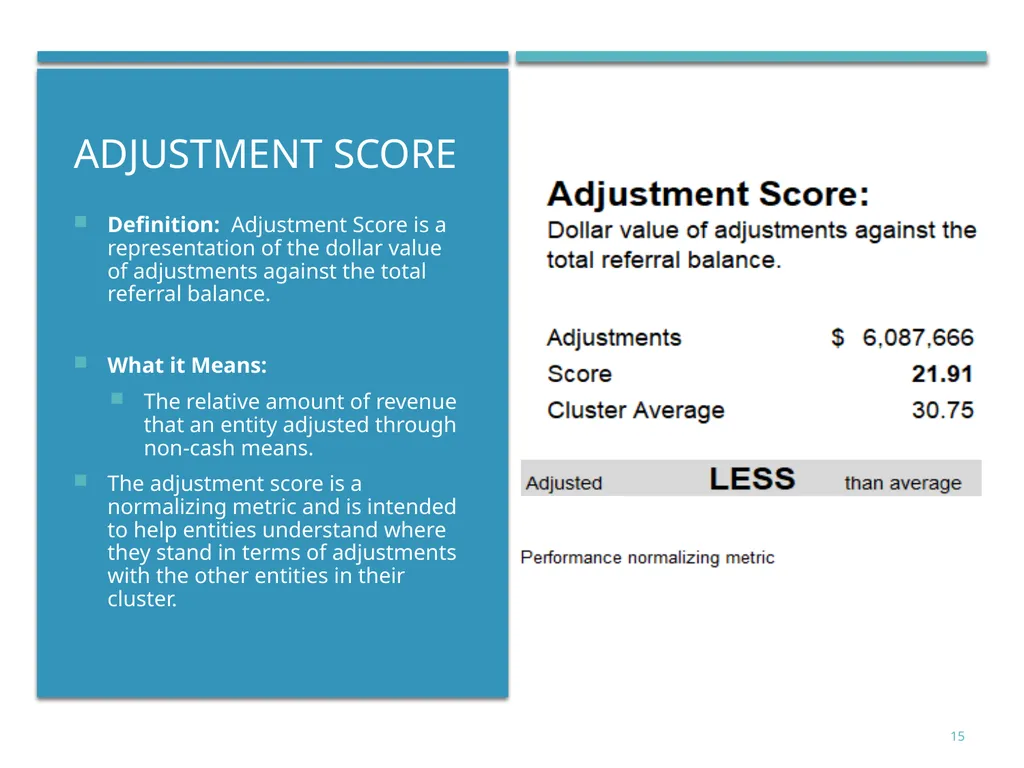
slide15. Adjustment score Definition: Adjustment Score is a representation of the dollar value of adjustments against the total referral balance.
What it Means:
The relative amount of revenue that an entity adjusted through non-cash means.
The adjustment score is a normalizing metric and is intended to help entities understand where they stand in terms of adjustments with the other entities in their cluster. 15<br>
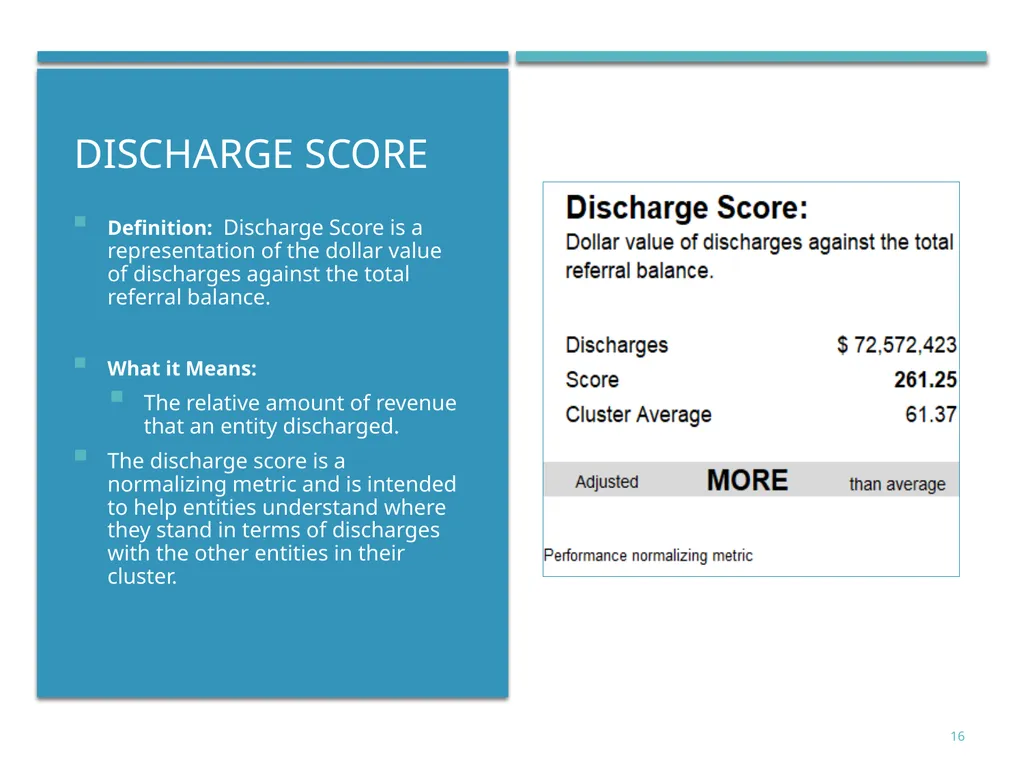
slide16. Discharge score Definition: Discharge Score is a representation of the dollar value of discharges against the total referral balance.
What it Means:
The relative amount of revenue that an entity discharged.
The discharge score is a normalizing metric and is intended to help entities understand where they stand in terms of discharges with the other entities in their cluster. 16<br>
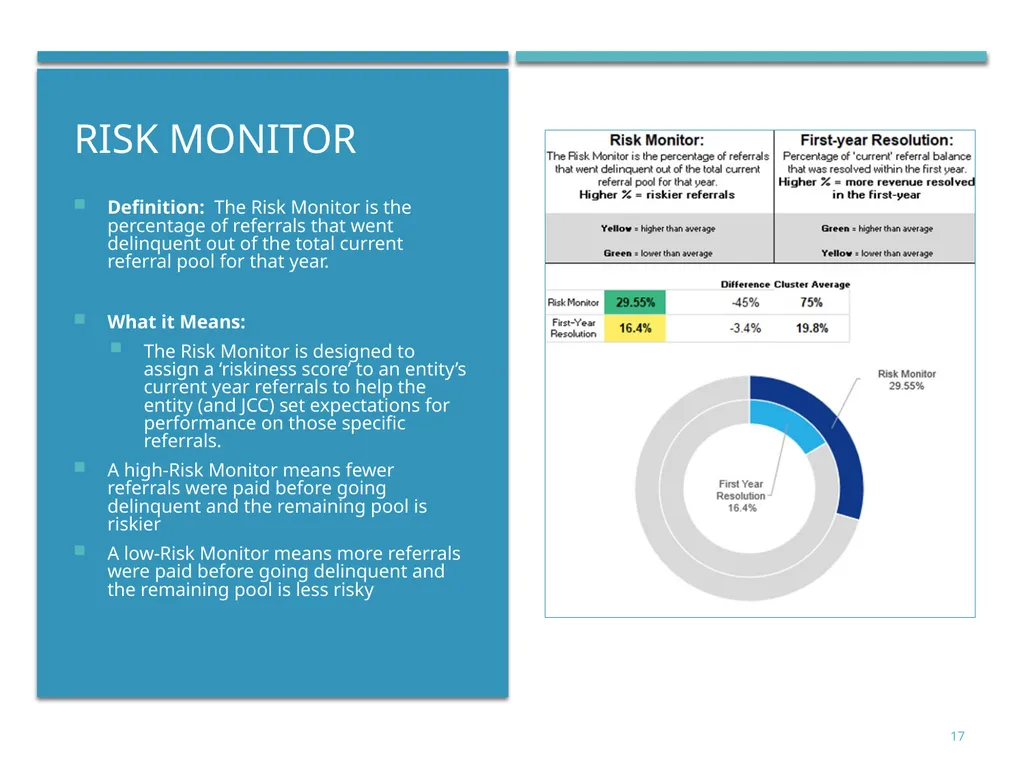
slide17. Risk monitor Definition: The Risk Monitor is the percentage of referrals that went delinquent out of the total current referral pool for that year.
What it Means:
The Risk Monitor is designed to assign a ‘riskiness score’ to an entity’s current year referrals to help the entity (and JCC) set expectations for performance on those specific referrals.
A high-Risk Monitor means fewer referrals were paid before going delinquent and the remaining pool is riskier
A low-Risk Monitor means more referrals were paid before going delinquent and the remaining pool is less risky 17<br>

slide18. Dashboard<br>
slide19. Questions/Discussion 19<br>
slide2. Delinquent Court Ordered Debt Court-ordered debt can be processed by one or more of these programs:
58 court/county programs
13 private collection agencies
2 Franchise Tax Board programs (COD and IIC)
2 Intra-branch programs (Ventura Court, Shasta Court)
Until paid in full or discharged from accountability deemed uncollectible 2<br>
slide3. Performance Measures and Benchmarks (PMB) 3<br>
slide4. Why are PMBs needed? 4<br>
slide5. Currently Approved PMB<br>
slide6. Changes in collections… 2014— Legislative Analyst’s Office conducted a study of the statewide programs and found it “difficult to comprehensively evaluate and compare the performance of existing collection programs due to a lack of complete, consistent, and accurate reporting on how programs collect debt.”
Assembly Bill103 (Stats. 2017, ch. 17)
2017— Government Code section 68514 required the programs to report additional collections information.
Required Judicial Council to expand reporting practices and template
Last decade— several mechanisms implemented to help individuals resolve their court-ordered debt using alternative methods in lieu of cash payment; custody credits, community service, ability to pay.
In light of the changes in collections, it was determined that the current approved PMBs needed to be revisited.<br>
slide7. How were the PMBs developed 7<br>
slide8. Development of PMB’s: Forrester Consulting, Inc., (Forrester) retained to analyze data and update PMB to align with reporting requirements.
Forrester:
Analyzed Collections Data
Collaborated with Subject Matter Experts (SME)
Developed Initial PMBs
Proposed PMBs Introduced
Proposed PMBs Presented to CEAC
Solicited Feedback from Collections Programs 8<br>
slide9. Subject matter Experts 9<br>
slide10. Recommended Metrics Performance Metrics Collector Effective Index (CEI)
First-year Resolution Rate
Spend Efficiency Score (SES)
Cost to Referral ratio Normalizing Metrics Adjustment Score
Discharge Score
Risk Monitor 10<br>
slide11. Collector Effective Index (CEI) Definition: The Collector Effective Index (CEI) shows the percentage of referrals with payment received versus total referrals of that age.
What it Means:
CEI shows an entity’s effectiveness at collecting referrals of a specific age by calculating the percentage of cases with payment for debts of a specific, pre-determined age.
CEI give a numeric (percentage) and visual representation of how an entity is performing versus peers in collecting referrals of a specific age.
Entities should strive to maximize CEI for both Current and Prior referrals. 11<br>
slide12. First-Year resolution rate Definition: First-year Resolution is the percentage of 'current' referral balance that was resolved within the first year.
What it Means:
How effective entities are at collecting and resolving first-year (current) referrals within that year
This shows the percentage of current referral dollars that were resolved within the first year through collections, adjustments and/or discharges. Higher percentages mean an entity was able to resolve more first-year debt.
Entities should strive to make First-year Resolution Rate as high as possible. 12 First-year Resolution:
Green = Higher (good, more referrals resolved in 1st year)
Yellow = lower (improvement, fewer referrals resolved in 1st year)<br>
slide13. Spend Efficiency Score Definition: The Spend Efficiency Score is the number of dollars spent to collect $1 in delinquent referrals for the various programs.
What it Means:
SES shows the cost to collect $1 in delinquent referrals.
An SES for Private Agency of 0.2 means that an entity spent 20 cents to collect each dollar of delinquent referrals when using that program.
Low SES means an entity is spending less to collect delinquent referrals, a high SES means an entity is spending more to collect delinquent referrals. An SES greater than 1 should always be investigated. 13<br>
slide14. Cost to referral ratio Definition: Cost to Referral ratio show the average dollars spent (costs) per referral.
What it Means:
The Cost to Referral ratio is helpful when entities are looking to compare relative operating costs with other entities, and to the cost of administering justice.
This benchmark shows the average cost-per-referral for current, prior, and combined referrals, in addition to the cost-per-total cases resolved. 14<br>
slide15. Adjustment score Definition: Adjustment Score is a representation of the dollar value of adjustments against the total referral balance.
What it Means:
The relative amount of revenue that an entity adjusted through non-cash means.
The adjustment score is a normalizing metric and is intended to help entities understand where they stand in terms of adjustments with the other entities in their cluster. 15<br>
slide16. Discharge score Definition: Discharge Score is a representation of the dollar value of discharges against the total referral balance.
What it Means:
The relative amount of revenue that an entity discharged.
The discharge score is a normalizing metric and is intended to help entities understand where they stand in terms of discharges with the other entities in their cluster. 16<br>
slide17. Risk monitor Definition: The Risk Monitor is the percentage of referrals that went delinquent out of the total current referral pool for that year.
What it Means:
The Risk Monitor is designed to assign a ‘riskiness score’ to an entity’s current year referrals to help the entity (and JCC) set expectations for performance on those specific referrals.
A high-Risk Monitor means fewer referrals were paid before going delinquent and the remaining pool is riskier
A low-Risk Monitor means more referrals were paid before going delinquent and the remaining pool is less risky 17<br>
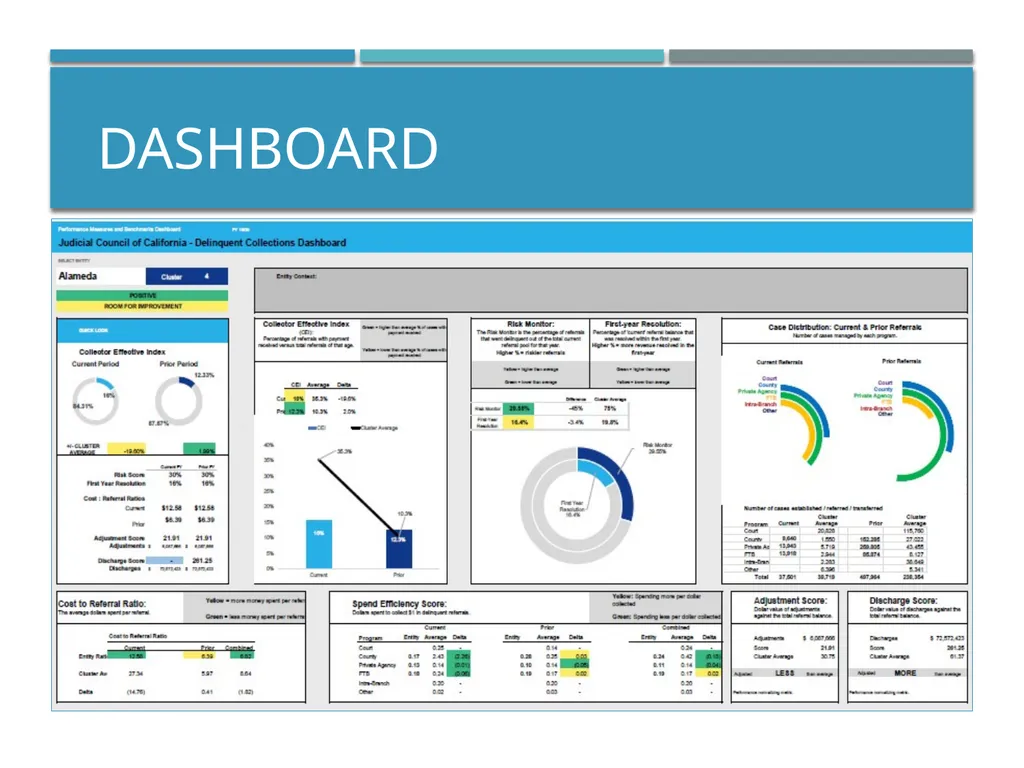
slide18. Dashboard<br>
slide19. Questions/Discussion 19<br>