
Data Analysis and Interpretation May 2021 To build
JO
Published · 54 slides · 0 views
1 / 1



Description
Data Analysis and Interpretation May 2021 To build the capacity of Ugandas Ministry of Gender Labour and Social Development (MGLD) staff and District Probation and Social Welfare Officers (PSWOs) on data analysis and interpretation Purpose
Related Topics
Share
Embed code
Download this presentation From Below
"Data Analysis and Interpretation May 2021 To build" is the property of its rightful owner. Permission is granted to download and print the materials on this website for personal, non-commercial use only, and to display it on your personal computer provided you do not modify the materials and that you retain all copyright notices contained in the materials. By downloading content from our website, you accept the terms of this agreement.
Presentation Transcript
01
Data Analysis and Interpretation
May 2021<br>
May 2021<br>
02
To build the capacity of Uganda’s Ministry of Gender Labour and Social Development (MGLD) staff and District Probation and Social Welfare Officers (PSWOs) on data analysis and interpretation Purpose of the training<br>
03
By the end of the session, participants will be able to:
Understand the definition and purpose of data analysis
Understand basics of data analysis and interpretation
Apply the skills to analyse and interpret alternative care data Learning objectives<br>
Understand the definition and purpose of data analysis
Understand basics of data analysis and interpretation
Apply the skills to analyse and interpret alternative care data Learning objectives<br>
04
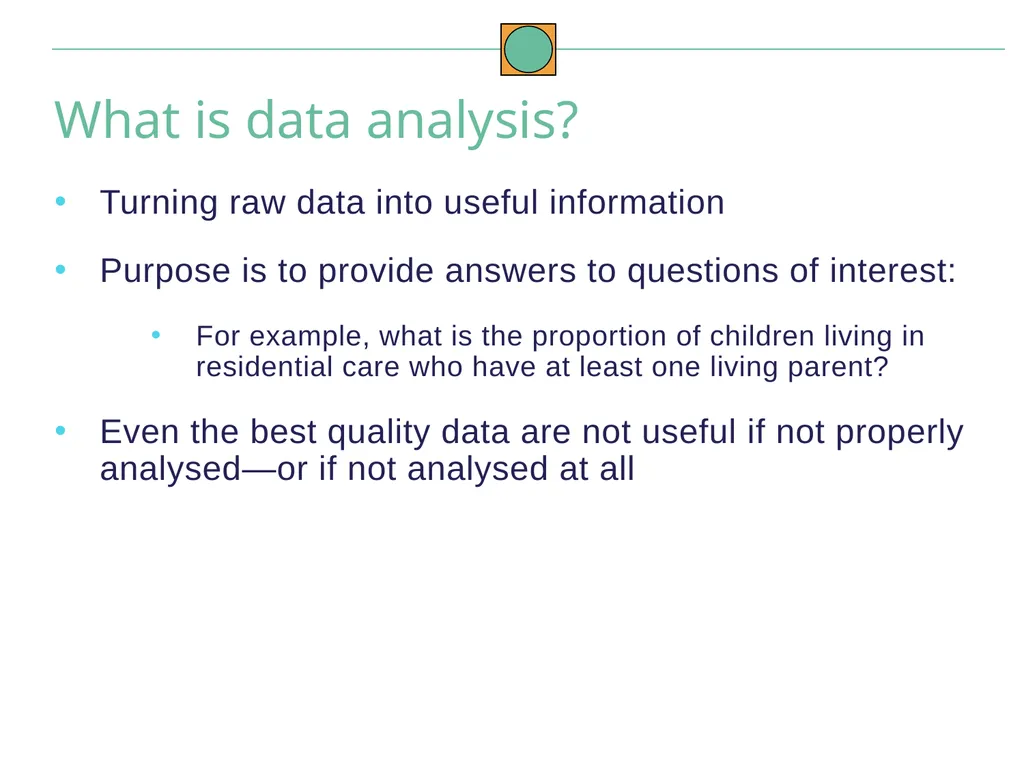
Turning raw data into useful information
Purpose is to provide answers to questions of interest:
For example, what is the proportion of children living in residential care who have at least one living parent?
Even the best quality data are not useful if not properly analysed—or if not analysed at all What is data analysis?<br>
Purpose is to provide answers to questions of interest:
For example, what is the proportion of children living in residential care who have at least one living parent?
Even the best quality data are not useful if not properly analysed—or if not analysed at all What is data analysis?<br>
05
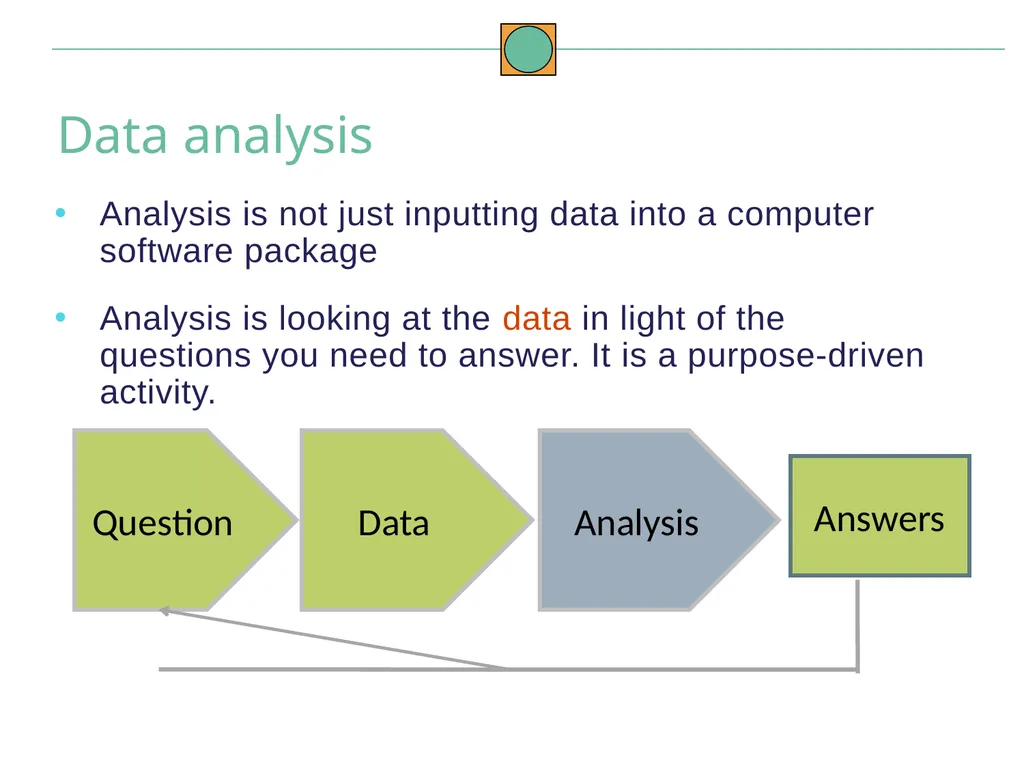
Analysis is not just inputting data into a computer software package
Analysis is looking at the data in light of the questions you need to answer. It is a purpose-driven activity. Data analysis<br>
Analysis is looking at the data in light of the questions you need to answer. It is a purpose-driven activity. Data analysis<br>
06
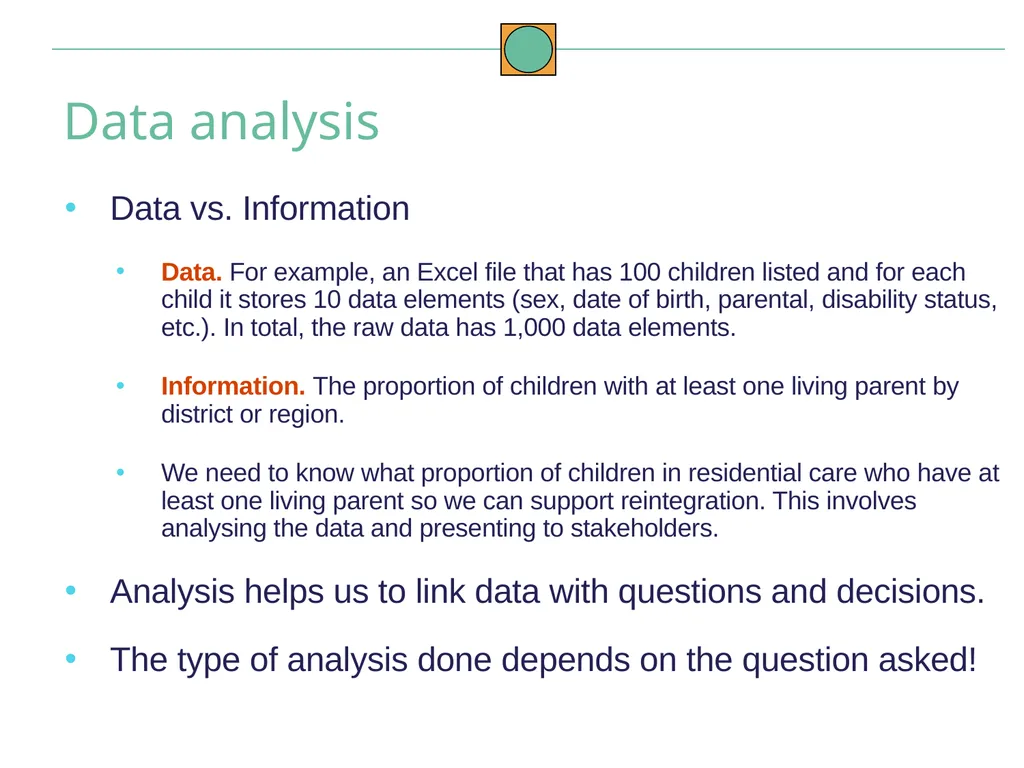
Data vs. Information
Data. For example, an Excel file that has 100 children listed and for each child it stores 10 data elements (sex, date of birth, parental, disability status, etc.). In total, the raw data has 1,000 data elements.
Information. The proportion of children with at least one living parent by district or region.
We need to know what proportion of children in residential care who have at least one living parent so we can support reintegration. This involves analysing the data and presenting to stakeholders.
Analysis helps us to link data with questions and decisions.
The type of analysis done depends on the question asked! Data analysis<br>
Data. For example, an Excel file that has 100 children listed and for each child it stores 10 data elements (sex, date of birth, parental, disability status, etc.). In total, the raw data has 1,000 data elements.
Information. The proportion of children with at least one living parent by district or region.
We need to know what proportion of children in residential care who have at least one living parent so we can support reintegration. This involves analysing the data and presenting to stakeholders.
Analysis helps us to link data with questions and decisions.
The type of analysis done depends on the question asked! Data analysis<br>
07
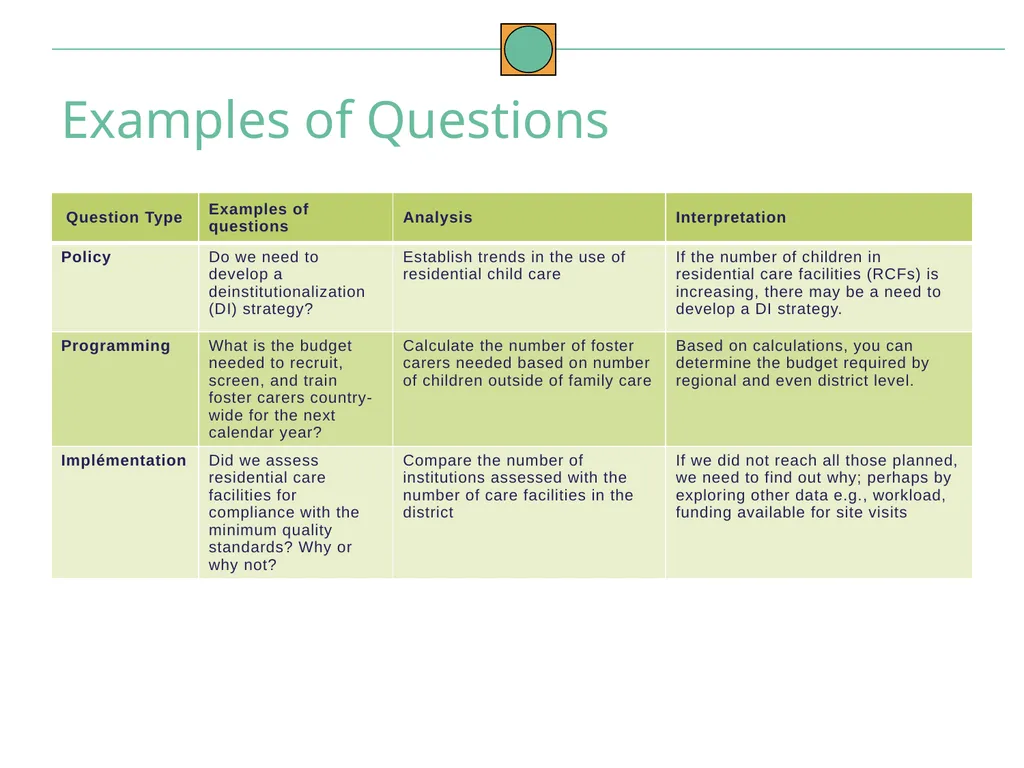
Examples of Questions<br>
08
Statistical terms and types of data analysis<br>
09
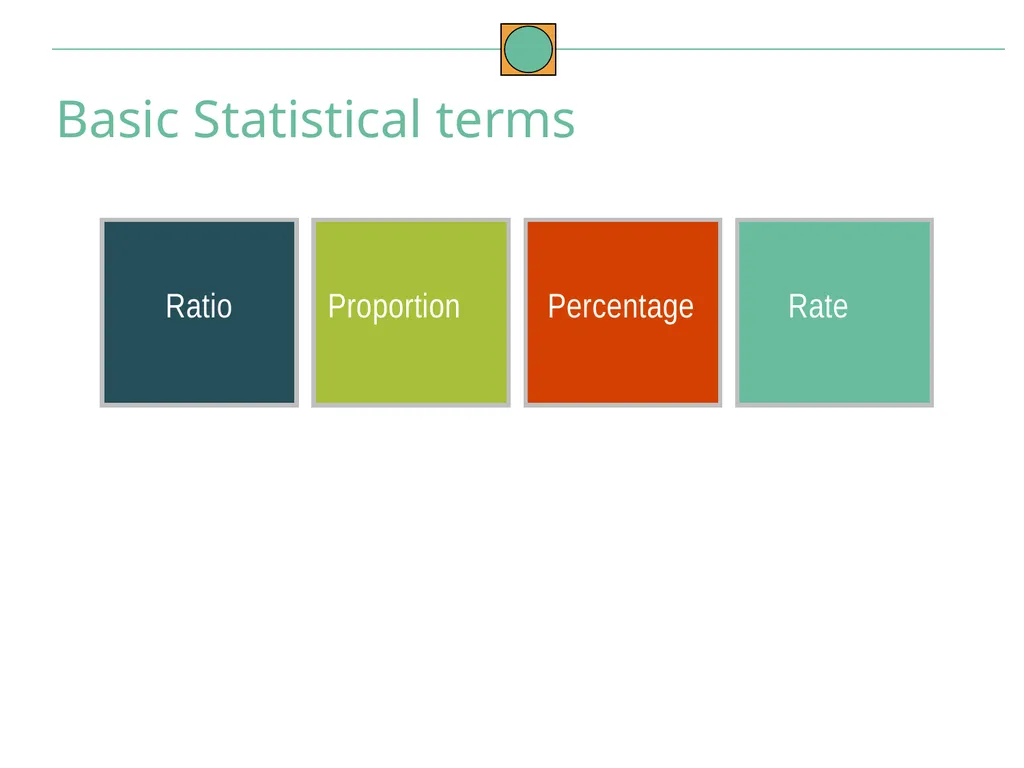
Basic Statistical terms Ratio Proportion Percentage Rate<br>
10
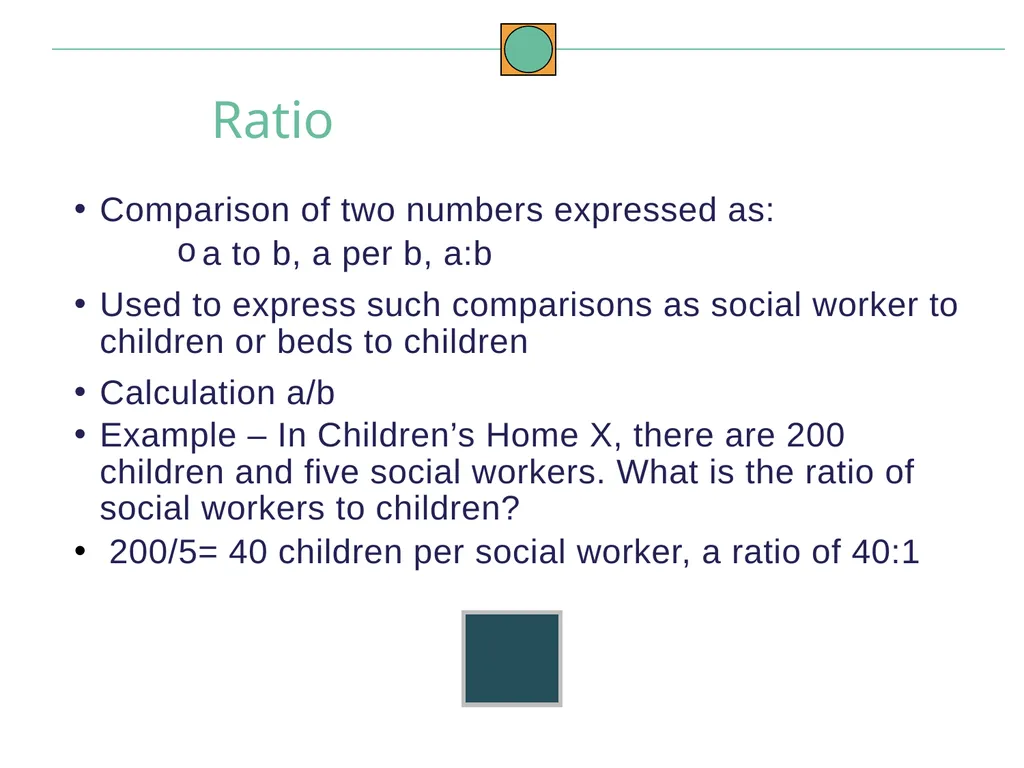
Ratio Comparison of two numbers expressed as:
a to b, a per b, a:b
Used to express such comparisons as social worker to children or beds to children
Calculation a/b
Example – In Children’s Home X, there are 200 children and five social workers. What is the ratio of social workers to children?
200/5= 40 children per social worker, a ratio of 40:1<br>
a to b, a per b, a:b
Used to express such comparisons as social worker to children or beds to children
Calculation a/b
Example – In Children’s Home X, there are 200 children and five social workers. What is the ratio of social workers to children?
200/5= 40 children per social worker, a ratio of 40:1<br>
11
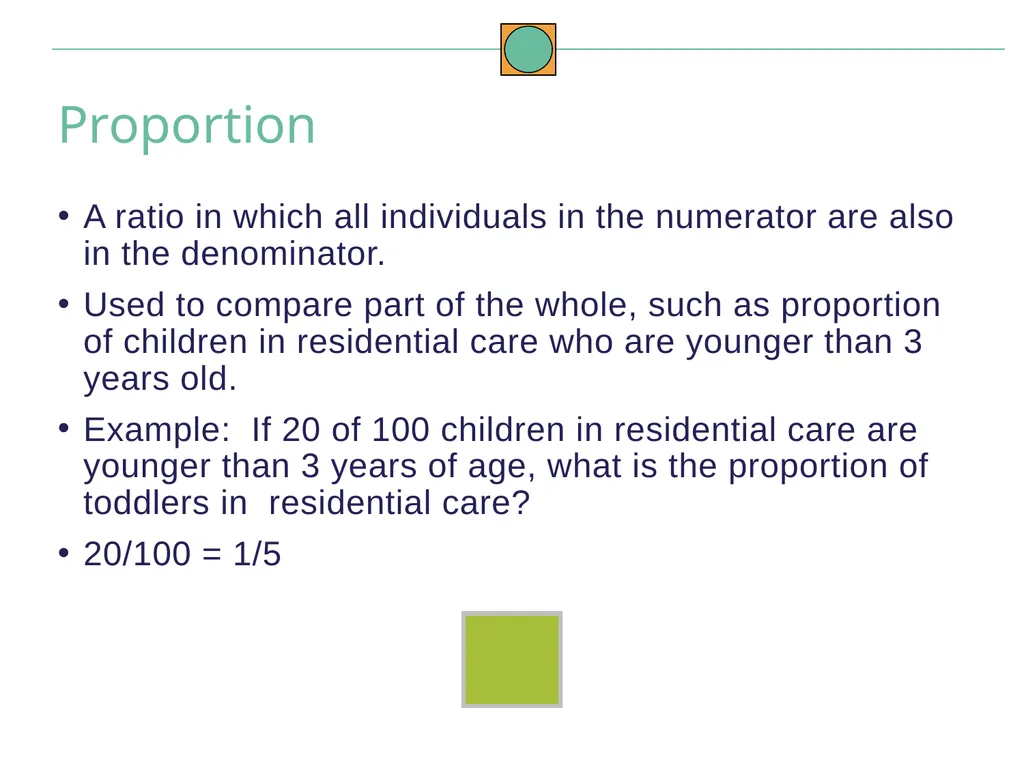
A ratio in which all individuals in the numerator are also in the denominator.
Used to compare part of the whole, such as proportion of children in residential care who are younger than 3 years old.
Example: If 20 of 100 children in residential care are younger than 3 years of age, what is the proportion of toddlers in residential care?
20/100 = 1/5 Proportion<br>
Used to compare part of the whole, such as proportion of children in residential care who are younger than 3 years old.
Example: If 20 of 100 children in residential care are younger than 3 years of age, what is the proportion of toddlers in residential care?
20/100 = 1/5 Proportion<br>
12
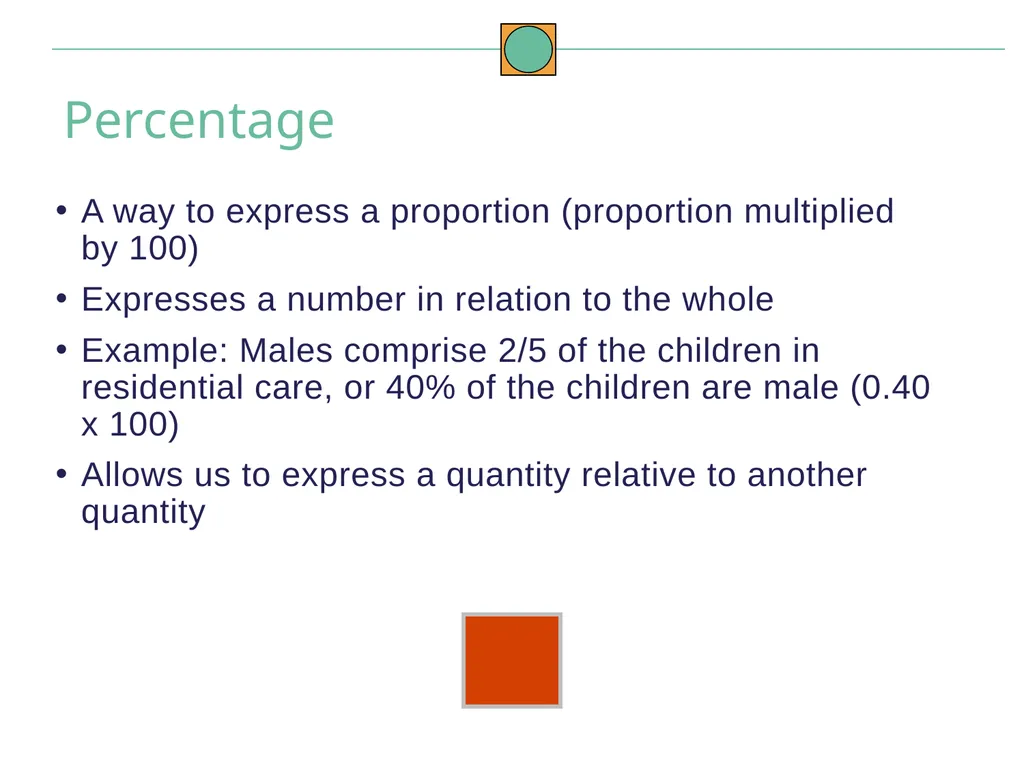
A way to express a proportion (proportion multiplied by 100)
Expresses a number in relation to the whole
Example: Males comprise 2/5 of the children in residential care, or 40% of the children are male (0.40 x 100)
Allows us to express a quantity relative to another quantity Percentage<br>
Expresses a number in relation to the whole
Example: Males comprise 2/5 of the children in residential care, or 40% of the children are male (0.40 x 100)
Allows us to express a quantity relative to another quantity Percentage<br>
13
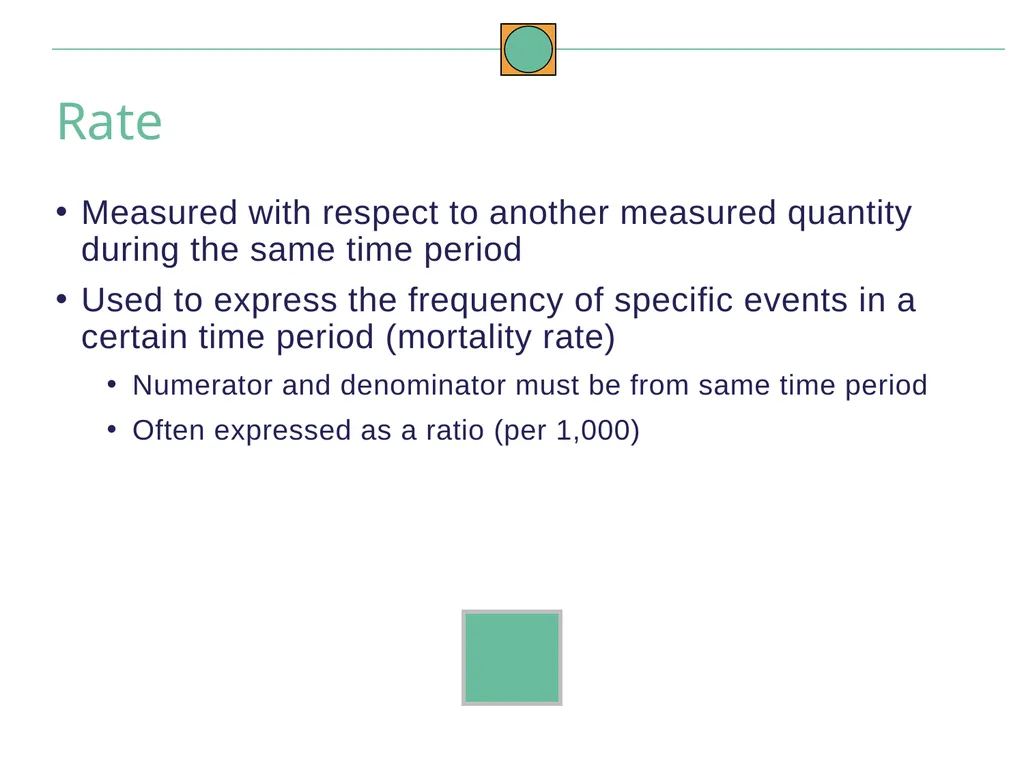
Measured with respect to another measured quantity during the same time period
Used to express the frequency of specific events in a certain time period (mortality rate)
Numerator and denominator must be from same time period
Often expressed as a ratio (per 1,000) Rate<br>
Used to express the frequency of specific events in a certain time period (mortality rate)
Numerator and denominator must be from same time period
Often expressed as a ratio (per 1,000) Rate<br>
14
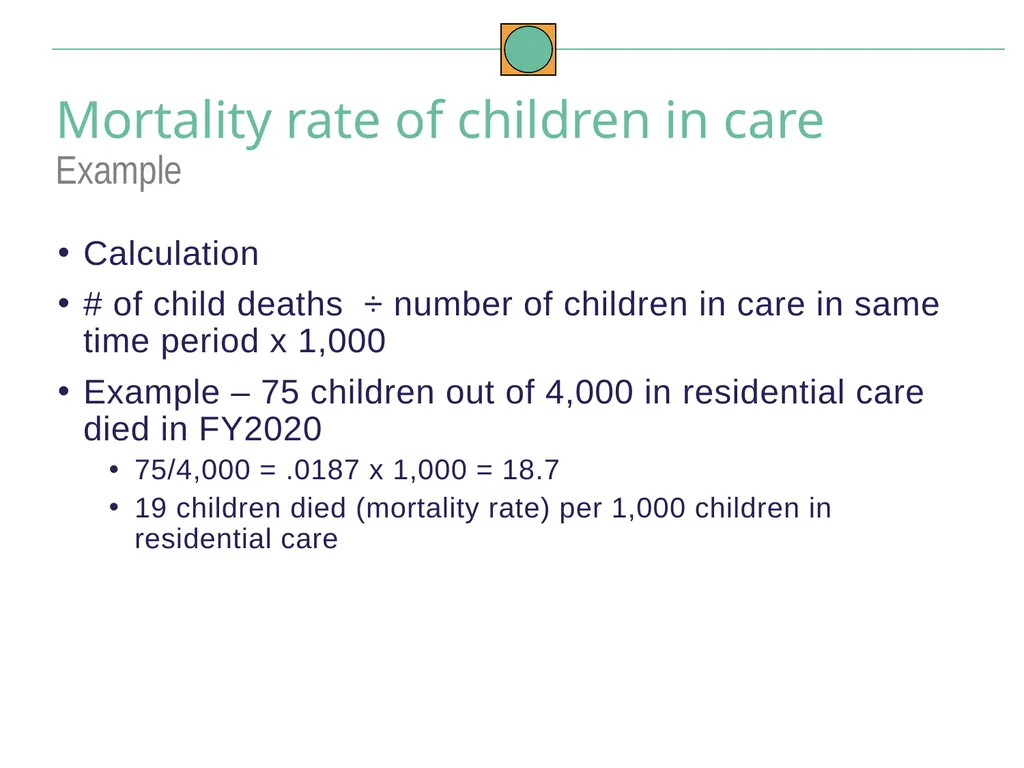
Calculation
# of child deaths ÷ number of children in care in same time period x 1,000
Example – 75 children out of 4,000 in residential care died in FY2020
75/4,000 = .0187 x 1,000 = 18.7
19 children died (mortality rate) per 1,000 children in residential care Mortality rate of children in care Example<br>
# of child deaths ÷ number of children in care in same time period x 1,000
Example – 75 children out of 4,000 in residential care died in FY2020
75/4,000 = .0187 x 1,000 = 18.7
19 children died (mortality rate) per 1,000 children in residential care Mortality rate of children in care Example<br>
15
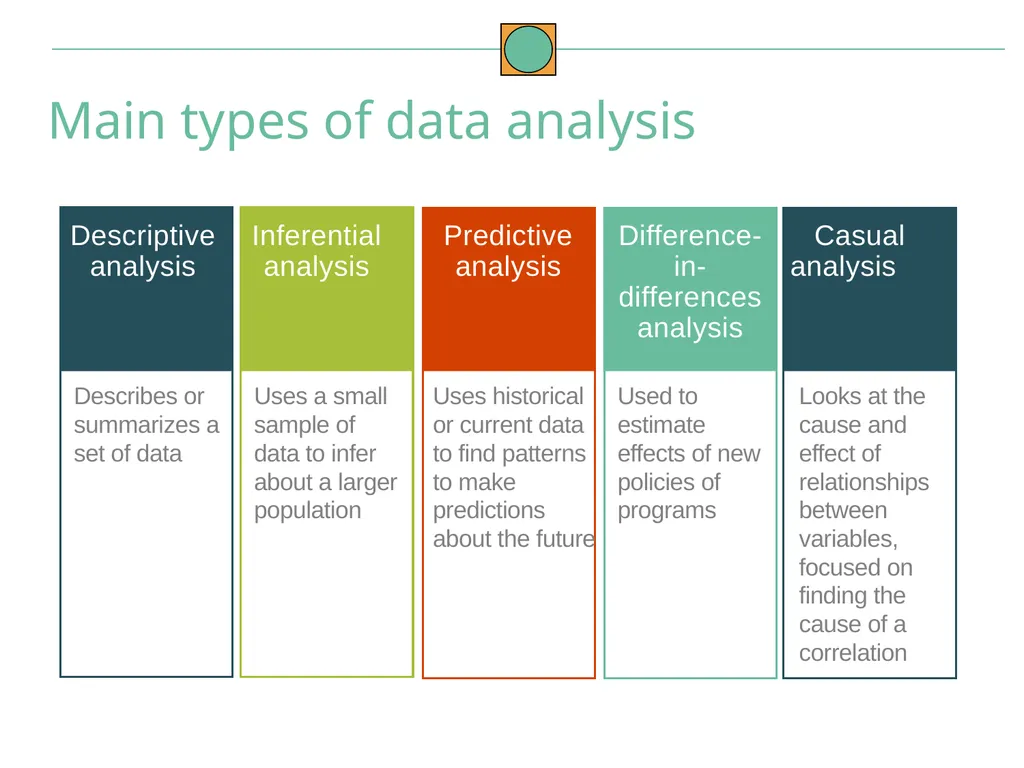
Main types of data analysis Descriptive analysis Inferential analysis Predictive analysis Difference-in-differences analysis Casual analysis Describes or
summarizes a set of data Uses a small sample of data to infer about a larger population Uses historical or current data to find patterns to make predictions about the future Used to estimate effects of new policies of programs Looks at the cause and effect of relationships between variables, focused on finding the cause of a correlation<br>
summarizes a set of data Uses a small sample of data to infer about a larger population Uses historical or current data to find patterns to make predictions about the future Used to estimate effects of new policies of programs Looks at the cause and effect of relationships between variables, focused on finding the cause of a correlation<br>
16
After data cleaning, the descriptive data analysis tells us:
What the data look like
The relationships between the different variables
How people or other units of analysis compare with each other
Descriptive data analysis does not define causality – it tells you what, not why. Descriptive data analysis<br>
What the data look like
The relationships between the different variables
How people or other units of analysis compare with each other
Descriptive data analysis does not define causality – it tells you what, not why. Descriptive data analysis<br>
17
Two set of descriptive measures:
Measures of central tendency: Used to report a single piece of information that describes the most typical response to a question
Measures of variability: Used to reveal typical differences between the values in a set of values Descriptive data analysis<br>
Measures of central tendency: Used to report a single piece of information that describes the most typical response to a question
Measures of variability: Used to reveal typical differences between the values in a set of values Descriptive data analysis<br>
18
Measures of central tendency:
Mode: The value in a string of numbers that occurs most often
Mean: The average value characterizing a set of numbers
Median: The value whose occurrence lies in the middle of a set of ordered values Descriptive data analysis<br>
Mode: The value in a string of numbers that occurs most often
Mean: The average value characterizing a set of numbers
Median: The value whose occurrence lies in the middle of a set of ordered values Descriptive data analysis<br>
19
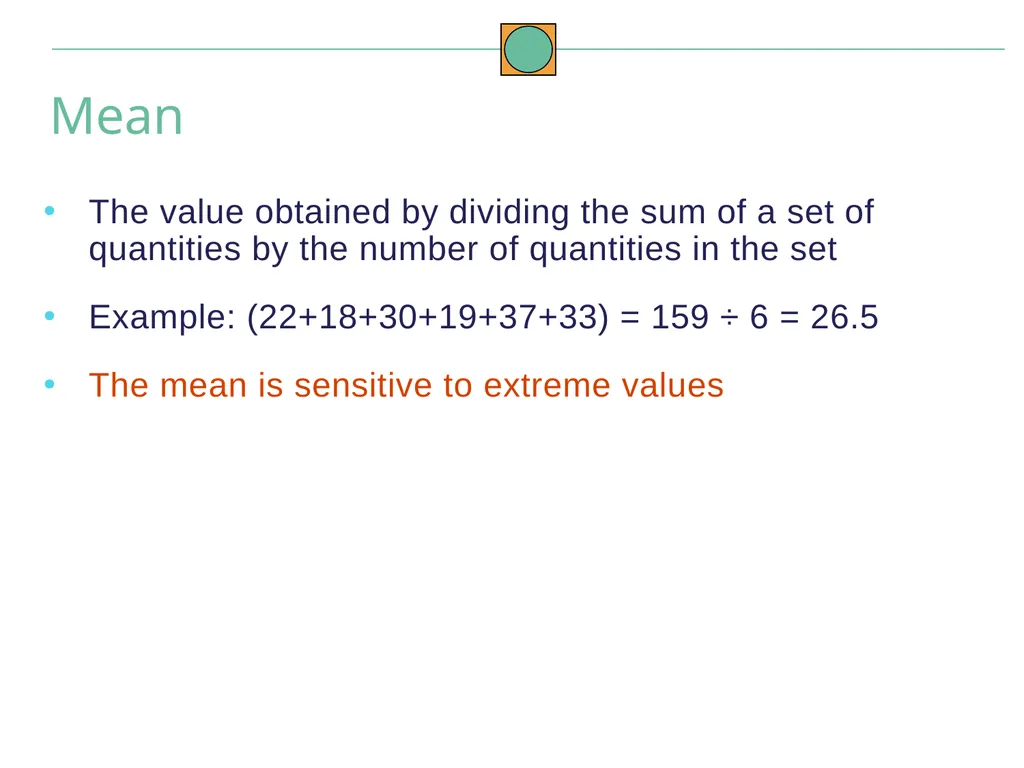
The value obtained by dividing the sum of a set of quantities by the number of quantities in the set
Example: (22+18+30+19+37+33) = 159 ÷ 6 = 26.5
The mean is sensitive to extreme values Mean<br>
Example: (22+18+30+19+37+33) = 159 ÷ 6 = 26.5
The mean is sensitive to extreme values Mean<br>
20
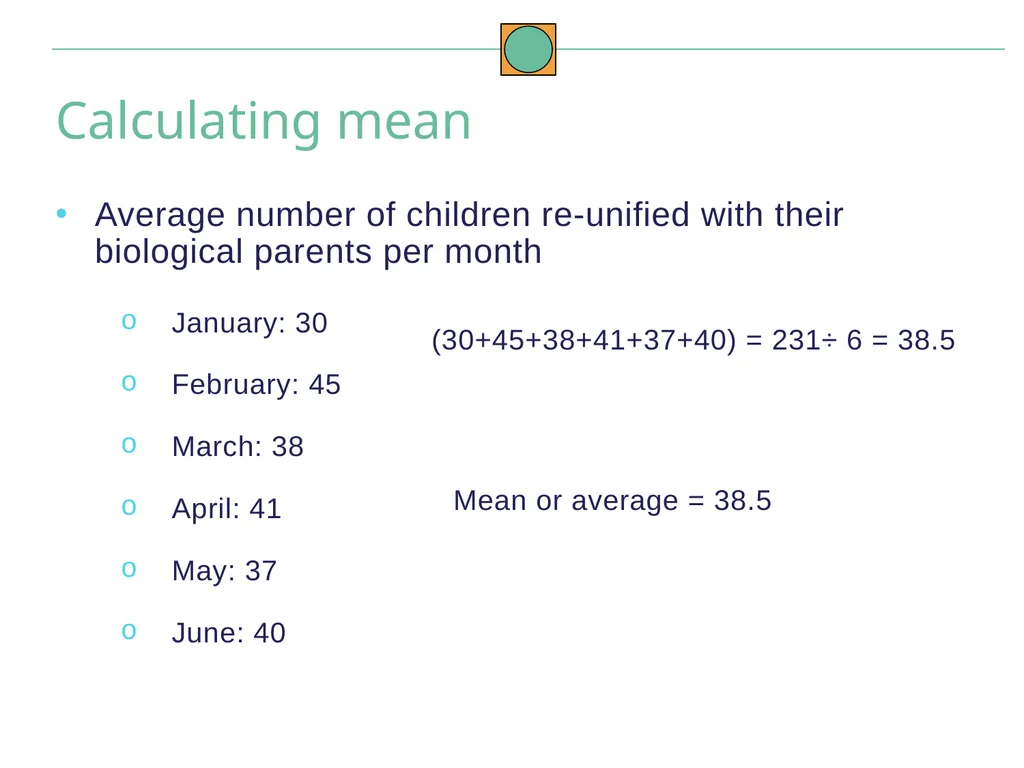
Calculating mean Average number of children re-unified with their biological parents per month January: 30
February: 45
March: 38
April: 41
May: 37
June: 40 (30+45+38+41+37+40) = 231÷ 6 = 38.5 Mean or average = 38.5<br>
February: 45
March: 38
April: 41
May: 37
June: 40 (30+45+38+41+37+40) = 231÷ 6 = 38.5 Mean or average = 38.5<br>
21
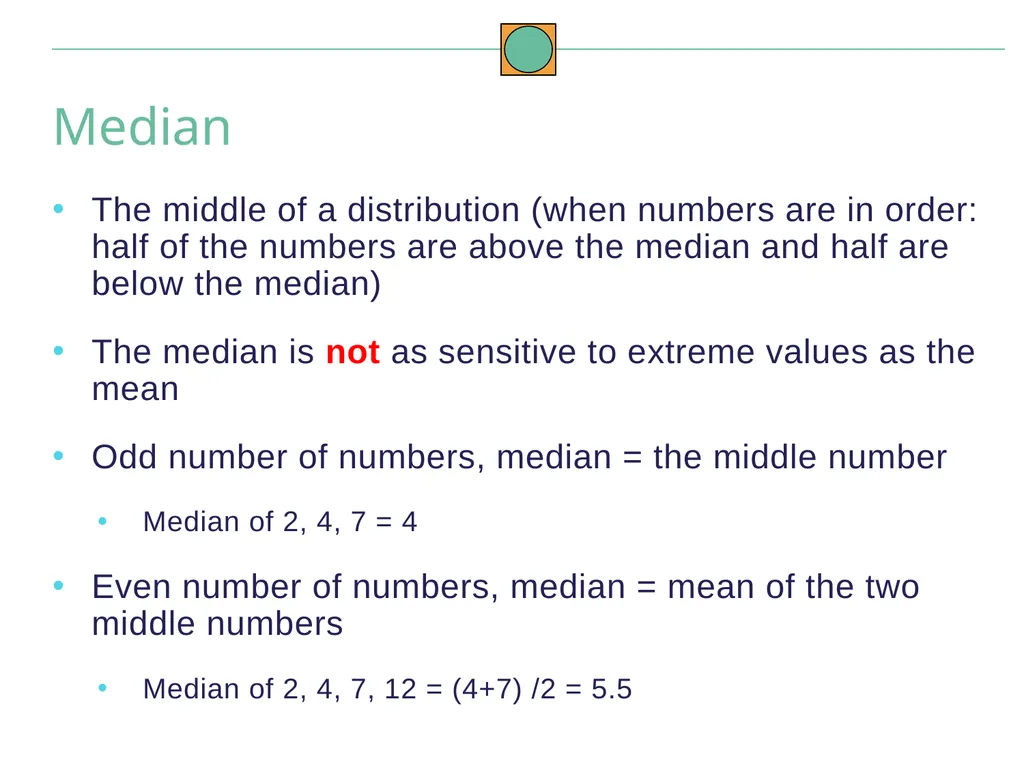
The middle of a distribution (when numbers are in order: half of the numbers are above the median and half are below the median)
The median is not as sensitive to extreme values as the mean
Odd number of numbers, median = the middle number
Median of 2, 4, 7 = 4
Even number of numbers, median = mean of the two middle numbers
Median of 2, 4, 7, 12 = (4+7) /2 = 5.5 Median<br>
The median is not as sensitive to extreme values as the mean
Odd number of numbers, median = the middle number
Median of 2, 4, 7 = 4
Even number of numbers, median = mean of the two middle numbers
Median of 2, 4, 7, 12 = (4+7) /2 = 5.5 Median<br>
22
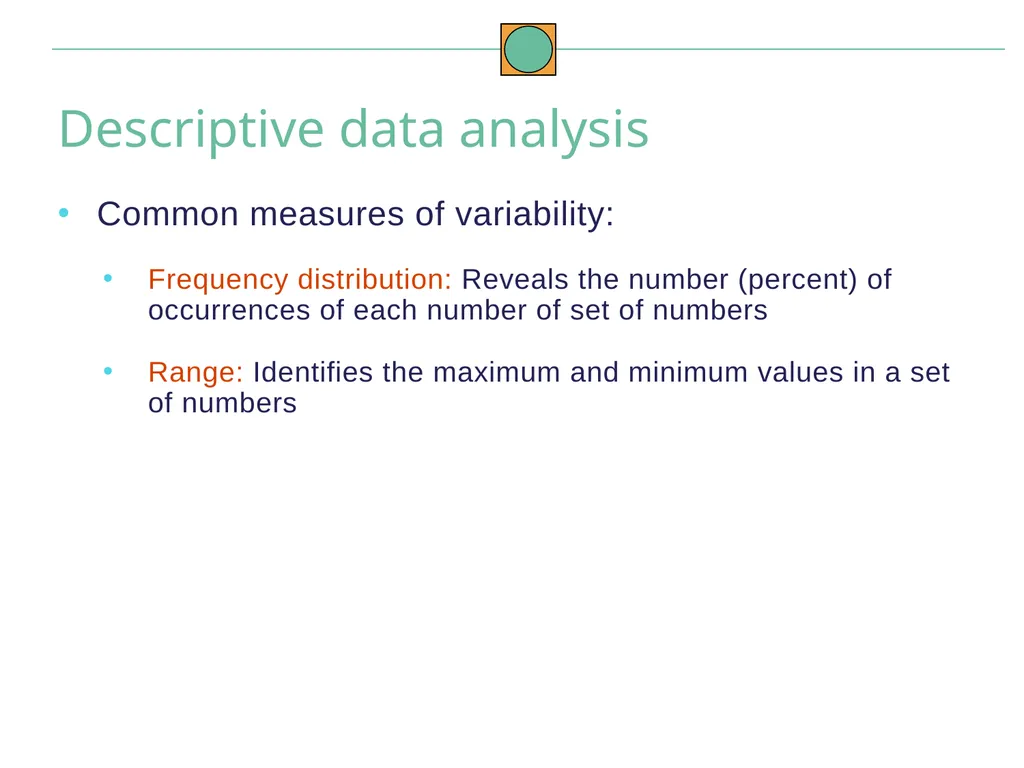
Common measures of variability:
Frequency distribution: Reveals the number (percent) of occurrences of each number of set of numbers
Range: Identifies the maximum and minimum values in a set of numbers Descriptive data analysis<br>
Frequency distribution: Reveals the number (percent) of occurrences of each number of set of numbers
Range: Identifies the maximum and minimum values in a set of numbers Descriptive data analysis<br>
23
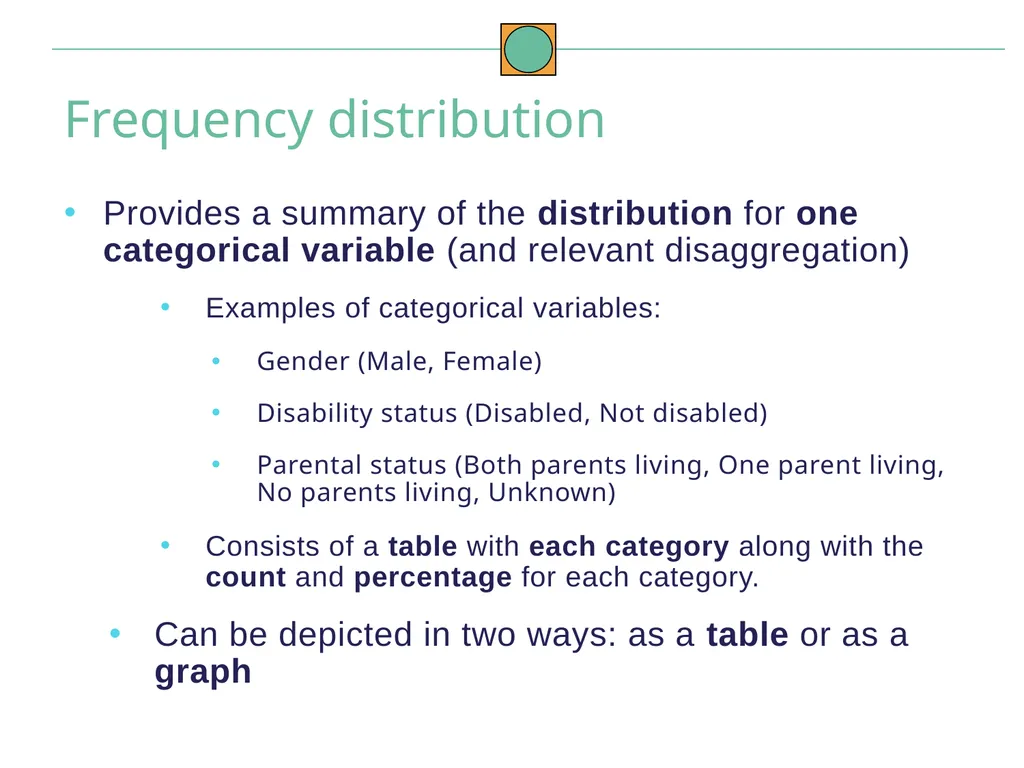
Provides a summary of the distribution for one categorical variable (and relevant disaggregation)
Examples of categorical variables:
Gender (Male, Female)
Disability status (Disabled, Not disabled)
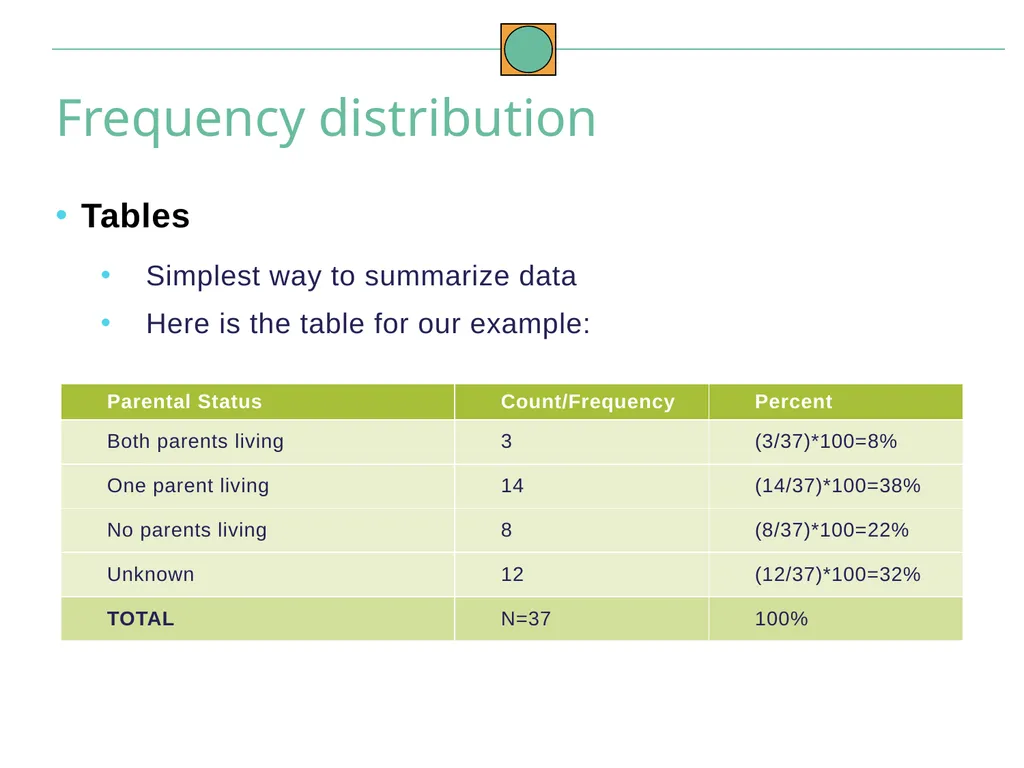
Parental status (Both parents living, One parent living, No parents living, Unknown)
Consists of a table with each category along with the count and percentage for each category.
Can be depicted in two ways: as a table or as a graph Frequency distribution<br>
Examples of categorical variables:
Gender (Male, Female)
Disability status (Disabled, Not disabled)
Parental status (Both parents living, One parent living, No parents living, Unknown)
Consists of a table with each category along with the count and percentage for each category.
Can be depicted in two ways: as a table or as a graph Frequency distribution<br>
24
Tables
Simplest way to summarize data
Here is the table for our example: Frequency distribution<br>
Simplest way to summarize data
Here is the table for our example: Frequency distribution<br>
25
Charts and graphs
Visual representation of data
Data are presented as absolute numbers or percentages
Charts and graphs are used to portray:
Trends, relationships, and comparisons
The most informative are simple and self-explanatory Frequency distribution<br>
Visual representation of data
Data are presented as absolute numbers or percentages
Charts and graphs are used to portray:
Trends, relationships, and comparisons
The most informative are simple and self-explanatory Frequency distribution<br>
26
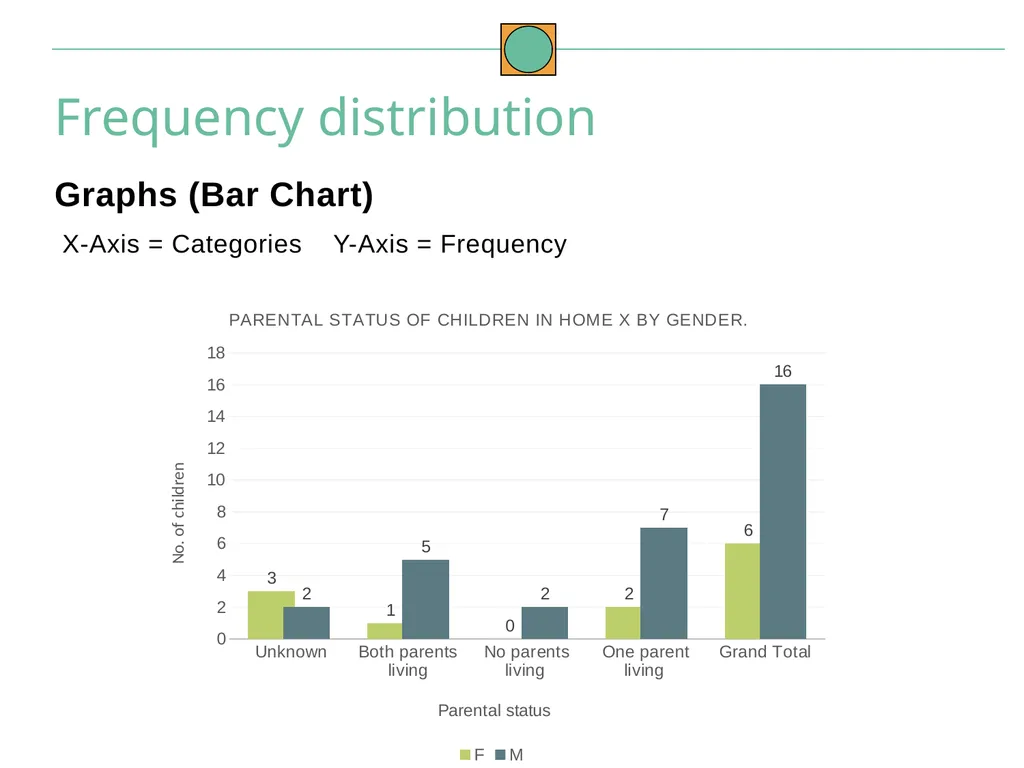
Graphs (Bar Chart)
X-Axis = Categories Y-Axis = Frequency Frequency distribution<br>
X-Axis = Categories Y-Axis = Frequency Frequency distribution<br>
27
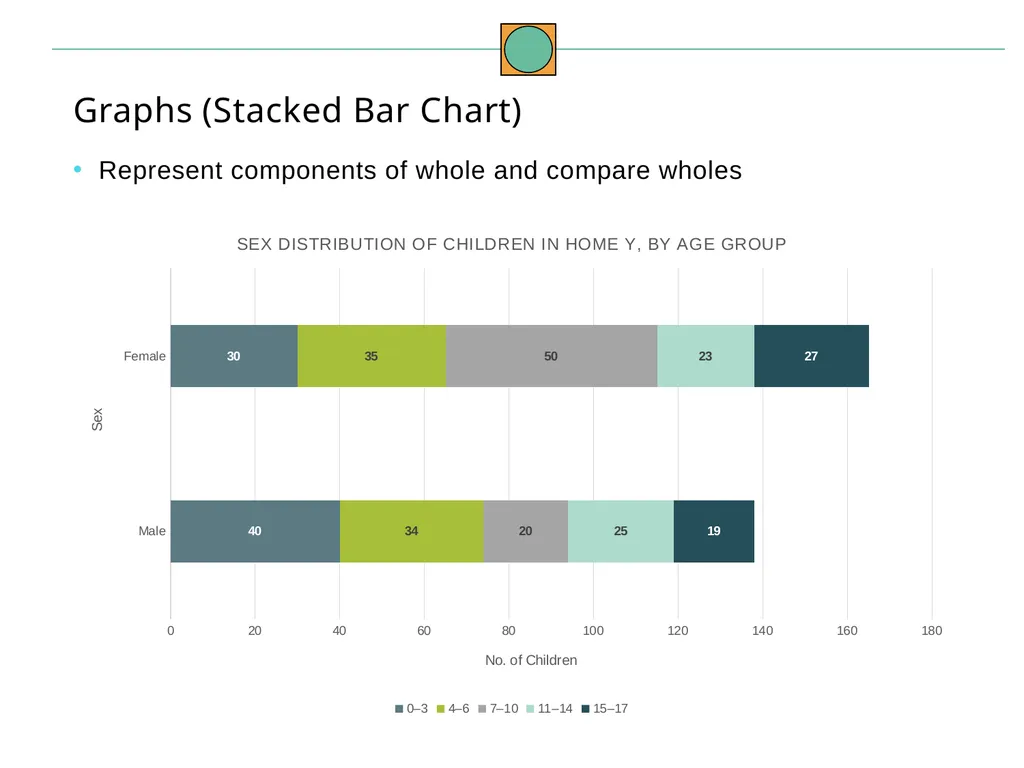
Graphs (Stacked Bar Chart)
Represent components of whole and compare wholes<br>
Represent components of whole and compare wholes<br>
28
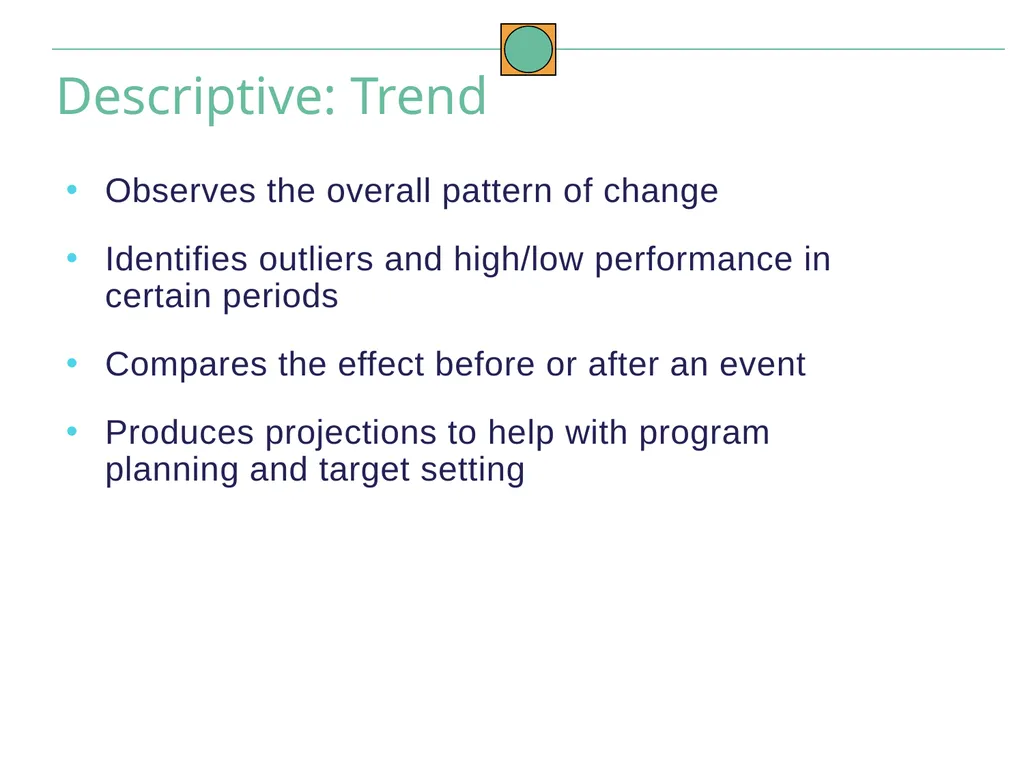
Observes the overall pattern of change
Identifies outliers and high/low performance in certain periods
Compares the effect before or after an event
Produces projections to help with program planning and target setting Descriptive: Trend<br>
Identifies outliers and high/low performance in certain periods
Compares the effect before or after an event
Produces projections to help with program planning and target setting Descriptive: Trend<br>
29
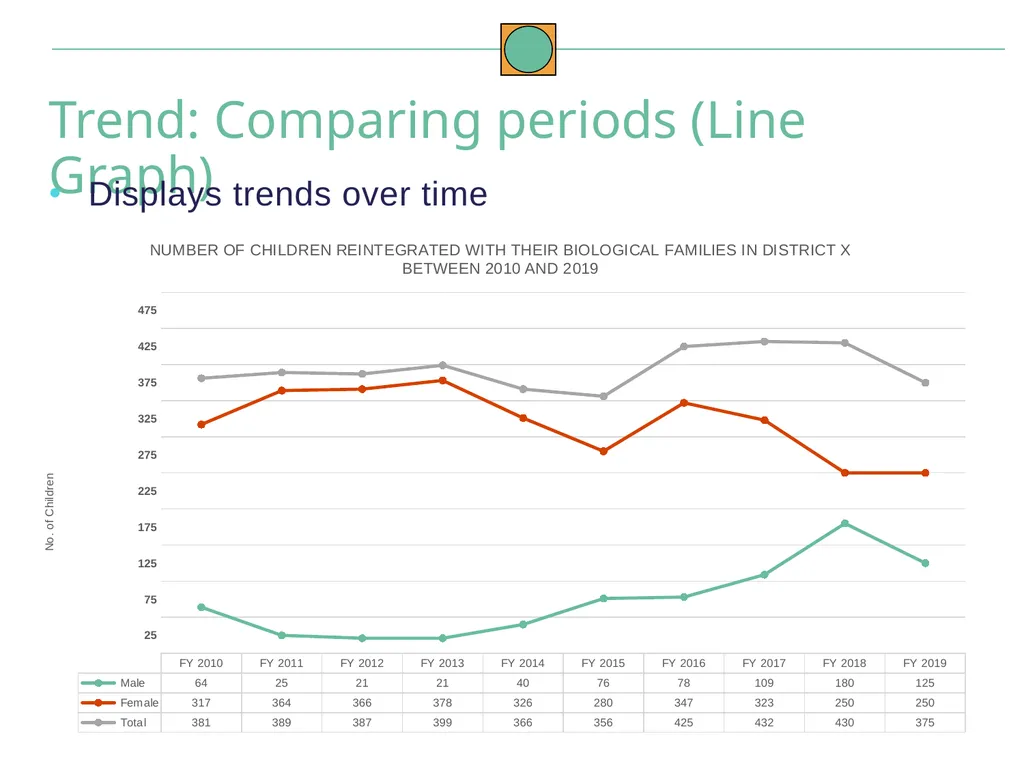
Trend: Comparing periods (Line Graph) Displays trends over time<br>
30
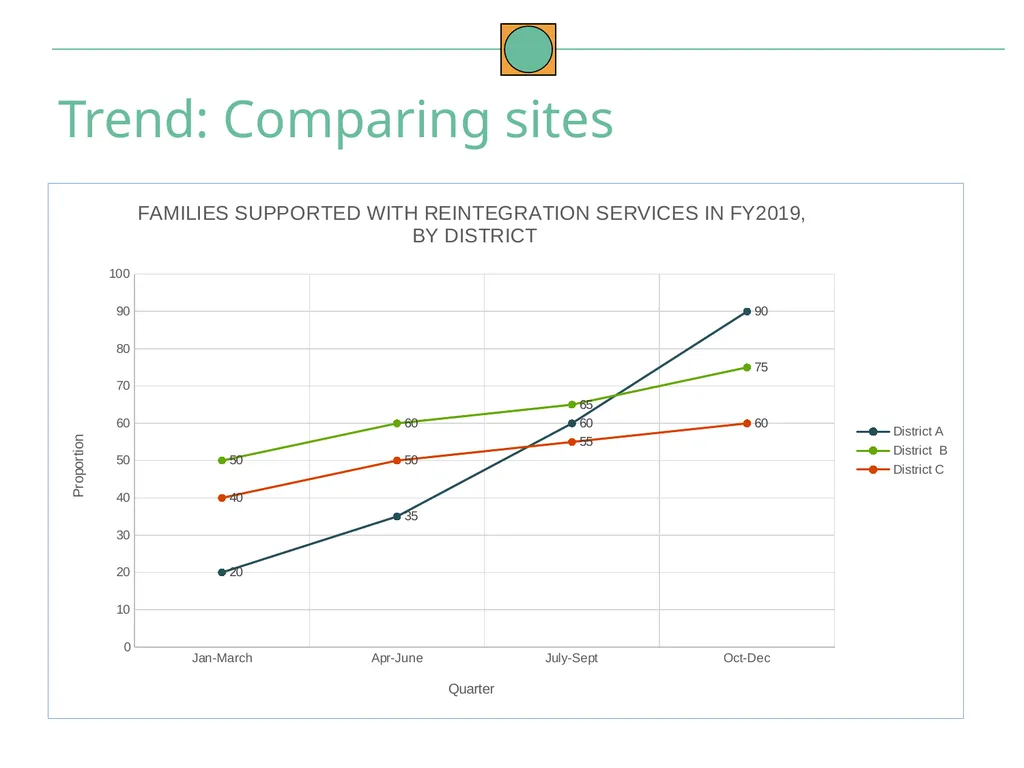
Trend: Comparing sites<br>
31
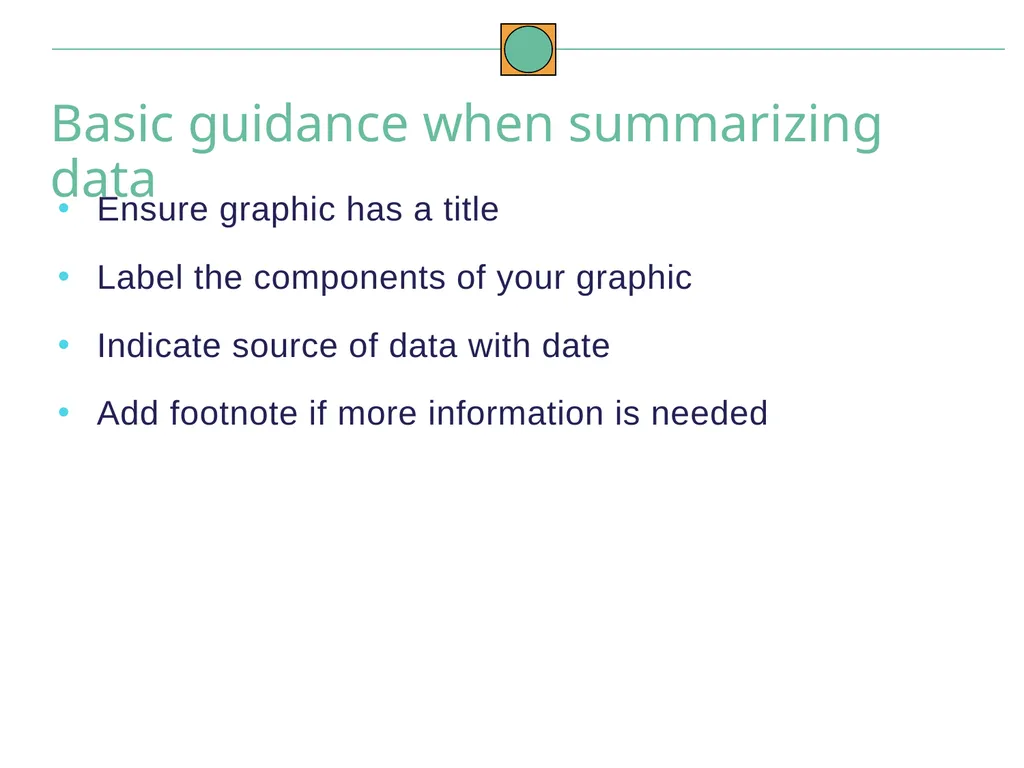
Ensure graphic has a title
Label the components of your graphic
Indicate source of data with date
Add footnote if more information is needed Basic guidance when summarizing data<br>
Label the components of your graphic
Indicate source of data with date
Add footnote if more information is needed Basic guidance when summarizing data<br>
32
Purpose of analysis is to provide answers to programmatic questions
Descriptive analyses describe the sample/target population
Descriptive analyses do not define causality – that is, they tell you what, not why Key Messages<br>
Descriptive analyses describe the sample/target population
Descriptive analyses do not define causality – that is, they tell you what, not why Key Messages<br>
33
Target-Setting
Indicators
Approaches for setting targets
Common analyses<br>
Indicators
Approaches for setting targets
Common analyses<br>
34
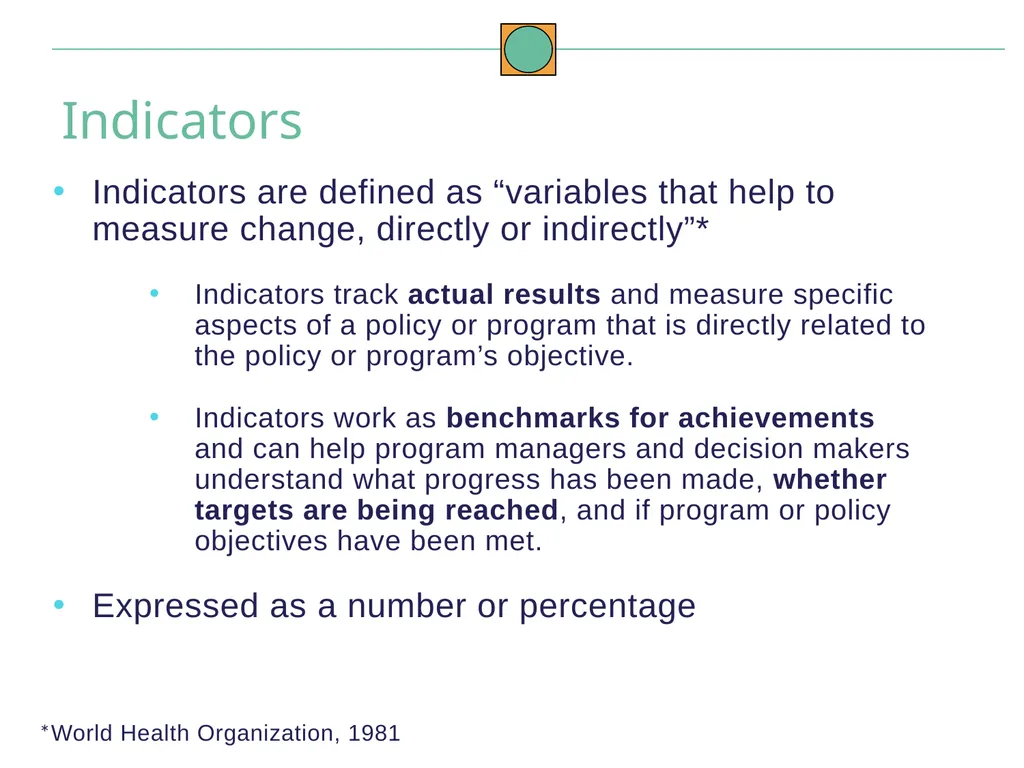
Indicators are defined as “variables that help to measure change, directly or indirectly”*
Indicators track actual results and measure specific aspects of a policy or program that is directly related to the policy or program’s objective.
Indicators work as benchmarks for achievements and can help program managers and decision makers understand what progress has been made, whether targets are being reached, and if program or policy objectives have been met.
Expressed as a number or percentage Indicators *World Health Organization, 1981<br>
Indicators track actual results and measure specific aspects of a policy or program that is directly related to the policy or program’s objective.
Indicators work as benchmarks for achievements and can help program managers and decision makers understand what progress has been made, whether targets are being reached, and if program or policy objectives have been met.
Expressed as a number or percentage Indicators *World Health Organization, 1981<br>
35
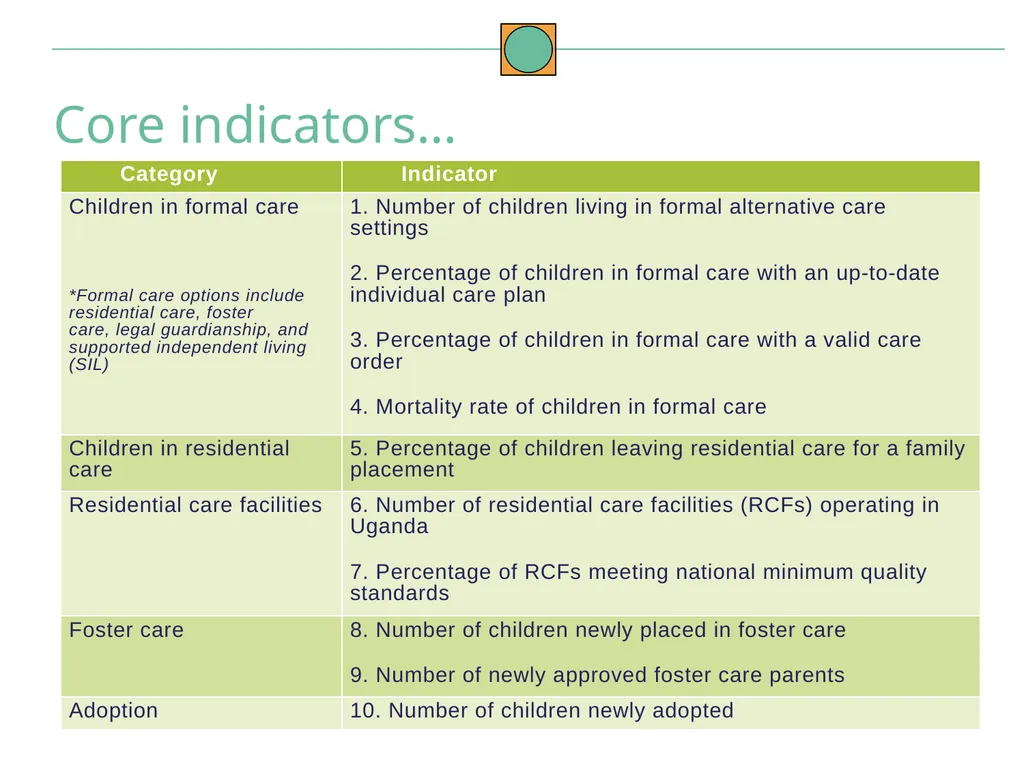
Ten indicators have been prioritized for routine monitoring of alternative care in Uganda
These can provide a way to track changes over time and compare trends across aspects of alternative care. Core indicators for routine monitoring of alternative care provision<br>
These can provide a way to track changes over time and compare trends across aspects of alternative care. Core indicators for routine monitoring of alternative care provision<br>
36
Core indicators…<br>
37
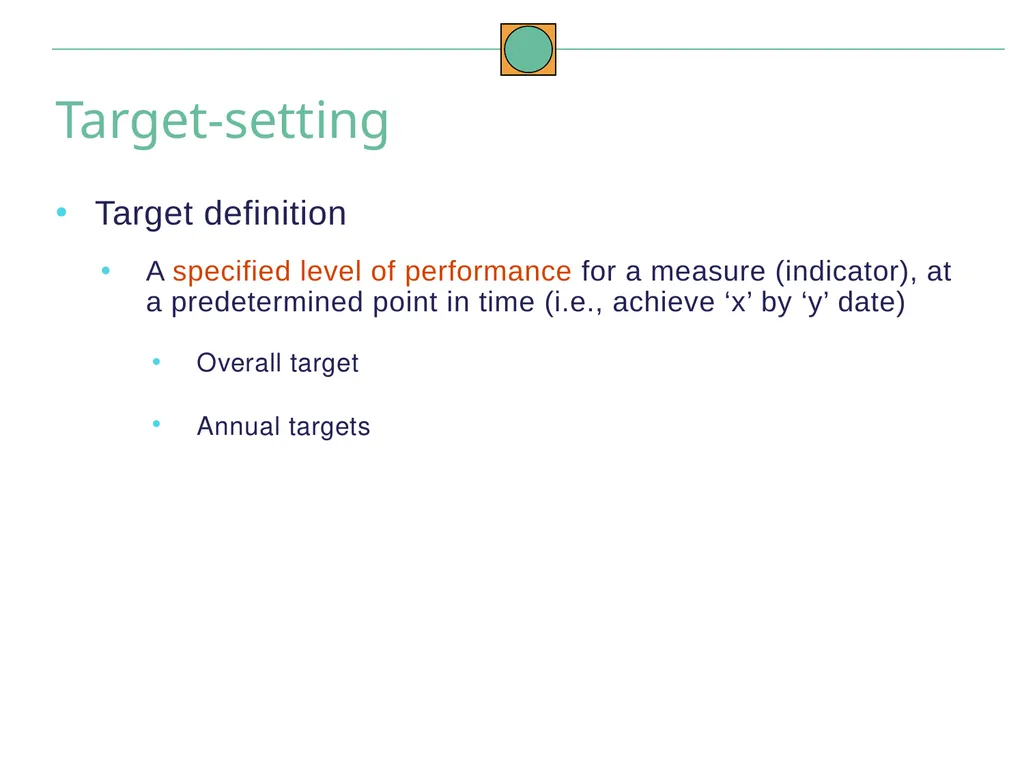
Target definition
A specified level of performance for a measure (indicator), at a predetermined point in time (i.e., achieve ‘x’ by ‘y’ date)
Overall target
Annual targets Target-setting<br>
A specified level of performance for a measure (indicator), at a predetermined point in time (i.e., achieve ‘x’ by ‘y’ date)
Overall target
Annual targets Target-setting<br>
38
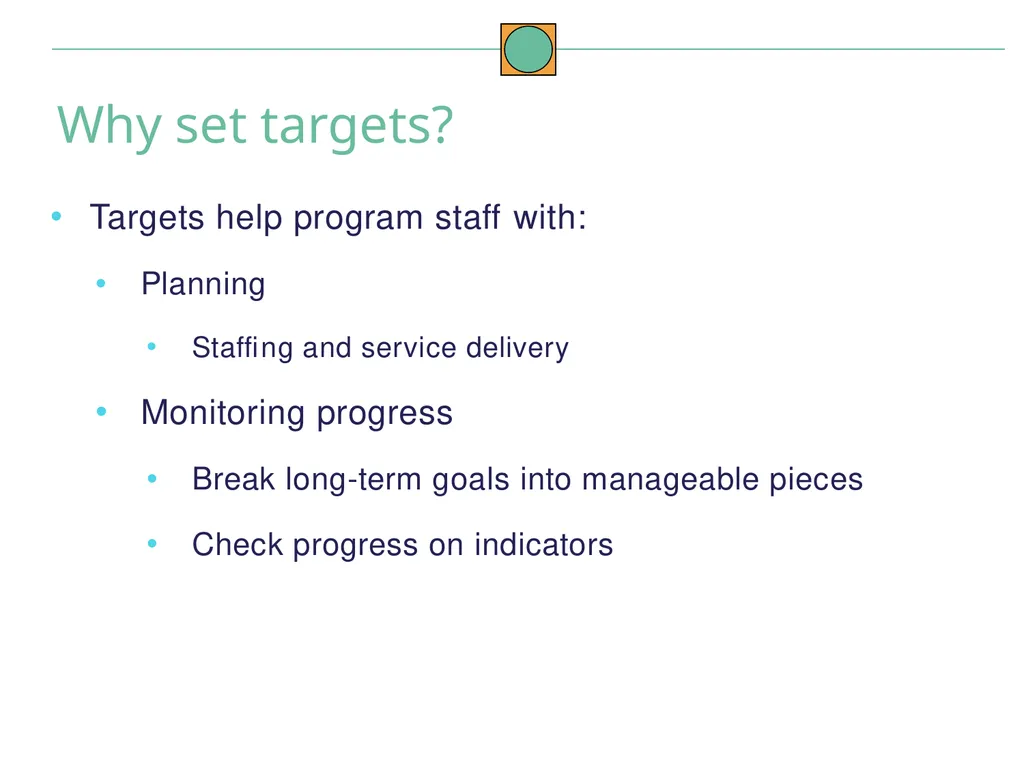
Targets help program staff with:
Planning
Staffing and service delivery
Monitoring progress
Break long-term goals into manageable pieces
Check progress on indicators Why set targets?<br>
Planning
Staffing and service delivery
Monitoring progress
Break long-term goals into manageable pieces
Check progress on indicators Why set targets?<br>
39
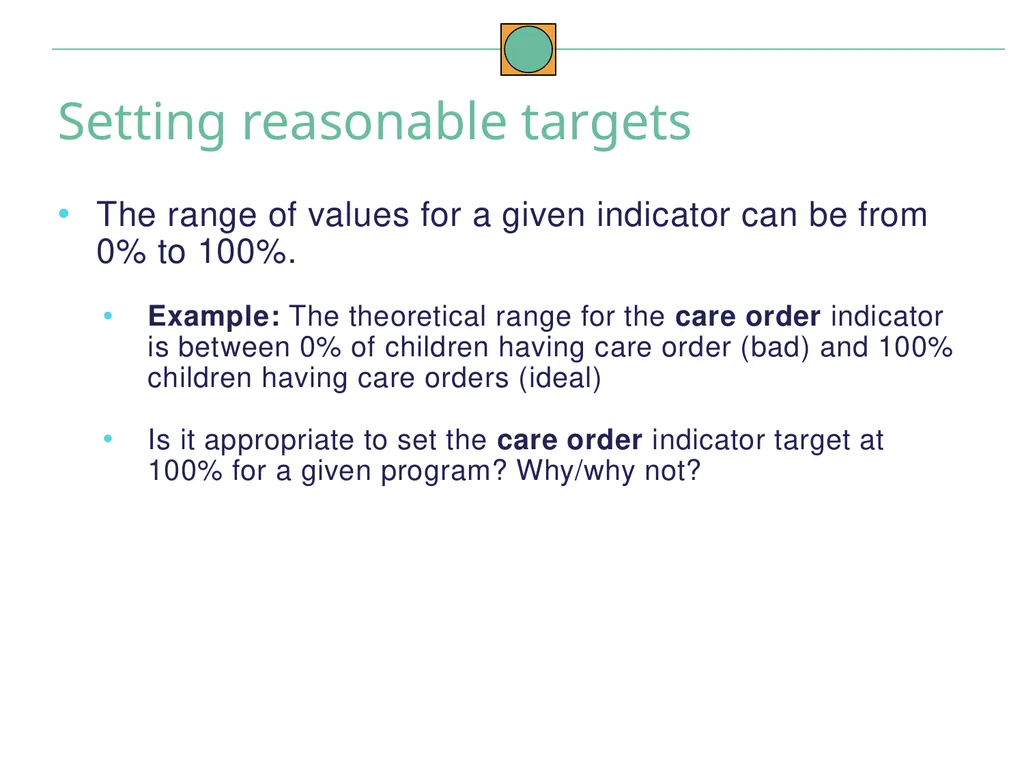
The range of values for a given indicator can be from 0% to 100%.
Example: The theoretical range for the care order indicator is between 0% of children having care order (bad) and 100% children having care orders (ideal)
Is it appropriate to set the care order indicator target at 100% for a given program? Why/why not? Setting reasonable targets<br>
Example: The theoretical range for the care order indicator is between 0% of children having care order (bad) and 100% children having care orders (ideal)
Is it appropriate to set the care order indicator target at 100% for a given program? Why/why not? Setting reasonable targets<br>
40
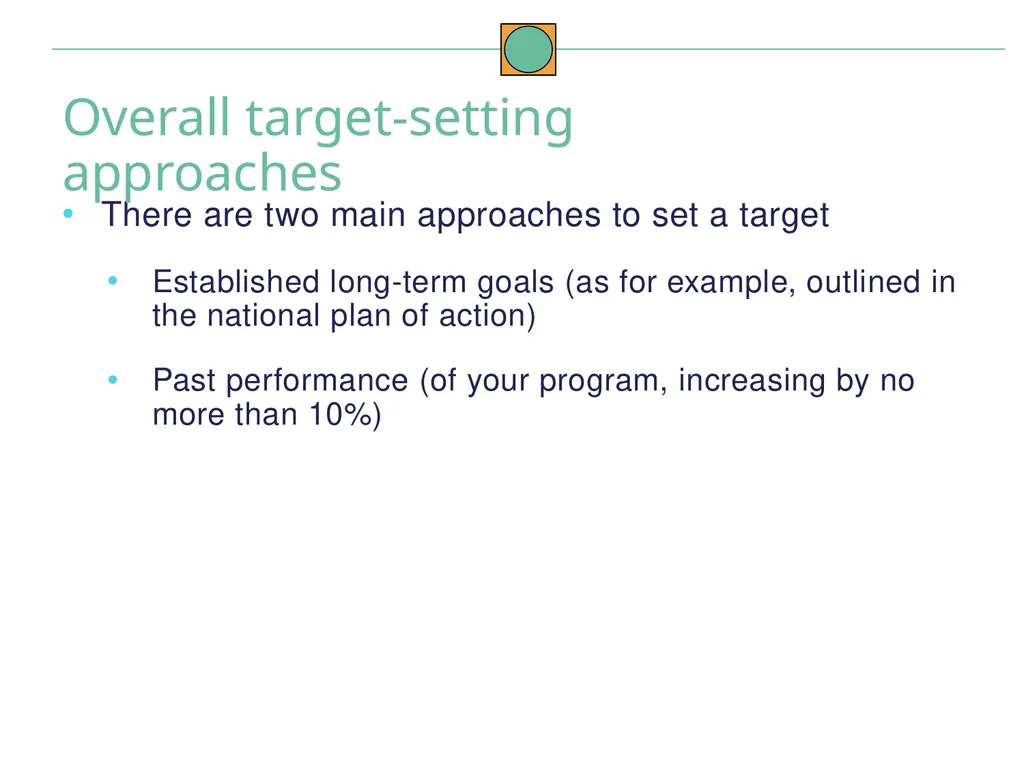
There are two main approaches to set a target
Established long-term goals (as for example, outlined in the national plan of action)
Past performance (of your program, increasing by no more than 10%) Overall target-setting approaches<br>
Established long-term goals (as for example, outlined in the national plan of action)
Past performance (of your program, increasing by no more than 10%) Overall target-setting approaches<br>
41
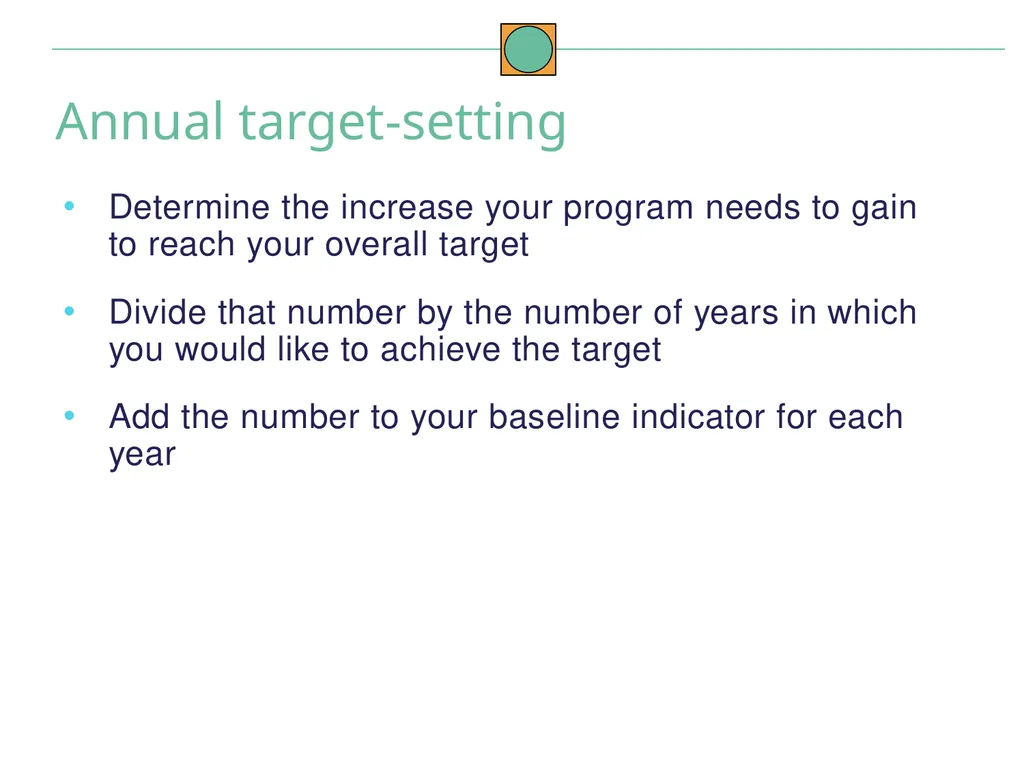
Determine the increase your program needs to gain to reach your overall target
Divide that number by the number of years in which you would like to achieve the target
Add the number to your baseline indicator for each year Annual target-setting<br>
Divide that number by the number of years in which you would like to achieve the target
Add the number to your baseline indicator for each year Annual target-setting<br>
42
Ensure you have an agreed-upon and realistic definition of target population
Set a realistic target to achieve in the long term and short term Considerations for target-setting<br>
Set a realistic target to achieve in the long term and short term Considerations for target-setting<br>
43
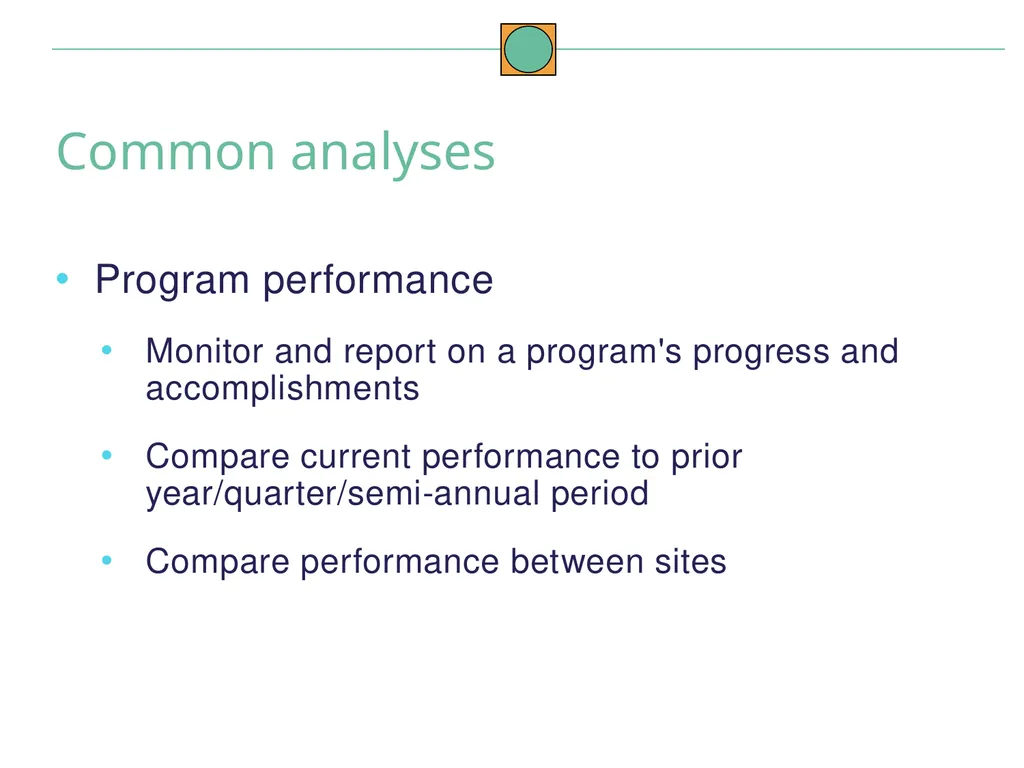
Program performance
Monitor and report on a program's progress and accomplishments
Compare current performance to prior year/quarter/semi-annual period
Compare performance between sites Common analyses<br>
Monitor and report on a program's progress and accomplishments
Compare current performance to prior year/quarter/semi-annual period
Compare performance between sites Common analyses<br>
44
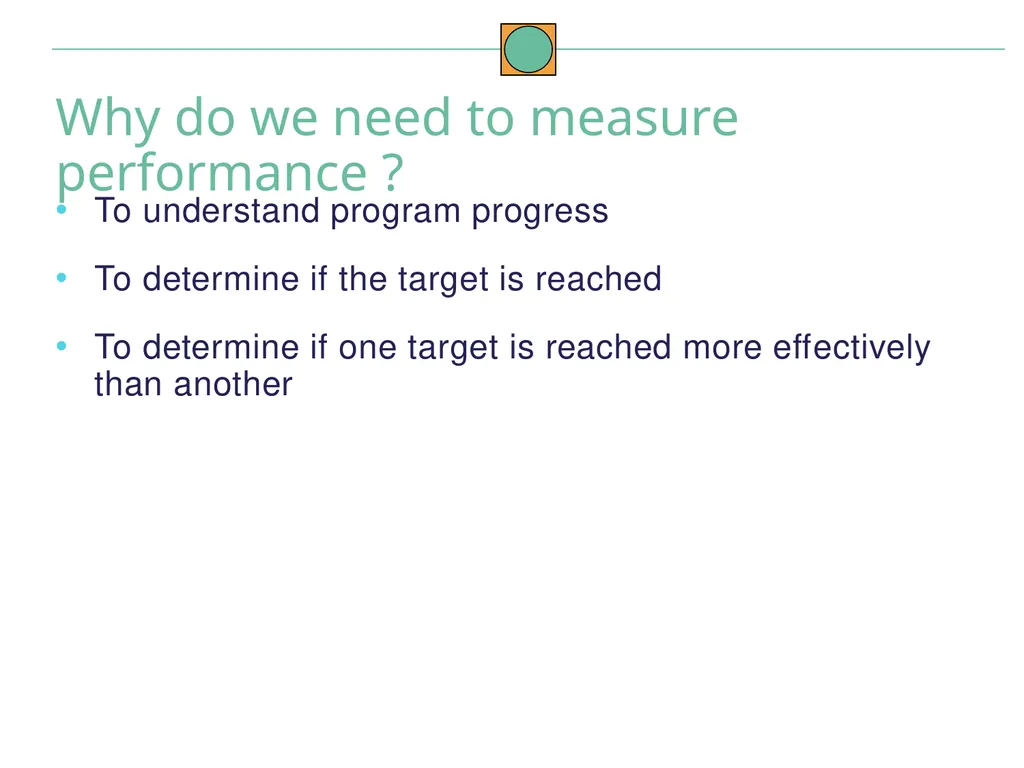
To understand program progress
To determine if the target is reached
To determine if one target is reached more effectively than another Why do we need to measure performance ?<br>
To determine if the target is reached
To determine if one target is reached more effectively than another Why do we need to measure performance ?<br>
45
Target-setting – A specified level of performance for a measure (indicator) at a predetermined point in time. Both overall and annual targets are set. Key messages<br>
46
Interpreting data<br>
47
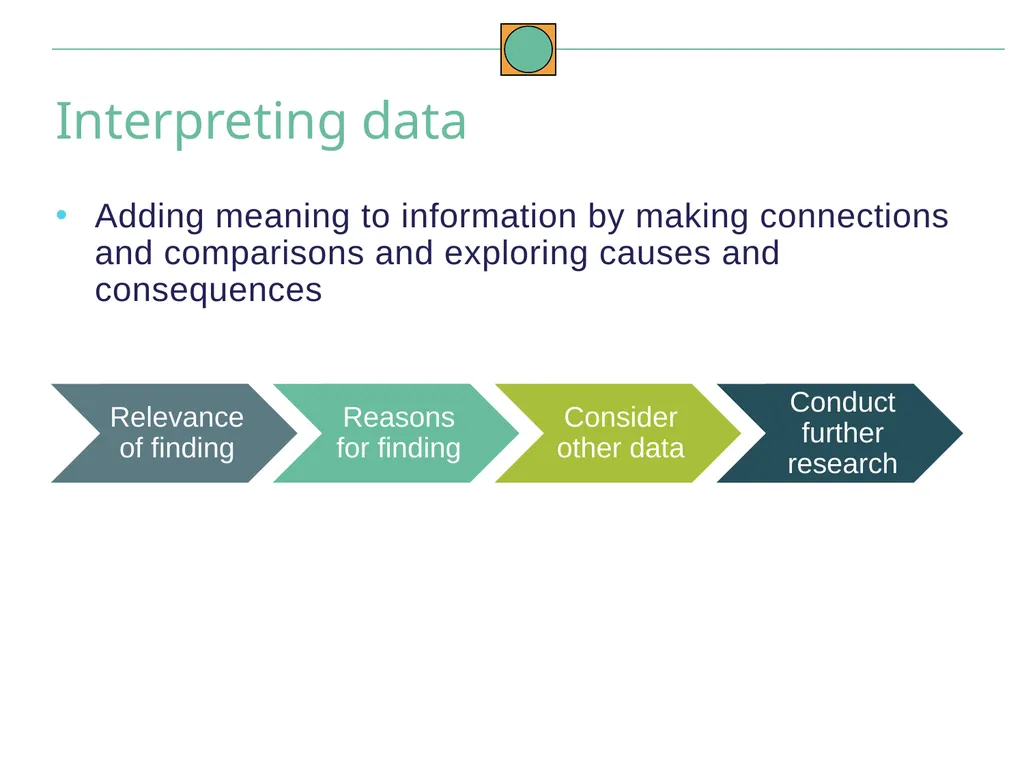
Interpreting data Adding meaning to information by making connections and comparisons and exploring causes and consequences<br>
48
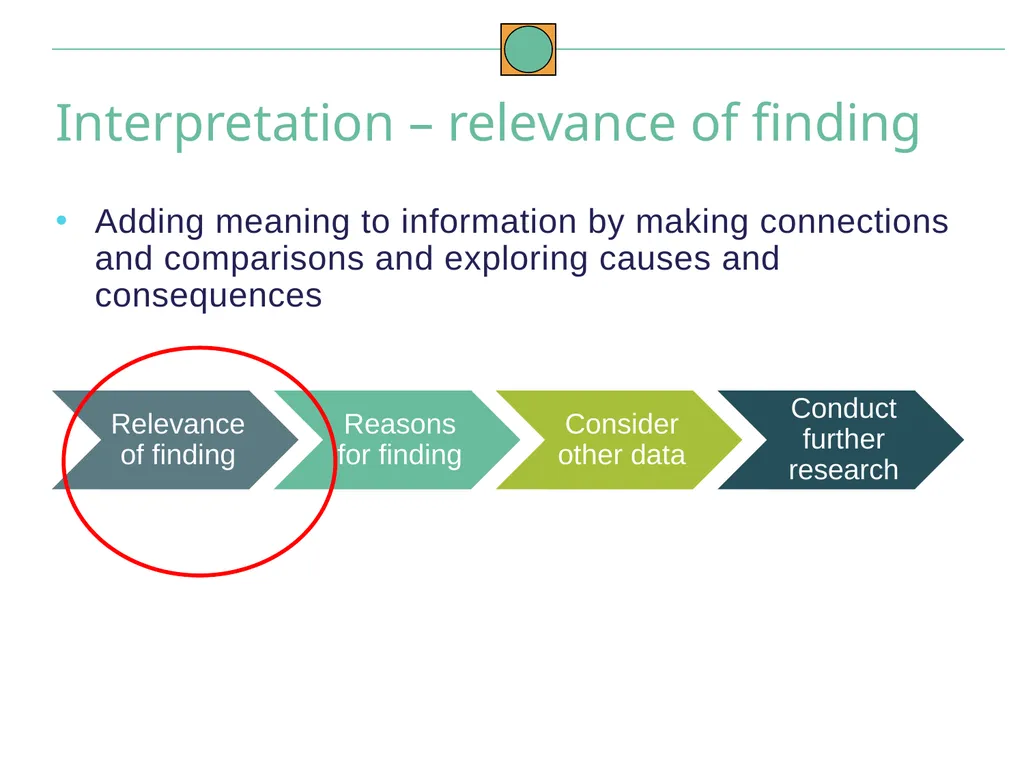
Interpretation – relevance of finding Adding meaning to information by making connections and comparisons and exploring causes and consequences<br>
49
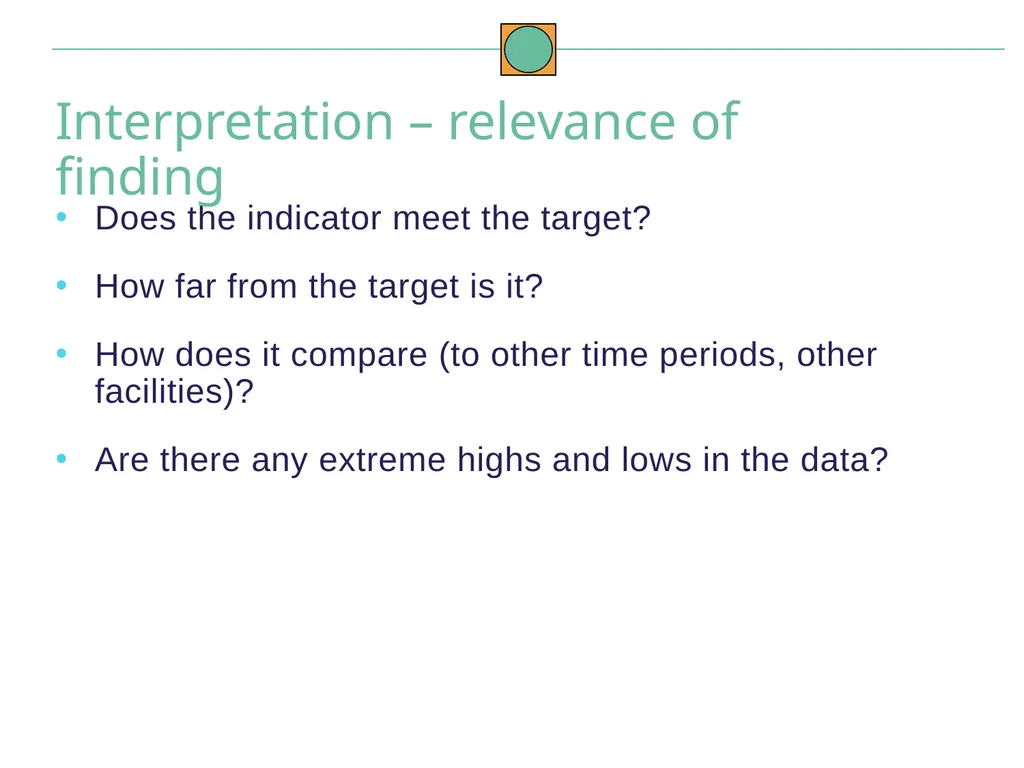
Does the indicator meet the target?
How far from the target is it?
How does it compare (to other time periods, other facilities)?
Are there any extreme highs and lows in the data? Interpretation – relevance of finding<br>
How far from the target is it?
How does it compare (to other time periods, other facilities)?
Are there any extreme highs and lows in the data? Interpretation – relevance of finding<br>
50
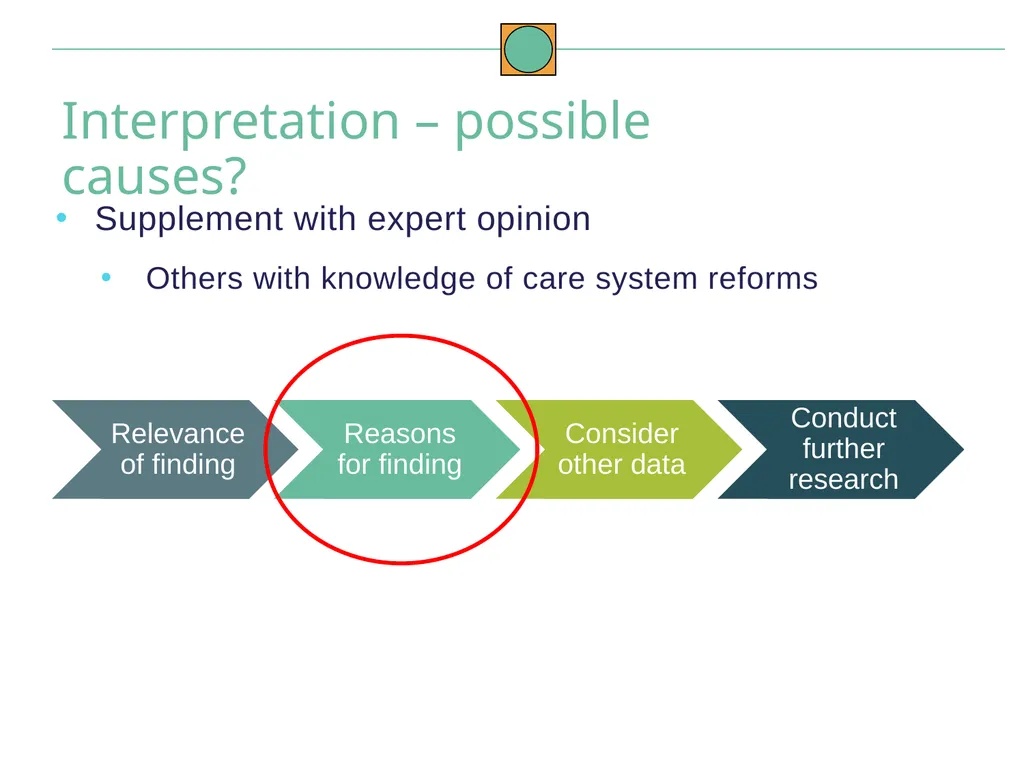
Interpretation – possible causes? Supplement with expert opinion
Others with knowledge of care system reforms<br>
Others with knowledge of care system reforms<br>
51
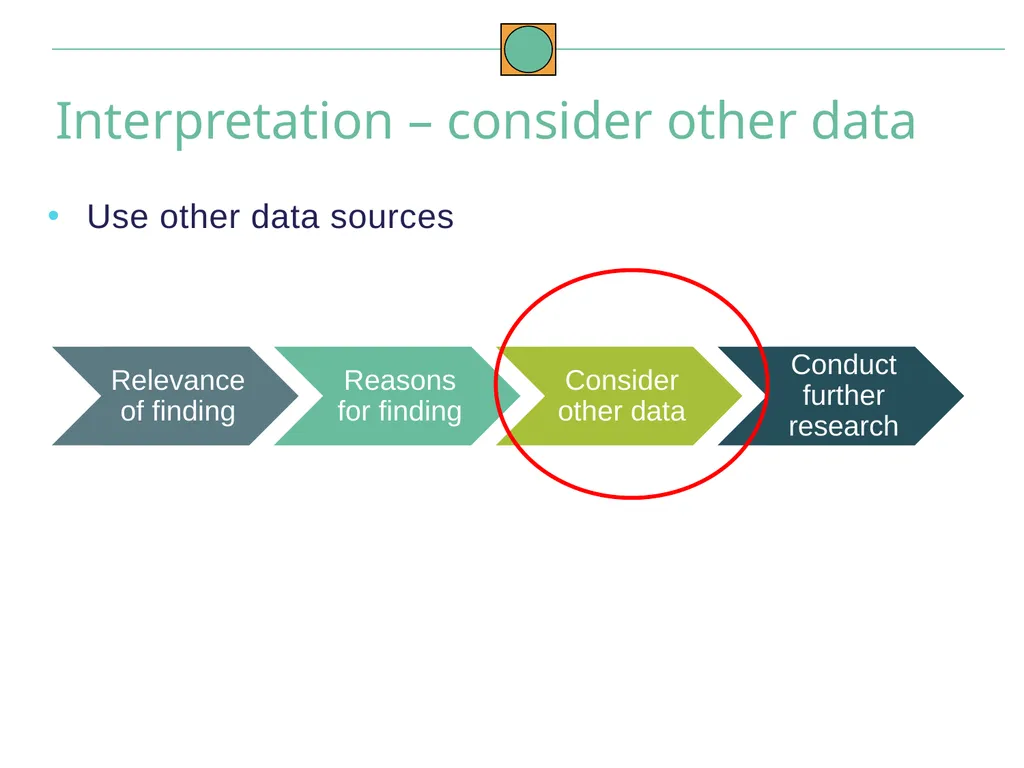
Interpretation – consider other data Use other data sources<br>
52
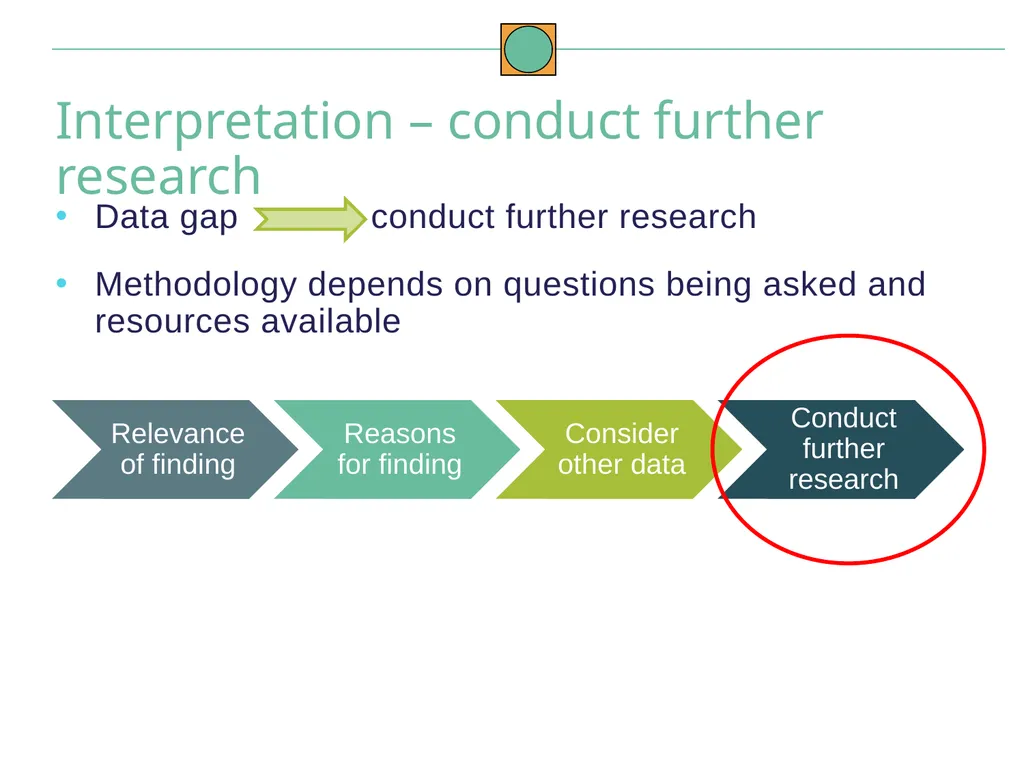
Interpretation – conduct further research Data gap conduct further research
Methodology depends on questions being asked and resources available<br>
Methodology depends on questions being asked and resources available<br>
53
Use the right graph for the right data
Tables – can display a large amount of data
Graphs/charts – visual, easier to detect patterns
Label the components of your graphic
Interpreting data adds meaning by making connections and comparisons to program
Service data are good at tracking progress and identifying concerns – but do not show causality Key messages<br>
Tables – can display a large amount of data
Graphs/charts – visual, easier to detect patterns
Label the components of your graphic
Interpreting data adds meaning by making connections and comparisons to program
Service data are good at tracking progress and identifying concerns – but do not show causality Key messages<br>