
Data Interpretation Data Interpretation Data
Description: Data Interpretation Data Interpretation Data Interpretation is the process of understanding, organising, and interpreting the given data, for making sense of and getting a meaningful conclusion. The basic concept of data interpretation is
Related Topics
Download Presentation
"Data Interpretation Data Interpretation Data" is the property of its rightful owner. Permission is granted to download and print the materials on this website for personal, non-commercial use only, and to display it on your personal computer provided you do not modify the materials and that you retain all copyright notices contained in the materials. By downloading content from our website, you accept the terms of this agreement.
Presentation Transcript
slide1. Data Interpretation<br>
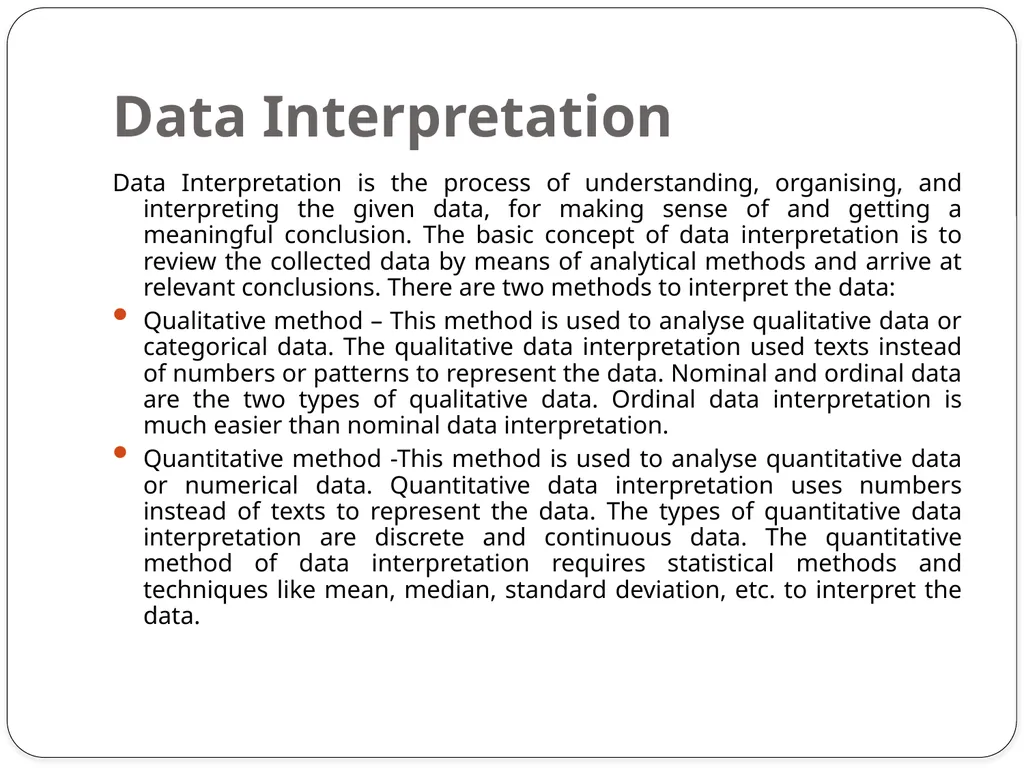
slide2. Data Interpretation Data Interpretation is the process of understanding, organising, and interpreting the given data, for making sense of and getting a meaningful conclusion. The basic concept of data interpretation is to review the collected data by means of analytical methods and arrive at relevant conclusions. There are two methods to interpret the data:
Qualitative method – This method is used to analyse qualitative data or categorical data. The qualitative data interpretation used texts instead of numbers or patterns to represent the data. Nominal and ordinal data are the two types of qualitative data. Ordinal data interpretation is much easier than nominal data interpretation.
Quantitative method -This method is used to analyse quantitative data or numerical data. Quantitative data interpretation uses numbers instead of texts to represent the data. The types of quantitative data interpretation are discrete and continuous data. The quantitative method of data interpretation requires statistical methods and techniques like mean, median, standard deviation, etc. to interpret the data.<br>
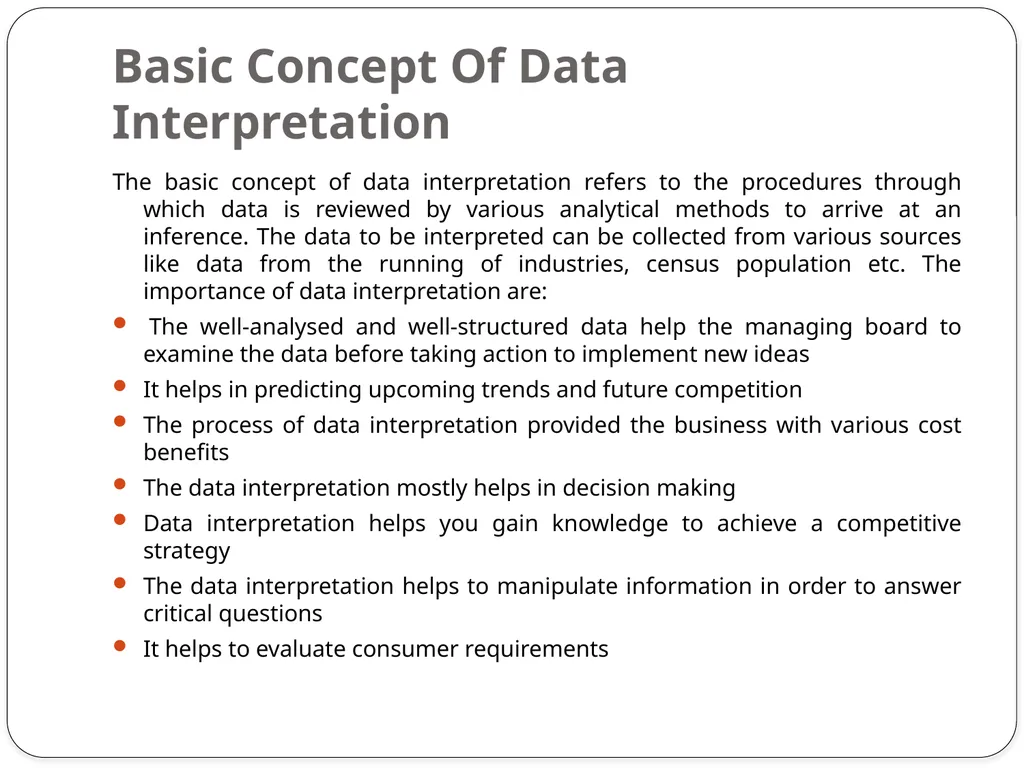
slide3. Basic Concept Of Data Interpretation The basic concept of data interpretation refers to the procedures through which data is reviewed by various analytical methods to arrive at an inference. The data to be interpreted can be collected from various sources like data from the running of industries, census population etc. The importance of data interpretation are:
The well-analysed and well-structured data help the managing board to examine the data before taking action to implement new ideas
It helps in predicting upcoming trends and future competition
The process of data interpretation provided the business with various cost benefits
The data interpretation mostly helps in decision making
Data interpretation helps you gain knowledge to achieve a competitive strategy
The data interpretation helps to manipulate information in order to answer critical questions
It helps to evaluate consumer requirements<br>
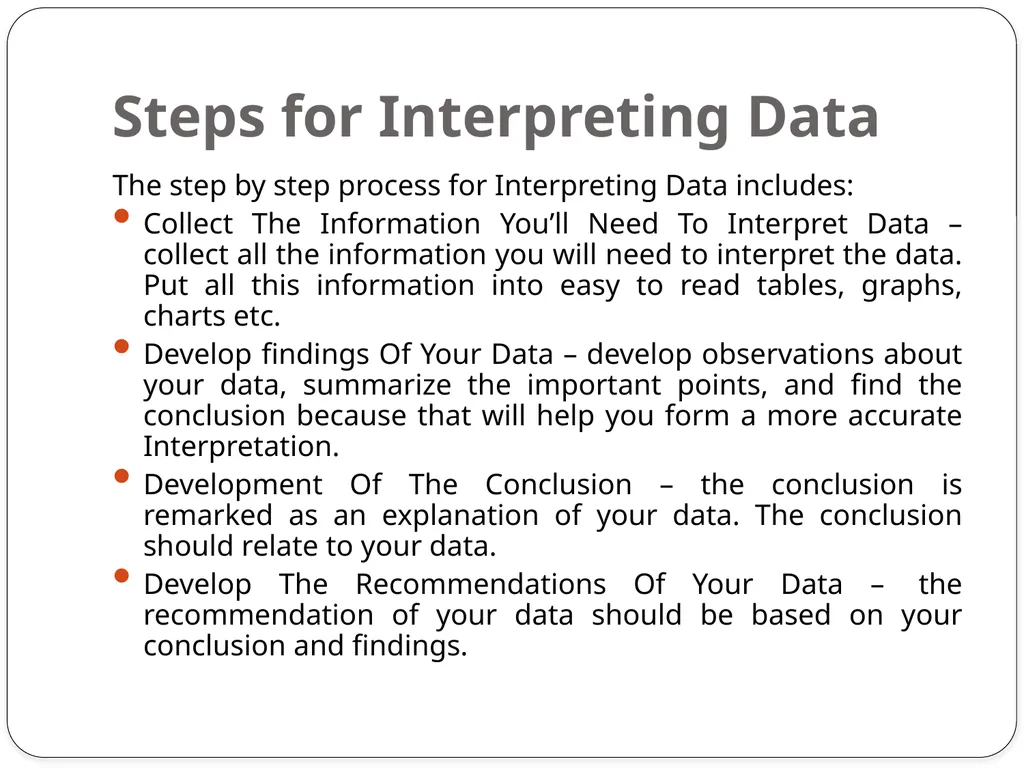
slide4. Steps for Interpreting Data The step by step process for Interpreting Data includes:
Collect The Information You’ll Need To Interpret Data – collect all the information you will need to interpret the data. Put all this information into easy to read tables, graphs, charts etc.
Develop findings Of Your Data – develop observations about your data, summarize the important points, and find the conclusion because that will help you form a more accurate Interpretation.
Development Of The Conclusion – the conclusion is remarked as an explanation of your data. The conclusion should relate to your data.
Develop The Recommendations Of Your Data – the recommendation of your data should be based on your conclusion and findings.<br>
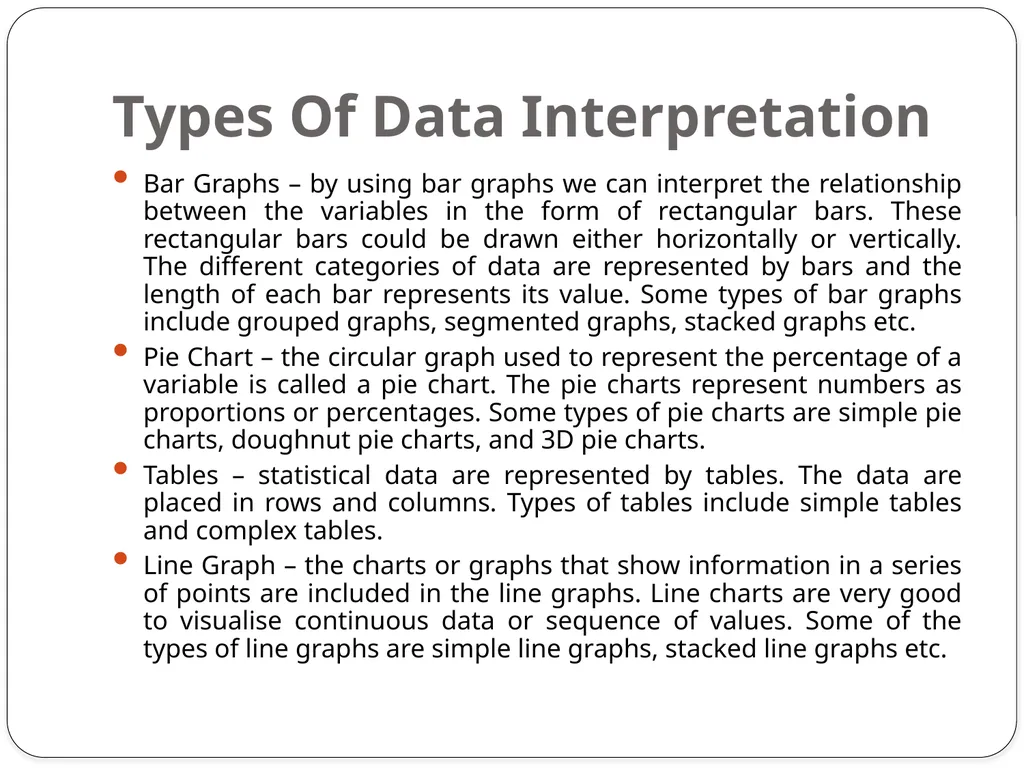
slide5. Types Of Data Interpretation Bar Graphs – by using bar graphs we can interpret the relationship between the variables in the form of rectangular bars. These rectangular bars could be drawn either horizontally or vertically. The different categories of data are represented by bars and the length of each bar represents its value. Some types of bar graphs include grouped graphs, segmented graphs, stacked graphs etc.
Pie Chart – the circular graph used to represent the percentage of a variable is called a pie chart. The pie charts represent numbers as proportions or percentages. Some types of pie charts are simple pie charts, doughnut pie charts, and 3D pie charts.
Tables – statistical data are represented by tables. The data are placed in rows and columns. Types of tables include simple tables and complex tables.
Line Graph – the charts or graphs that show information in a series of points are included in the line graphs. Line charts are very good to visualise continuous data or sequence of values. Some of the types of line graphs are simple line graphs, stacked line graphs etc.<br>
slide2. Data Interpretation Data Interpretation is the process of understanding, organising, and interpreting the given data, for making sense of and getting a meaningful conclusion. The basic concept of data interpretation is to review the collected data by means of analytical methods and arrive at relevant conclusions. There are two methods to interpret the data:
Qualitative method – This method is used to analyse qualitative data or categorical data. The qualitative data interpretation used texts instead of numbers or patterns to represent the data. Nominal and ordinal data are the two types of qualitative data. Ordinal data interpretation is much easier than nominal data interpretation.
Quantitative method -This method is used to analyse quantitative data or numerical data. Quantitative data interpretation uses numbers instead of texts to represent the data. The types of quantitative data interpretation are discrete and continuous data. The quantitative method of data interpretation requires statistical methods and techniques like mean, median, standard deviation, etc. to interpret the data.<br>
slide3. Basic Concept Of Data Interpretation The basic concept of data interpretation refers to the procedures through which data is reviewed by various analytical methods to arrive at an inference. The data to be interpreted can be collected from various sources like data from the running of industries, census population etc. The importance of data interpretation are:
The well-analysed and well-structured data help the managing board to examine the data before taking action to implement new ideas
It helps in predicting upcoming trends and future competition
The process of data interpretation provided the business with various cost benefits
The data interpretation mostly helps in decision making
Data interpretation helps you gain knowledge to achieve a competitive strategy
The data interpretation helps to manipulate information in order to answer critical questions
It helps to evaluate consumer requirements<br>
slide4. Steps for Interpreting Data The step by step process for Interpreting Data includes:
Collect The Information You’ll Need To Interpret Data – collect all the information you will need to interpret the data. Put all this information into easy to read tables, graphs, charts etc.
Develop findings Of Your Data – develop observations about your data, summarize the important points, and find the conclusion because that will help you form a more accurate Interpretation.
Development Of The Conclusion – the conclusion is remarked as an explanation of your data. The conclusion should relate to your data.
Develop The Recommendations Of Your Data – the recommendation of your data should be based on your conclusion and findings.<br>
slide5. Types Of Data Interpretation Bar Graphs – by using bar graphs we can interpret the relationship between the variables in the form of rectangular bars. These rectangular bars could be drawn either horizontally or vertically. The different categories of data are represented by bars and the length of each bar represents its value. Some types of bar graphs include grouped graphs, segmented graphs, stacked graphs etc.
Pie Chart – the circular graph used to represent the percentage of a variable is called a pie chart. The pie charts represent numbers as proportions or percentages. Some types of pie charts are simple pie charts, doughnut pie charts, and 3D pie charts.
Tables – statistical data are represented by tables. The data are placed in rows and columns. Types of tables include simple tables and complex tables.
Line Graph – the charts or graphs that show information in a series of points are included in the line graphs. Line charts are very good to visualise continuous data or sequence of values. Some of the types of line graphs are simple line graphs, stacked line graphs etc.<br>