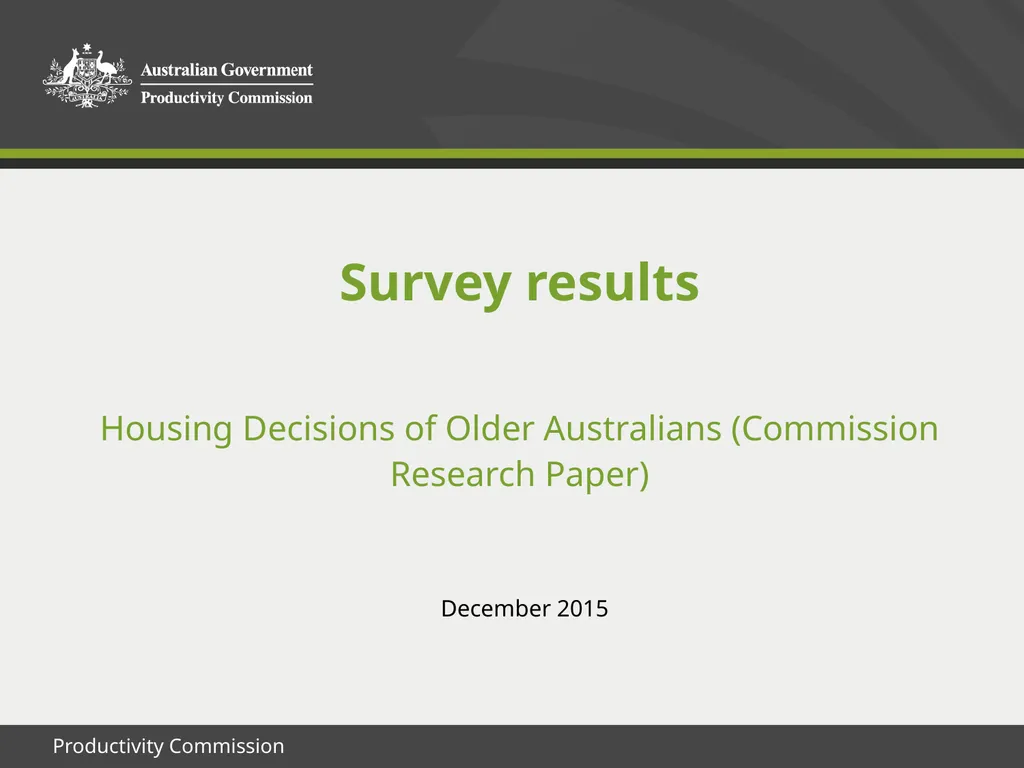
December 2015 Survey results Housing Decisions of
Description: December 2015 Survey results Housing Decisions of Older Australians (Commission Research Paper) About the survey Designed jointly by the Commission and RFi Group Sought the views of older Australians on various issues planning for
Related Topics
Download Presentation
"December 2015 Survey results Housing Decisions of" is the property of its rightful owner. Permission is granted to download and print the materials on this website for personal, non-commercial use only, and to display it on your personal computer provided you do not modify the materials and that you retain all copyright notices contained in the materials. By downloading content from our website, you accept the terms of this agreement.
Presentation Transcript
slide1. December 2015 Survey results
Housing Decisions of Older Australians (Commission Research Paper)<br>
slide2. About the survey Designed jointly by the Commission and RFi Group
Sought the views of older Australians on various issues
planning for retirement
housing preferences
downsizing
savings, debt and bequests
home equity release products
Conducted online in September 2015
Involved 1524 Australians aged 60+
Sample quotas applied
Sample representative of the Australian population in terms of age, gender, state and area (regional, rural and metropolitan)
Exception: 80+ population set to minimum of 100<br>
slide3. Sample profile All Respondents (n=1524)<br>
slide4. Sample profile All Respondents (n=1524)<br>
slide5. Living arrangements All Respondents (n=1524)<br>
slide6. Living arrangements Respondents who live in a private dwelling (n=1510)<br>
slide7. Living arrangements All Respondents (n=1524) (Percentages for ‘who else lives with you’ do not sum to 100 as respondents could choose more than one option)<br>
slide8. Financial position Respondents who answered the question (60–64: 412, 65–69: n=382, 70–74: n=273, 75–79: n=187, 80+: n=93, Total: n=1347)<br>
slide9. Financial position All Respondents (n=1524)<br>
slide10. Financial position Respondents who answered the question (Owners: n=992, Non-owners: n=274, Total: n=1266)<br>
slide11. Financial position Respondents who own their home and answered the question (n=1115)<br>
slide12. Financial position Respondents who own their home and answered the question (n=1029) Respondents with a mortgage and in employment (n=77)<br>
slide13. Financial position Respondents who have a mortgage and answered the question (n=182)<br>
slide14. Financial position All Respondents (Own the property in which you live: n=1203, Do not own the home in which you live: 321, Total: n=1524)<br>
slide15. Financial position Respondents who own their home and answered the question (Have a mortgage: n=192, Paid off mortgage: n=615, Never had a mortgage: n=218, Total: n=1029)<br>
slide16. Financial position All Respondents (60–64: n=468, 65–69: n=430, 70–74: n=316, 75–79: n=209, 80+: n=101, Total: n=1524)<br>
slide17. Financial position All Respondents (Novice: n=49, Beginner: n=501, Competent: n=765, Proficient: n=167, Expert: n=42, Total: n=1524)<br>
slide18. Retirement planning Respondents currently working and expecting to retire (60–64: n=197, 65–69: n=84, 70+: n=38, Total: n=319)<br>
slide19. Retirement planning All Respondents (60–64: n=468, 65–69: n=430, 70–74: n=316, 75–79: n=209, 80+: n=101, Total: n=1524) (Percentages for each age group do not sum to 100 as respondents could choose more than one option)<br>
slide20. Retirement planning All Respondents (60–64: n=468, 65–69: n=430, 70–74: n=316, 75–79: n=209, 80+: n=101, Total: n=1524)<br>
slide21. Retirement planning Respondents uncomfortable (0–5 out of 10) with retirement funding plans (n=533) (Percentages do not sum to 100 as respondents could choose more than one option) All Respondents (n=1524)<br>
slide22. Retirement planning Respondents currently working (n=364)<br>
slide23. Retirement planning All Respondents (60–64: n=468, 65–69: n=430, 70–74: n=316, 75–79: n=209, 80+: n=101, Total: n=1524)<br>
slide24. Retirement planning All Respondents (n=1524)<br>
slide25. Retirement planning Base 1: All Respondents (n=1524) Base 2: LOW savings/investments: n=351, HIGH savings/investments: n=384) (Percentages do not sum to 100 as respondents could choose more than one option)<br>
slide26. Attitudes towards home and debt Respondents who own their property (60–64: n=351, 65–69: n=335, 70–74: n=261, 75–79: n=172, 80+: n=84, Total: n=1203)<br>
slide27. Attitudes towards home and debt Respondents who own their property (60–64: n=351, 65–69: n=335, 70–74: n=261, 75–79: n=172, 80+: n=84, Total: n=1203)<br>
slide28. Attitudes towards home and debt Respondents who own their property (60–64: n=351, 65–69: n=335, 70–74: n=261, 75–79: n=172, 80+: n=84, Total: n=1203)<br>
slide29. Attitudes towards home and debt Respondents who own their property (60–64: n=351, 65–69: n=335, 70–74: n=261, 75–79: n=172, 80+: n=84, Total: n=1203)<br>
slide30. Attitudes towards home and debt Respondents who own their property (60–64: n=351, 65–69: n=335, 70–74: n=261, 75–79: n=172, 80+: n=84, Total: n=1203)<br>
slide31. Attitudes towards home and debt Respondents who own their property (60–64: n=351, 65–69: n=335, 70–74: n=261, 75–79: n=172, 80+: n=84, Total: n=1203)<br>
slide32. Attitudes towards home and debt All Respondents (60–64: n=468, 65–69: n=430, 70–74: n=316, 75–79: n=209, 80+: n=101, Total: n=1524)<br>
slide33. Attitudes towards home and debt All Respondents (60–64: n=468, 65–69: n=430, 70–74: n=316, 75–79: n=209, 80+: n=101, Total: n=1524)<br>
slide34. Attitudes towards home and debt All Respondents (60–64: n=468, 65–69: n=430, 70–74: n=316, 75–79: n=209, 80+: n=101, Total: n=1524)<br>
slide35. Inheritance All Respondents (60–64: n=468, 65–69: n=430, 70–74: n=316, 75–79: n=209, 80+: n=101, Total: n=1524)<br>
slide36. Inheritance Respondents who own their property (60–64: n=351, 65–69: n=335, 70–74: n=261, 75–79: n=172, 80+: n=84, Total: n=1203) Respondents intending to leave their home to beneficiary(ies) Total: n=1056)<br>
slide37. Inheritance Respondents who own their property (60–64: n=351, 65–69: n=335, 70–74: n=261, 75–79: n=172, 80+: n=84, Total: n=1203)<br>
slide38. Downsizing All Respondents (60–64: n=468, 65–69: n=430, 70–74: n=316, 75–79: n=209, 80+: n=101, Total: n=1524)<br>
slide39. Downsizing Respondents who sold the property in which they lived and purchased a less expensive one (n=286), purchased a more expensive one (n=184), or moved in with children/family (n=16)<br>
slide40. Downsizing Respondents who sold the property in which they lived and purchased a less expensive one (n=286)<br>
slide41. Downsizing Respondents who sold the property in which they lived and purchased a less expensive one (n=286)<br>
slide42. Downsizing Respondents who sold the property in which they lived and purchased a less expensive one and saved money freed up from the sale of their property (n=171)<br>
slide43. Downsizing Respondents who sold the property in which they lived and purchased a less expensive one and spent money freed up from the sale of their property (n=144)<br>
slide44. Downsizing Respondents who own their property (Total: n=1203)<br>
slide45. Downsizing Respondents unlikely (6–10) to sell their home in the future (n=789)<br>
slide46. Housing preferences Respondents who do not live in a non-private dwelling or a mobile home estate (60–64: n=467, 65–69: n=428, 70–74: n=312, 75–79: n=206, 80+: n=907, Total: n=1510)<br>
slide47. Housing preferences Respondents who do not live in a non-private dwelling or a mobile home estate (60–64: n=467, 65–69: n=428, 70–74: n=312, 75–79: n=206, 80+: n=907, Total: n=1510)<br>
slide48. Housing preferences Respondents who do not live in a non-private dwelling or a mobile home estate (60–64: n=467, 65–69: n=428, 70–74: n=312, 75–79: n=206, 80+: n=907, Total: n=1510)<br>
slide49. Housing preferences Respondents who do not live in a non-private dwelling or a mobile home estate (Total: n=1510) Respondents who said they would prefer to pay a lump sum RAD (Total: n=351)<br>
slide50. Housing preferences Respondents who do not live in a non-private dwelling or a mobile home estate (Total: n=1510) Respondents who said they would prefer to pay an ongoing DAP (Total: n=274)<br>
slide51. Housing preferences All Respondents (60–64: n=468, 65–69: n=430, 70–74: n=316, 75–79: n=209, 80+: n=101, Total: n=1524)<br>
slide52. Housing preferences All Respondents (60–64: n=468, 65–69: n=430, 70–74: n=316, 75–79: n=209, 80+: n=101, Total: n=1524)<br>
slide53. Housing preferences All Respondents (Total: n=1524) Respondents that do not currently receive support via these programs (60–64: n=451, 65–69: n=405, 70–74: n=288, 75–79: n=175, 80+: n=72, Total: n=1391)<br>
slide54. Housing preferences Respondents who do not live in a non-private dwelling or a mobile home estate (60–64: n=467, 65–69: n=428, 70–74: n=312, 75–79: n=206, 80+: n=907, Total: n=1510)<br>
slide55. Equity Release Products All Respondents (60–64: n=468, 65–69: n=430, 70–74: n=316, 75–79: n=209, 80+: n=101, Total: n=1524)<br>
slide56. Equity Release Products Respondents who had heard of either type of equity release products (60–64: n=336, 65–69: n=337, 70–74: n=253, 75–79: n=172, 80+: n=82, Total: n=1180) Respondents who are currently using a product (n=29)<br>
slide57. Equity Release Products Respondents who have heard of equity release products but are not currently using one (60–64: n=333, 65–69: n=334, 70–74: n=247, 75–79: n=161, 80+: n=76, Total: n=1151)<br>
slide58. Equity Release Products Respondents who have heard of equity release products but are not currently using one (60–64: n=333, 65–69: n=334, 70–74: n=247, 75–79: n=161, 80+: n=76, Total: n=1151)<br>
slide59. Equity Release Products Respondents who have considered using equity release products (n=146)<br>
slide60. Equity Release Products Respondents who have considered using equity release products (n=146)<br>
slide61. Equity Release Products Respondents who have considered using equity release products (n=146)<br>
slide62. Equity Release Products Respondents who have heard of equity release products but are not currently using one (60–64: n=333, 65–69: n=334, 70–74: n=247, 75–79: n=161, 80+: n=76, Total: n=1151)<br>
slide63. Equity Release Products Respondents who are likely (6-10 out of 10) to access an equity release product (n=96)<br>
slide64. Equity Release Products Respondents who have heard of both types of equity release products or just reverse mortgages (60–64: n=322, 65–69: n=322, 70–74: n=244, 75–79: n=171, 80+: n=81, Total: n=1140)<br>
slide65. Equity Release Products Respondents who have heard of both types of equity release products or just reverse mortgages (60–64: n=322, 65–69: n=322, 70–74: n=244, 75–79: n=171, 80+: n=81, Total: n=1140)<br>
slide66. Equity Release Products All Respondents (Total: n=1524)<br>
slide67. Pension Loan Scheme All Respondents (60–64: n=468, 65–69: n=430, 70–74: n=316, 75–79: n=209, 80+: n=101, Total: n=1524)<br>
slide68. Pension Loan Scheme Respondents who were unsure or had not heard of the Pension Loan Scheme (60–64: n=420, 65–69: n=360, 70–74: n=252, 75–79: n=164, 80+: n=82, Total: n=1278)<br>
slide69. Rate deferral All Respondents (60–64: n=468, 65–69: n=430, 70–74: n=316, 75–79: n=209, 80+: n=101, Total: n=1524)<br>
slide70. Rate deferral Respondents who said they would be likely (6–10) to make use of rates deferral (n=166)<br>
slide71. Productivity Commission 2015, Housing Decisions of Older Australians, Commission Research Paper, Canberra.
www.pc.gov.au<br>
Housing Decisions of Older Australians (Commission Research Paper)<br>
slide2. About the survey Designed jointly by the Commission and RFi Group
Sought the views of older Australians on various issues
planning for retirement
housing preferences
downsizing
savings, debt and bequests
home equity release products
Conducted online in September 2015
Involved 1524 Australians aged 60+
Sample quotas applied
Sample representative of the Australian population in terms of age, gender, state and area (regional, rural and metropolitan)
Exception: 80+ population set to minimum of 100<br>
slide3. Sample profile All Respondents (n=1524)<br>
slide4. Sample profile All Respondents (n=1524)<br>
slide5. Living arrangements All Respondents (n=1524)<br>
slide6. Living arrangements Respondents who live in a private dwelling (n=1510)<br>
slide7. Living arrangements All Respondents (n=1524) (Percentages for ‘who else lives with you’ do not sum to 100 as respondents could choose more than one option)<br>
slide8. Financial position Respondents who answered the question (60–64: 412, 65–69: n=382, 70–74: n=273, 75–79: n=187, 80+: n=93, Total: n=1347)<br>
slide9. Financial position All Respondents (n=1524)<br>
slide10. Financial position Respondents who answered the question (Owners: n=992, Non-owners: n=274, Total: n=1266)<br>
slide11. Financial position Respondents who own their home and answered the question (n=1115)<br>
slide12. Financial position Respondents who own their home and answered the question (n=1029) Respondents with a mortgage and in employment (n=77)<br>
slide13. Financial position Respondents who have a mortgage and answered the question (n=182)<br>
slide14. Financial position All Respondents (Own the property in which you live: n=1203, Do not own the home in which you live: 321, Total: n=1524)<br>
slide15. Financial position Respondents who own their home and answered the question (Have a mortgage: n=192, Paid off mortgage: n=615, Never had a mortgage: n=218, Total: n=1029)<br>
slide16. Financial position All Respondents (60–64: n=468, 65–69: n=430, 70–74: n=316, 75–79: n=209, 80+: n=101, Total: n=1524)<br>
slide17. Financial position All Respondents (Novice: n=49, Beginner: n=501, Competent: n=765, Proficient: n=167, Expert: n=42, Total: n=1524)<br>
slide18. Retirement planning Respondents currently working and expecting to retire (60–64: n=197, 65–69: n=84, 70+: n=38, Total: n=319)<br>
slide19. Retirement planning All Respondents (60–64: n=468, 65–69: n=430, 70–74: n=316, 75–79: n=209, 80+: n=101, Total: n=1524) (Percentages for each age group do not sum to 100 as respondents could choose more than one option)<br>
slide20. Retirement planning All Respondents (60–64: n=468, 65–69: n=430, 70–74: n=316, 75–79: n=209, 80+: n=101, Total: n=1524)<br>
slide21. Retirement planning Respondents uncomfortable (0–5 out of 10) with retirement funding plans (n=533) (Percentages do not sum to 100 as respondents could choose more than one option) All Respondents (n=1524)<br>
slide22. Retirement planning Respondents currently working (n=364)<br>
slide23. Retirement planning All Respondents (60–64: n=468, 65–69: n=430, 70–74: n=316, 75–79: n=209, 80+: n=101, Total: n=1524)<br>
slide24. Retirement planning All Respondents (n=1524)<br>
slide25. Retirement planning Base 1: All Respondents (n=1524) Base 2: LOW savings/investments: n=351, HIGH savings/investments: n=384) (Percentages do not sum to 100 as respondents could choose more than one option)<br>
slide26. Attitudes towards home and debt Respondents who own their property (60–64: n=351, 65–69: n=335, 70–74: n=261, 75–79: n=172, 80+: n=84, Total: n=1203)<br>
slide27. Attitudes towards home and debt Respondents who own their property (60–64: n=351, 65–69: n=335, 70–74: n=261, 75–79: n=172, 80+: n=84, Total: n=1203)<br>
slide28. Attitudes towards home and debt Respondents who own their property (60–64: n=351, 65–69: n=335, 70–74: n=261, 75–79: n=172, 80+: n=84, Total: n=1203)<br>
slide29. Attitudes towards home and debt Respondents who own their property (60–64: n=351, 65–69: n=335, 70–74: n=261, 75–79: n=172, 80+: n=84, Total: n=1203)<br>
slide30. Attitudes towards home and debt Respondents who own their property (60–64: n=351, 65–69: n=335, 70–74: n=261, 75–79: n=172, 80+: n=84, Total: n=1203)<br>
slide31. Attitudes towards home and debt Respondents who own their property (60–64: n=351, 65–69: n=335, 70–74: n=261, 75–79: n=172, 80+: n=84, Total: n=1203)<br>
slide32. Attitudes towards home and debt All Respondents (60–64: n=468, 65–69: n=430, 70–74: n=316, 75–79: n=209, 80+: n=101, Total: n=1524)<br>
slide33. Attitudes towards home and debt All Respondents (60–64: n=468, 65–69: n=430, 70–74: n=316, 75–79: n=209, 80+: n=101, Total: n=1524)<br>
slide34. Attitudes towards home and debt All Respondents (60–64: n=468, 65–69: n=430, 70–74: n=316, 75–79: n=209, 80+: n=101, Total: n=1524)<br>
slide35. Inheritance All Respondents (60–64: n=468, 65–69: n=430, 70–74: n=316, 75–79: n=209, 80+: n=101, Total: n=1524)<br>
slide36. Inheritance Respondents who own their property (60–64: n=351, 65–69: n=335, 70–74: n=261, 75–79: n=172, 80+: n=84, Total: n=1203) Respondents intending to leave their home to beneficiary(ies) Total: n=1056)<br>
slide37. Inheritance Respondents who own their property (60–64: n=351, 65–69: n=335, 70–74: n=261, 75–79: n=172, 80+: n=84, Total: n=1203)<br>
slide38. Downsizing All Respondents (60–64: n=468, 65–69: n=430, 70–74: n=316, 75–79: n=209, 80+: n=101, Total: n=1524)<br>
slide39. Downsizing Respondents who sold the property in which they lived and purchased a less expensive one (n=286), purchased a more expensive one (n=184), or moved in with children/family (n=16)<br>
slide40. Downsizing Respondents who sold the property in which they lived and purchased a less expensive one (n=286)<br>
slide41. Downsizing Respondents who sold the property in which they lived and purchased a less expensive one (n=286)<br>
slide42. Downsizing Respondents who sold the property in which they lived and purchased a less expensive one and saved money freed up from the sale of their property (n=171)<br>
slide43. Downsizing Respondents who sold the property in which they lived and purchased a less expensive one and spent money freed up from the sale of their property (n=144)<br>
slide44. Downsizing Respondents who own their property (Total: n=1203)<br>
slide45. Downsizing Respondents unlikely (6–10) to sell their home in the future (n=789)<br>
slide46. Housing preferences Respondents who do not live in a non-private dwelling or a mobile home estate (60–64: n=467, 65–69: n=428, 70–74: n=312, 75–79: n=206, 80+: n=907, Total: n=1510)<br>
slide47. Housing preferences Respondents who do not live in a non-private dwelling or a mobile home estate (60–64: n=467, 65–69: n=428, 70–74: n=312, 75–79: n=206, 80+: n=907, Total: n=1510)<br>
slide48. Housing preferences Respondents who do not live in a non-private dwelling or a mobile home estate (60–64: n=467, 65–69: n=428, 70–74: n=312, 75–79: n=206, 80+: n=907, Total: n=1510)<br>
slide49. Housing preferences Respondents who do not live in a non-private dwelling or a mobile home estate (Total: n=1510) Respondents who said they would prefer to pay a lump sum RAD (Total: n=351)<br>
slide50. Housing preferences Respondents who do not live in a non-private dwelling or a mobile home estate (Total: n=1510) Respondents who said they would prefer to pay an ongoing DAP (Total: n=274)<br>
slide51. Housing preferences All Respondents (60–64: n=468, 65–69: n=430, 70–74: n=316, 75–79: n=209, 80+: n=101, Total: n=1524)<br>
slide52. Housing preferences All Respondents (60–64: n=468, 65–69: n=430, 70–74: n=316, 75–79: n=209, 80+: n=101, Total: n=1524)<br>
slide53. Housing preferences All Respondents (Total: n=1524) Respondents that do not currently receive support via these programs (60–64: n=451, 65–69: n=405, 70–74: n=288, 75–79: n=175, 80+: n=72, Total: n=1391)<br>
slide54. Housing preferences Respondents who do not live in a non-private dwelling or a mobile home estate (60–64: n=467, 65–69: n=428, 70–74: n=312, 75–79: n=206, 80+: n=907, Total: n=1510)<br>
slide55. Equity Release Products All Respondents (60–64: n=468, 65–69: n=430, 70–74: n=316, 75–79: n=209, 80+: n=101, Total: n=1524)<br>
slide56. Equity Release Products Respondents who had heard of either type of equity release products (60–64: n=336, 65–69: n=337, 70–74: n=253, 75–79: n=172, 80+: n=82, Total: n=1180) Respondents who are currently using a product (n=29)<br>
slide57. Equity Release Products Respondents who have heard of equity release products but are not currently using one (60–64: n=333, 65–69: n=334, 70–74: n=247, 75–79: n=161, 80+: n=76, Total: n=1151)<br>
slide58. Equity Release Products Respondents who have heard of equity release products but are not currently using one (60–64: n=333, 65–69: n=334, 70–74: n=247, 75–79: n=161, 80+: n=76, Total: n=1151)<br>
slide59. Equity Release Products Respondents who have considered using equity release products (n=146)<br>
slide60. Equity Release Products Respondents who have considered using equity release products (n=146)<br>
slide61. Equity Release Products Respondents who have considered using equity release products (n=146)<br>
slide62. Equity Release Products Respondents who have heard of equity release products but are not currently using one (60–64: n=333, 65–69: n=334, 70–74: n=247, 75–79: n=161, 80+: n=76, Total: n=1151)<br>
slide63. Equity Release Products Respondents who are likely (6-10 out of 10) to access an equity release product (n=96)<br>
slide64. Equity Release Products Respondents who have heard of both types of equity release products or just reverse mortgages (60–64: n=322, 65–69: n=322, 70–74: n=244, 75–79: n=171, 80+: n=81, Total: n=1140)<br>
slide65. Equity Release Products Respondents who have heard of both types of equity release products or just reverse mortgages (60–64: n=322, 65–69: n=322, 70–74: n=244, 75–79: n=171, 80+: n=81, Total: n=1140)<br>
slide66. Equity Release Products All Respondents (Total: n=1524)<br>
slide67. Pension Loan Scheme All Respondents (60–64: n=468, 65–69: n=430, 70–74: n=316, 75–79: n=209, 80+: n=101, Total: n=1524)<br>
slide68. Pension Loan Scheme Respondents who were unsure or had not heard of the Pension Loan Scheme (60–64: n=420, 65–69: n=360, 70–74: n=252, 75–79: n=164, 80+: n=82, Total: n=1278)<br>
slide69. Rate deferral All Respondents (60–64: n=468, 65–69: n=430, 70–74: n=316, 75–79: n=209, 80+: n=101, Total: n=1524)<br>
slide70. Rate deferral Respondents who said they would be likely (6–10) to make use of rates deferral (n=166)<br>
slide71. Productivity Commission 2015, Housing Decisions of Older Australians, Commission Research Paper, Canberra.
www.pc.gov.au<br>