
DELETE THIS SLIDE PRIOR TO PRESENTATION This


Description: DELETE THIS SLIDE PRIOR TO PRESENTATION This PowerPoint serves as a template presentation which introduces topics related to air quality and is part of a suite of presentations provided by the EPA for the Megacities program. See speaker
Related Topics
Download Presentation
"DELETE THIS SLIDE PRIOR TO PRESENTATION This" is the property of its rightful owner. Permission is granted to download and print the materials on this website for personal, non-commercial use only, and to display it on your personal computer provided you do not modify the materials and that you retain all copyright notices contained in the materials. By downloading content from our website, you accept the terms of this agreement.
Presentation Transcript
slide1. DELETE THIS SLIDE PRIOR TO PRESENTATION This PowerPoint serves as a template presentation which introduces topics related to air quality and is part of a suite of presentations provided by the EPA for the Megacities program.
See speaker notes for an additional description of slide content. Slides should be edited or added to as necessary for your particular needs. Slides with highlighted yellow text require the addition of specific context and information for your city. 1<br>
slide2. Air Quality Modeling<br>
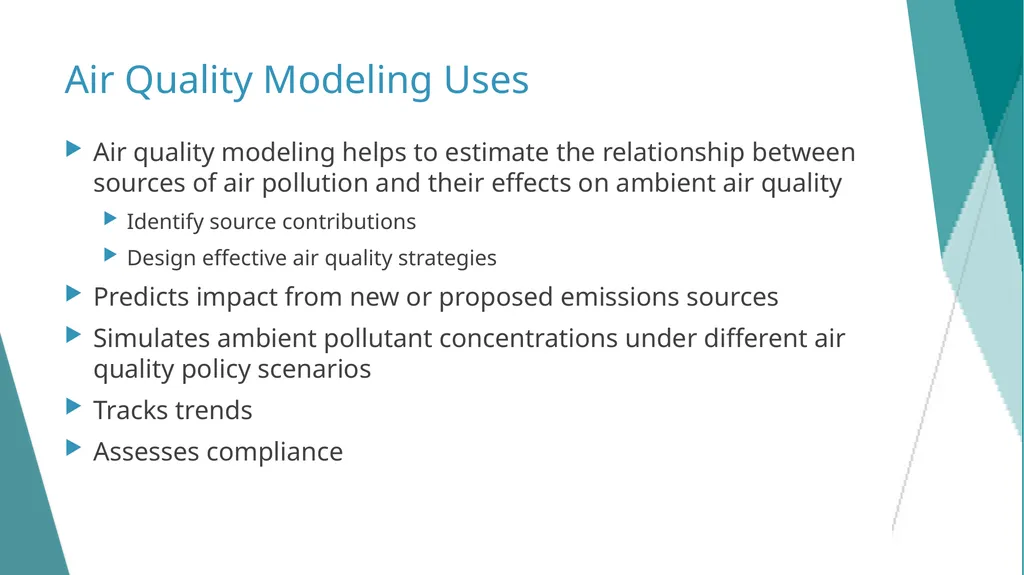
slide3. Air Quality Modeling Uses Air quality modeling helps to estimate the relationship between sources of air pollution and their effects on ambient air quality
Identify source contributions
Design effective air quality strategies
Predicts impact from new or proposed emissions sources
Simulates ambient pollutant concentrations under different air quality policy scenarios
Tracks trends
Assesses compliance 3<br>
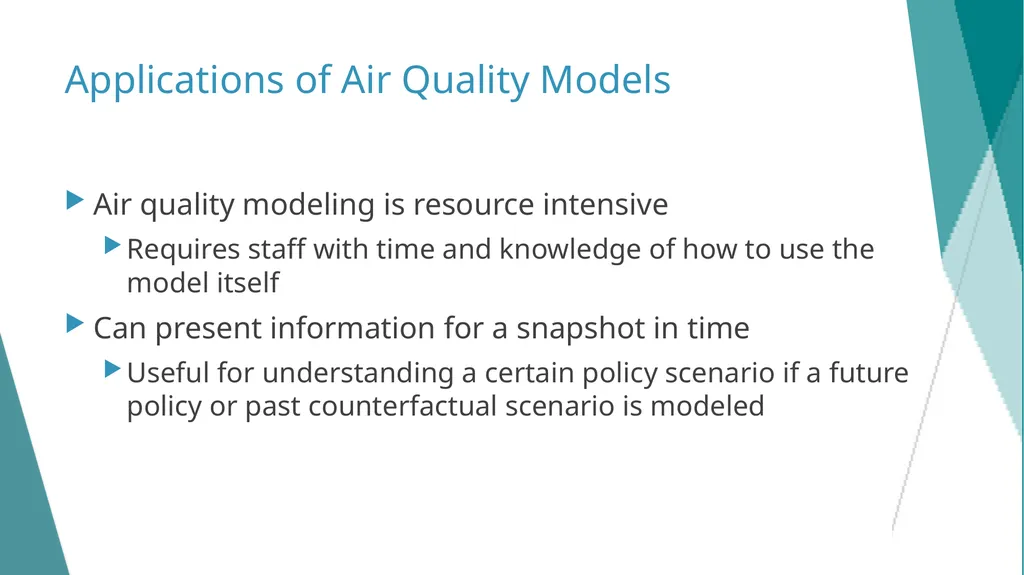
slide4. Applications of Air Quality Models Air quality modeling is resource intensive
Requires staff with time and knowledge of how to use the model itself
Can present information for a snapshot in time
Useful for understanding a certain policy scenario if a future policy or past counterfactual scenario is modeled 4<br>
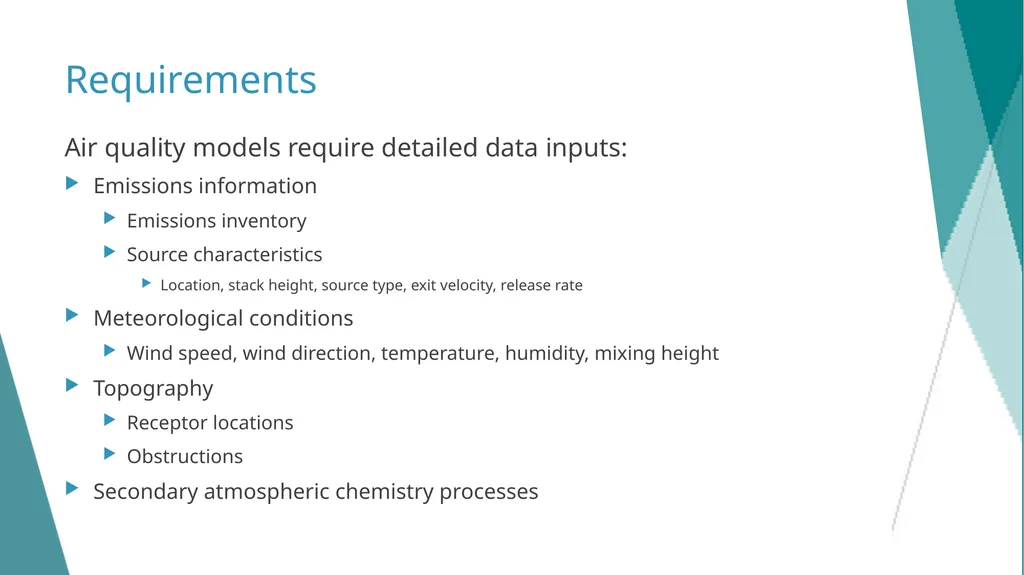
slide5. Requirements Air quality models require detailed data inputs:
Emissions information
Emissions inventory
Source characteristics
Location, stack height, source type, exit velocity, release rate
Meteorological conditions
Wind speed, wind direction, temperature, humidity, mixing height
Topography
Receptor locations
Obstructions
Secondary atmospheric chemistry processes 5<br>
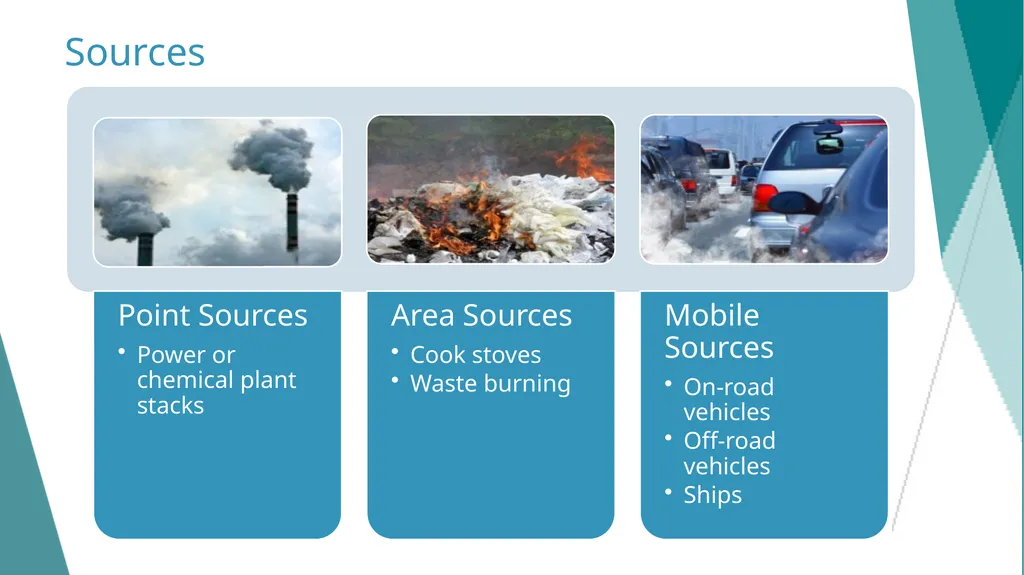
slide6. Sources 6<br>
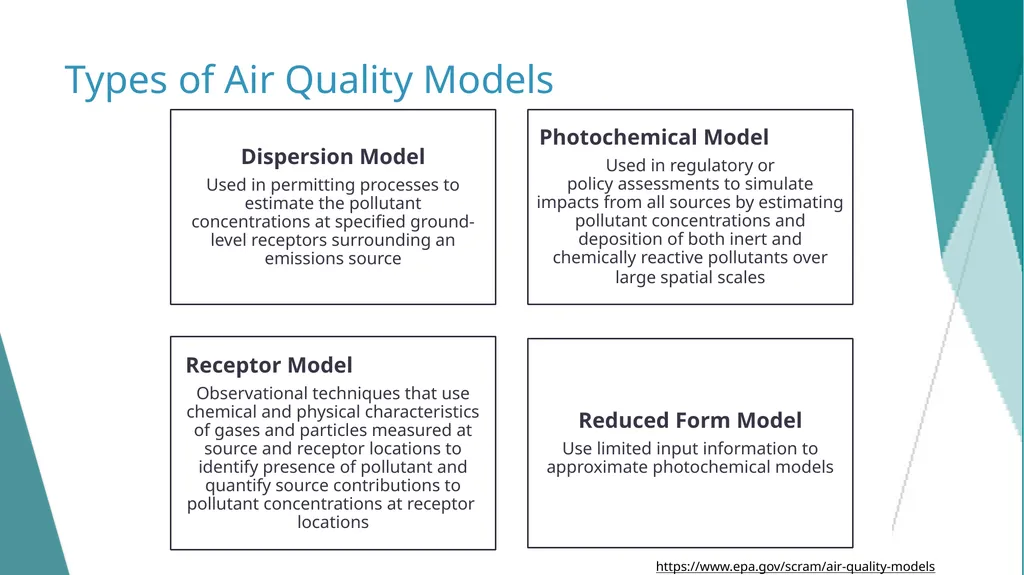
slide7. Types of Air Quality Models https://www.epa.gov/scram/air-quality-models 7<br>
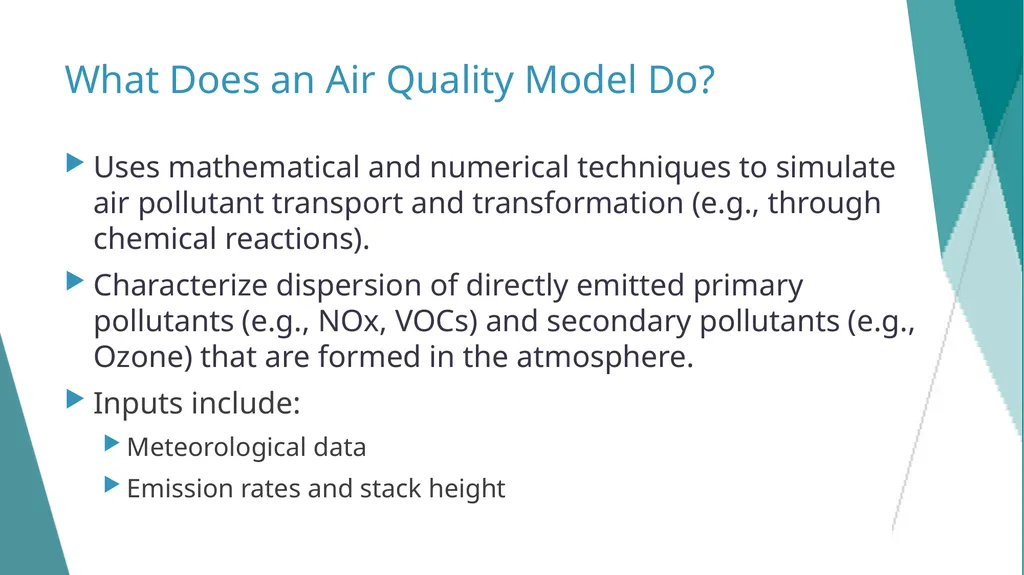
slide8. What Does an Air Quality Model Do? Uses mathematical and numerical techniques to simulate air pollutant transport and transformation (e.g., through chemical reactions).
Characterize dispersion of directly emitted primary pollutants (e.g., NOx, VOCs) and secondary pollutants (e.g., Ozone) that are formed in the atmosphere.
Inputs include:
Meteorological data
Emission rates and stack height 8<br>
slide9. How Are Air Quality Models Used? Estimate exposure to pollutants
Identify current pollutant source contributions
Design effective pollution reduction strategies
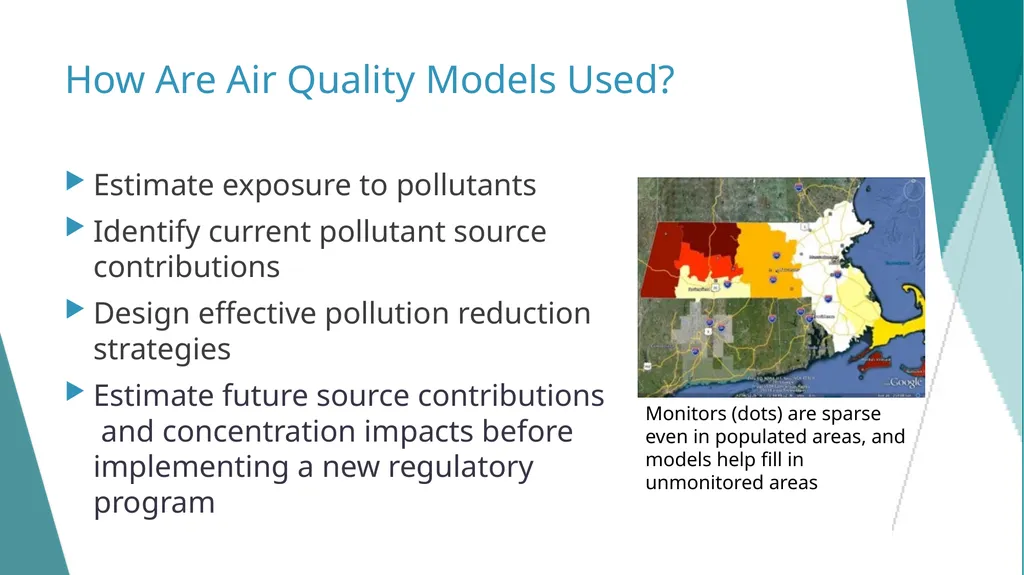
Estimate future source contributions and concentration impacts before implementing a new regulatory program Monitors (dots) are sparse even in populated areas, and models help fill in unmonitored areas 9<br>
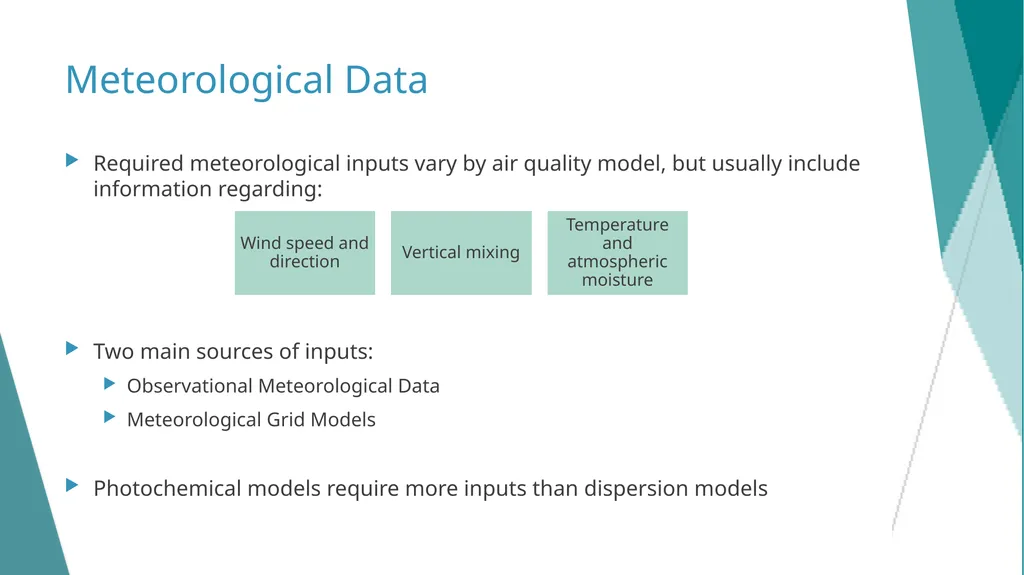
slide10. Meteorological Data Required meteorological inputs vary by air quality model, but usually include information regarding: Two main sources of inputs:
Observational Meteorological Data
Meteorological Grid Models
Photochemical models require more inputs than dispersion models 10<br>
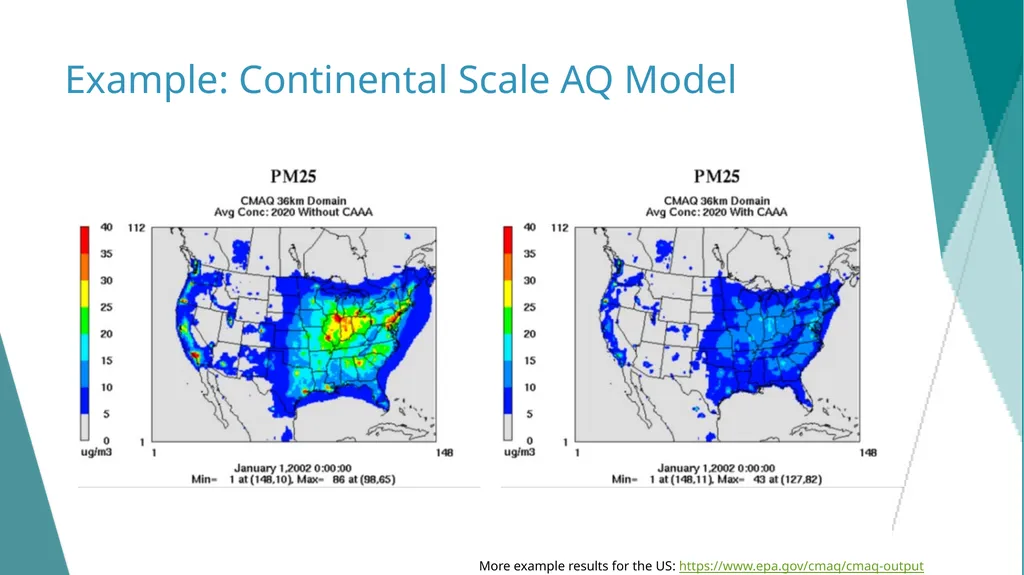
slide11. Example: Continental Scale AQ Model More example results for the US: https://www.epa.gov/cmaq/cmaq-output 11<br>
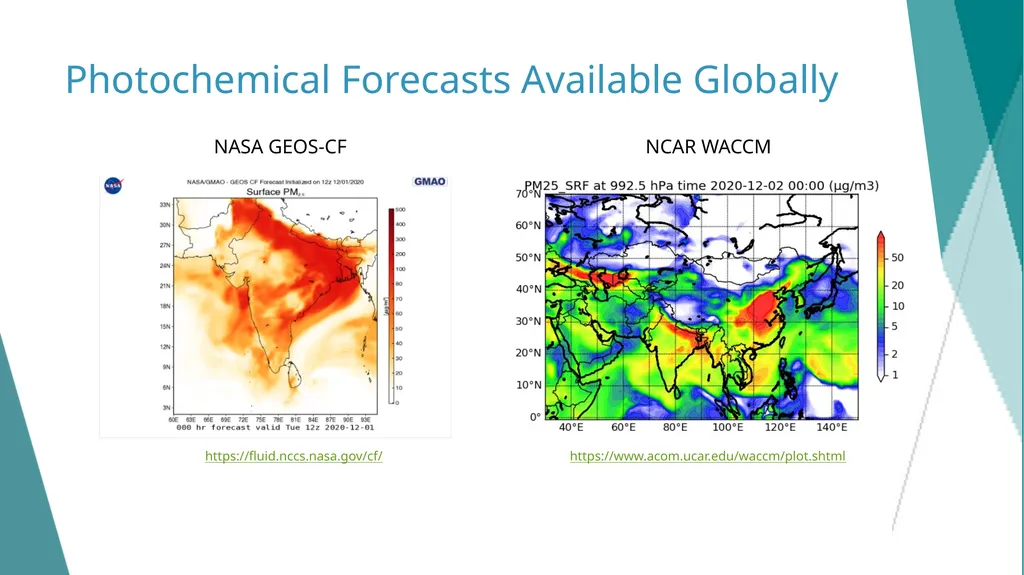
slide12. Photochemical Forecasts Available Globally NASA GEOS-CF https://fluid.nccs.nasa.gov/cf/ NCAR WACCM https://www.acom.ucar.edu/waccm/plot.shtml 12<br>
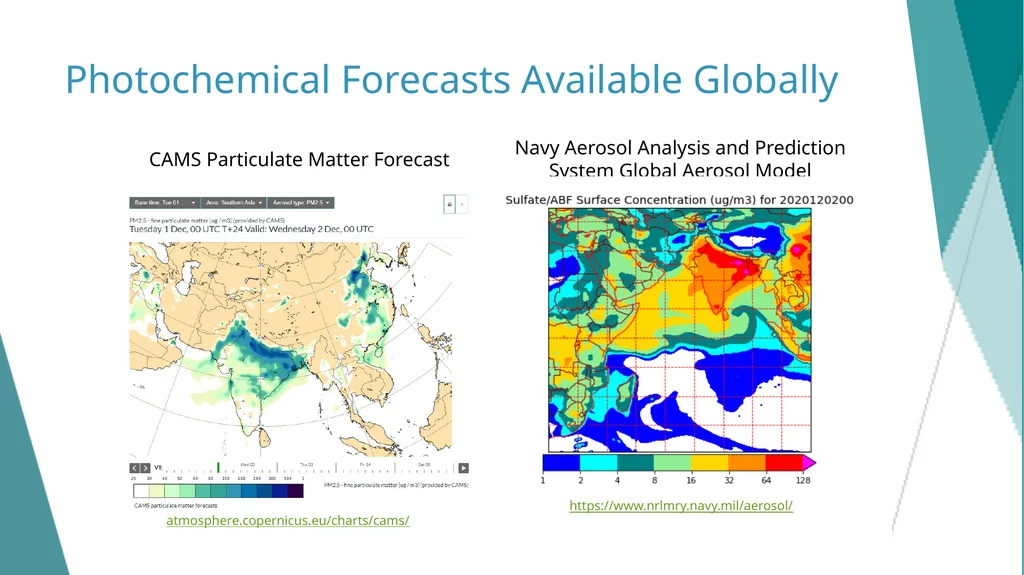
slide13. Photochemical Forecasts Available Globally CAMS Particulate Matter Forecast atmosphere.copernicus.eu/charts/cams/ Navy Aerosol Analysis and Prediction System Global Aerosol Model https://www.nrlmry.navy.mil/aerosol/ 13<br>
slide14. Thank you! 14<br>
See speaker notes for an additional description of slide content. Slides should be edited or added to as necessary for your particular needs. Slides with highlighted yellow text require the addition of specific context and information for your city. 1<br>
slide2. Air Quality Modeling<br>
slide3. Air Quality Modeling Uses Air quality modeling helps to estimate the relationship between sources of air pollution and their effects on ambient air quality
Identify source contributions
Design effective air quality strategies
Predicts impact from new or proposed emissions sources
Simulates ambient pollutant concentrations under different air quality policy scenarios
Tracks trends
Assesses compliance 3<br>
slide4. Applications of Air Quality Models Air quality modeling is resource intensive
Requires staff with time and knowledge of how to use the model itself
Can present information for a snapshot in time
Useful for understanding a certain policy scenario if a future policy or past counterfactual scenario is modeled 4<br>
slide5. Requirements Air quality models require detailed data inputs:
Emissions information
Emissions inventory
Source characteristics
Location, stack height, source type, exit velocity, release rate
Meteorological conditions
Wind speed, wind direction, temperature, humidity, mixing height
Topography
Receptor locations
Obstructions
Secondary atmospheric chemistry processes 5<br>
slide6. Sources 6<br>
slide7. Types of Air Quality Models https://www.epa.gov/scram/air-quality-models 7<br>
slide8. What Does an Air Quality Model Do? Uses mathematical and numerical techniques to simulate air pollutant transport and transformation (e.g., through chemical reactions).
Characterize dispersion of directly emitted primary pollutants (e.g., NOx, VOCs) and secondary pollutants (e.g., Ozone) that are formed in the atmosphere.
Inputs include:
Meteorological data
Emission rates and stack height 8<br>
slide9. How Are Air Quality Models Used? Estimate exposure to pollutants
Identify current pollutant source contributions
Design effective pollution reduction strategies
Estimate future source contributions and concentration impacts before implementing a new regulatory program Monitors (dots) are sparse even in populated areas, and models help fill in unmonitored areas 9<br>
slide10. Meteorological Data Required meteorological inputs vary by air quality model, but usually include information regarding: Two main sources of inputs:
Observational Meteorological Data
Meteorological Grid Models
Photochemical models require more inputs than dispersion models 10<br>
slide11. Example: Continental Scale AQ Model More example results for the US: https://www.epa.gov/cmaq/cmaq-output 11<br>
slide12. Photochemical Forecasts Available Globally NASA GEOS-CF https://fluid.nccs.nasa.gov/cf/ NCAR WACCM https://www.acom.ucar.edu/waccm/plot.shtml 12<br>
slide13. Photochemical Forecasts Available Globally CAMS Particulate Matter Forecast atmosphere.copernicus.eu/charts/cams/ Navy Aerosol Analysis and Prediction System Global Aerosol Model https://www.nrlmry.navy.mil/aerosol/ 13<br>
slide14. Thank you! 14<br>