Descriptive and Inferential Statistic Dr. Dyal Bhatnagar STATISTICS Manipulating Data to get meaningful inferences out of it. Data is plural or singular? Variables Metric (Continuous) Ratio Variable Interval Variable Non-Metric
"Descriptive and Inferential Statistic Dr. Dyal" is the property of its rightful owner. Permission is granted to
download and print the materials on this website for personal, non-commercial use only, and to display it
on your personal computer provided you do not modify the materials and that you retain all copyright
notices contained in the materials. By downloading content from our website, you accept the terms of this
agreement.
Presentation Transcript
01
Descriptive and Inferential Statistic Dr. Dyal Bhatnagar<br>
02
STATISTICS Manipulating Data to get meaningful inferences out of it.
‘Data’ is plural or singular?<br>
03
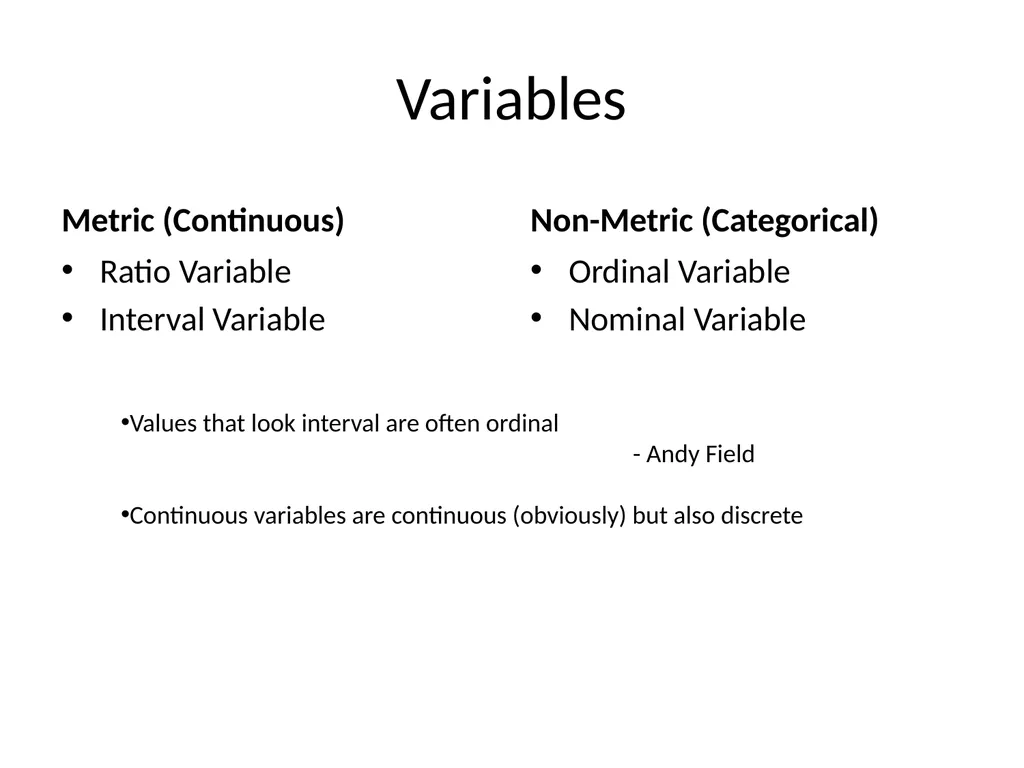
Variables Metric (Continuous) Ratio Variable
Interval Variable Non-Metric (Categorical) Ordinal Variable
Nominal Variable Values that look interval are often ordinal
- Andy Field
Continuous variables are continuous (obviously) but also discrete<br>
04
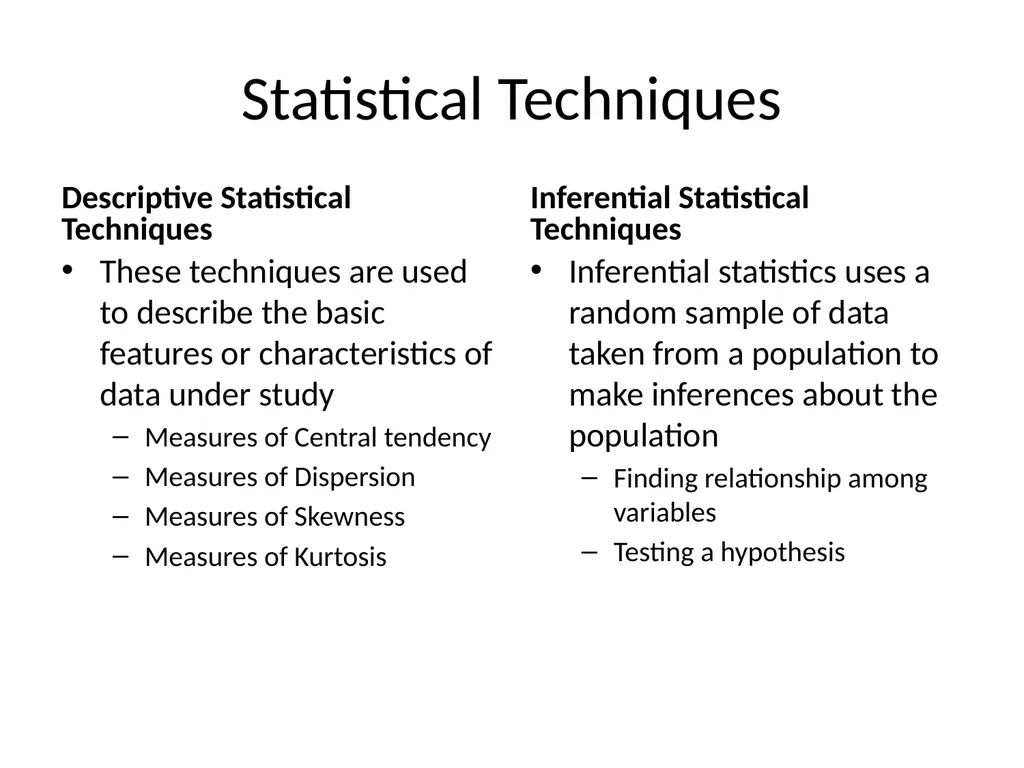
Statistical Techniques Descriptive Statistical Techniques These techniques are used to describe the basic features or characteristics of data under study
Measures of Central tendency
Measures of Dispersion
Measures of Skewness
Measures of Kurtosis Inferential Statistical Techniques Inferential statistics uses a random sample of data taken from a population to make inferences about the population
Finding relationship among variables
Testing a hypothesis<br>
05
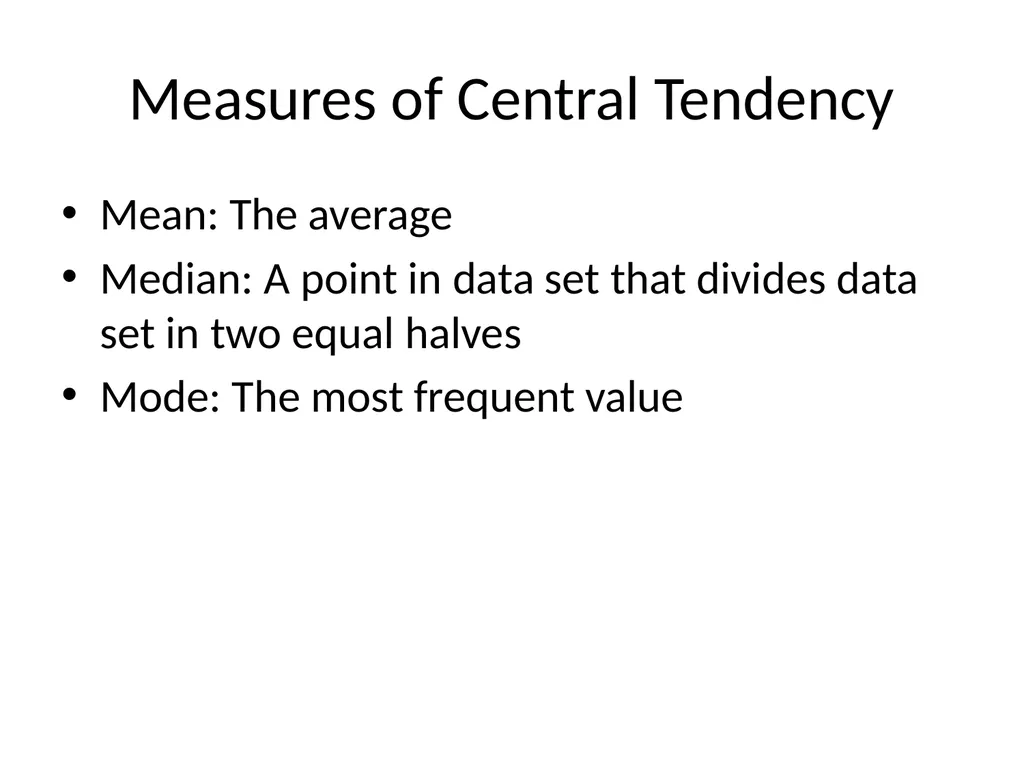
Measures of Central Tendency Mean: The average
Median: A point in data set that divides data set in two equal halves
Mode: The most frequent value<br>
06
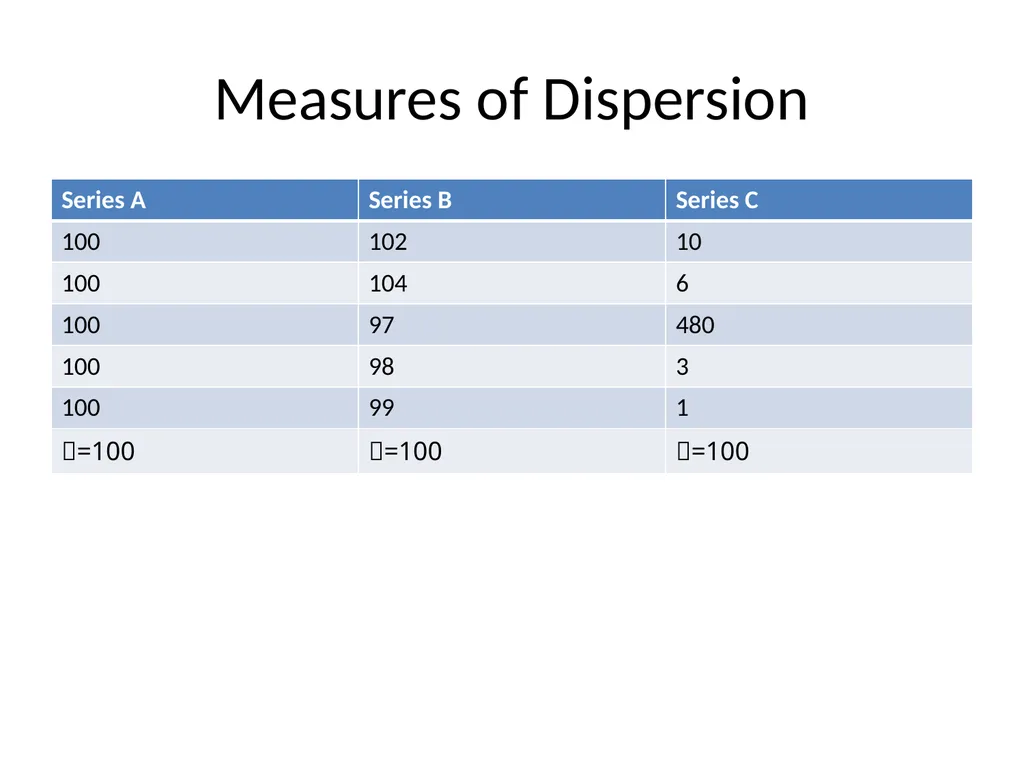
Measures of Dispersion<br>
07
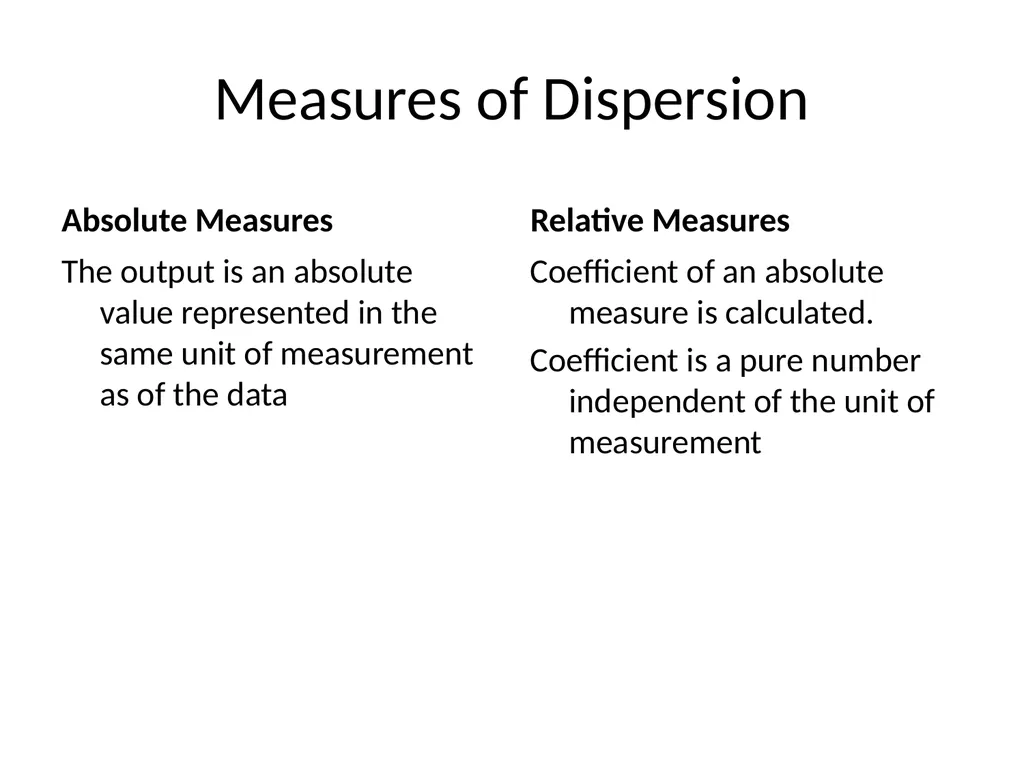
Measures of Dispersion Absolute Measures The output is an absolute value represented in the same unit of measurement as of the data Relative Measures Coefficient of an absolute measure is calculated.
Coefficient is a pure number independent of the unit of measurement<br>
08
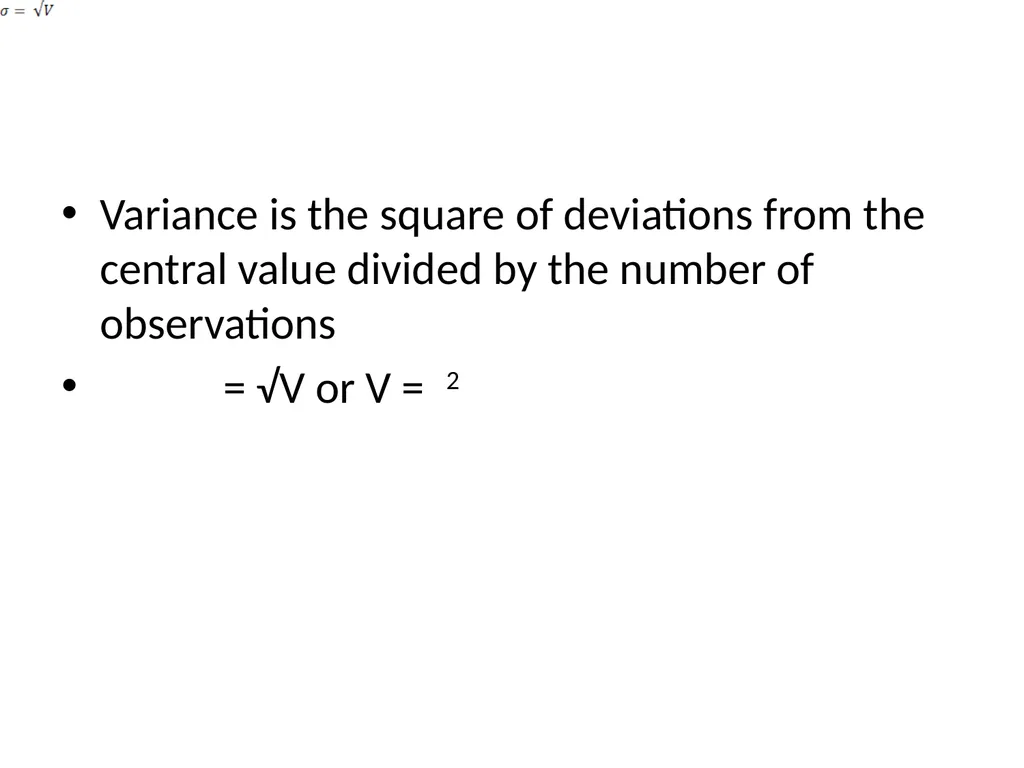
Variance is the square of deviations from the central value divided by the number of observations
= √V or V = 2<br>
09
Skewness and Kurtosis The Dispersion tells about the extent of variation in a distribution, where as, Skewness tells about the direction of variation
Kurtosis tells if the distribution is peaked or flat.<br>
10
Correlation Correlation measures the joint variation among two or more variables.
Correlation does not mean there is causation, but causation always implies correlation.
Negative and positive correlation
Linear and non-linear correlation
Simple, Partial or multiple correlation<br>
11
Regression Measuring cause and effect relationship among two or more variables.
The direction of causation can be either from X to Y or otherwise.
Y = + X<br>
12
Hypothesis Testing<br>
13
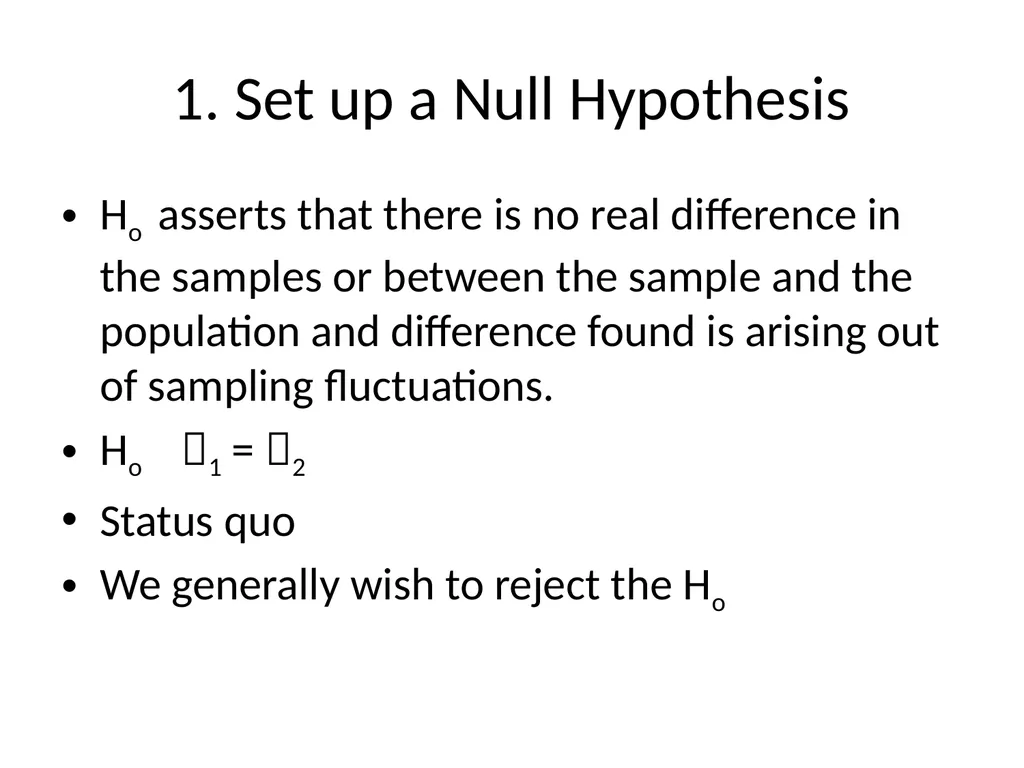
1. Set up a Null Hypothesis Ho asserts that there is no real difference in the samples or between the sample and the population and difference found is arising out of sampling fluctuations.
Ho 1 = 2
Status quo
We generally wish to reject the Ho<br>
14
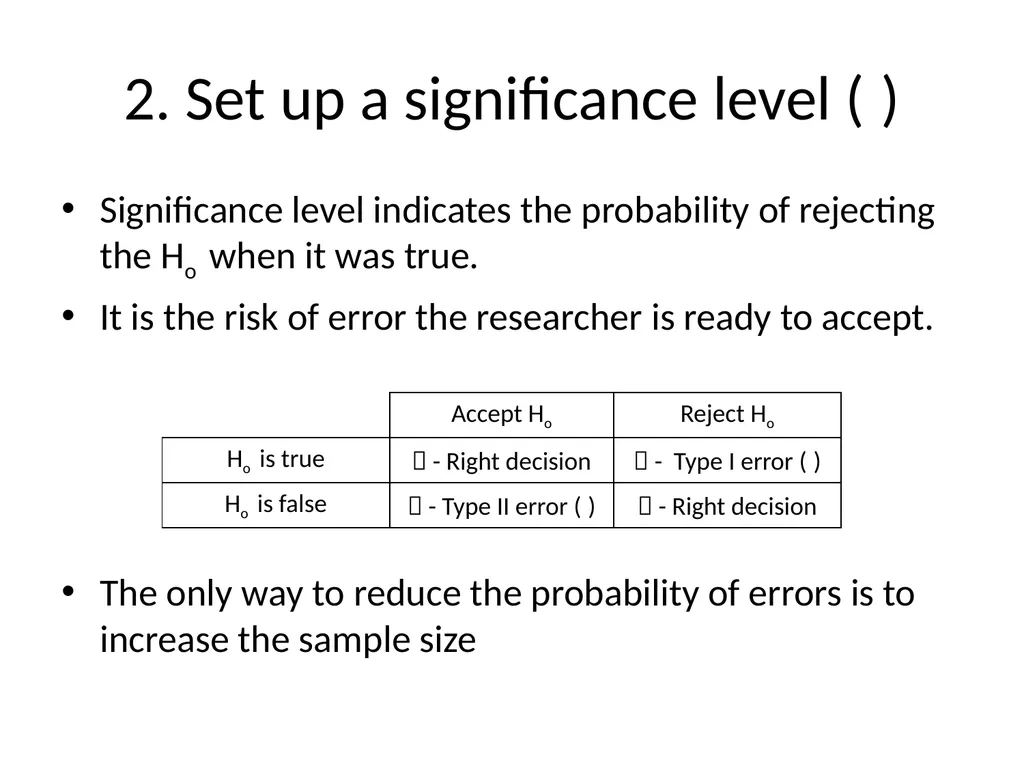
2. Set up a significance level () Significance level indicates the probability of rejecting the Ho when it was true.
It is the risk of error the researcher is ready to accept.
The only way to reduce the probability of errors is to increase the sample size<br>
15
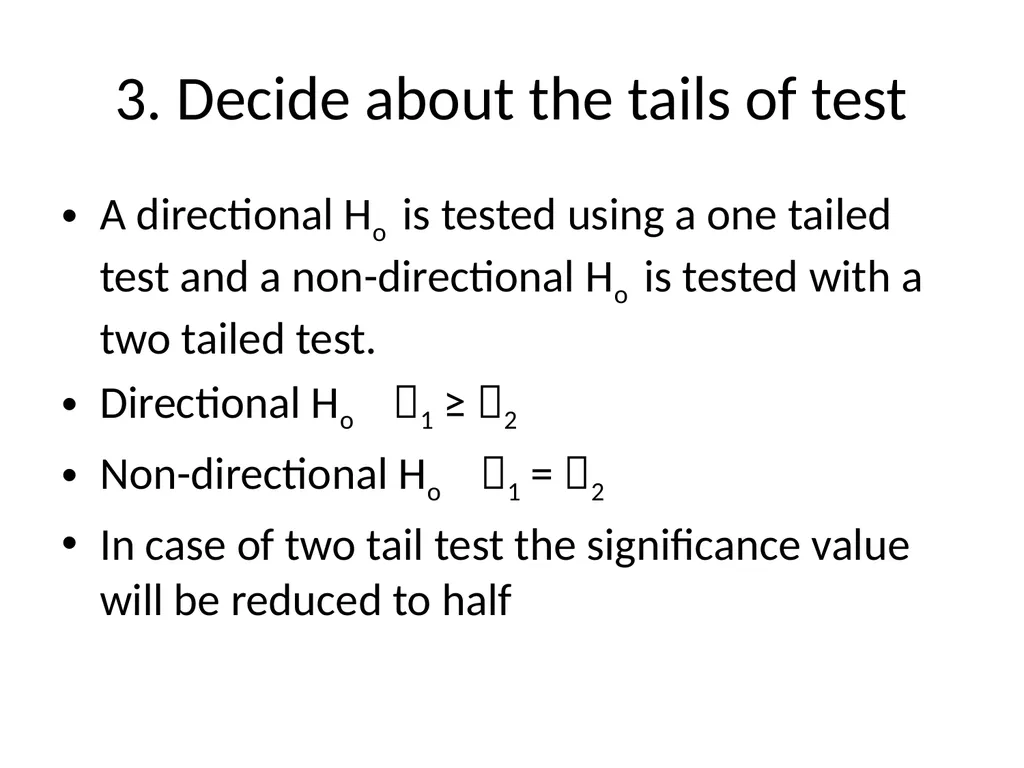
3. Decide about the tails of test A directional Ho is tested using a one tailed test and a non-directional Ho is tested with a two tailed test.
Directional Ho 1 ≥ 2
Non-directional Ho 1 = 2
In case of two tail test the significance value will be reduced to half<br>
16
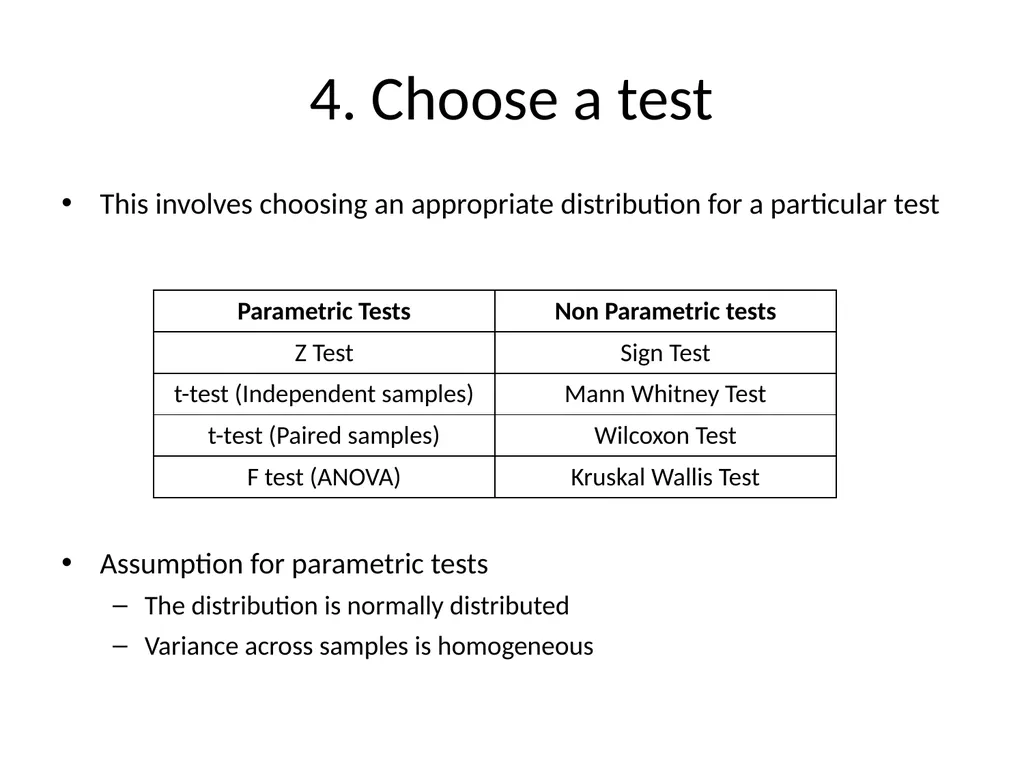
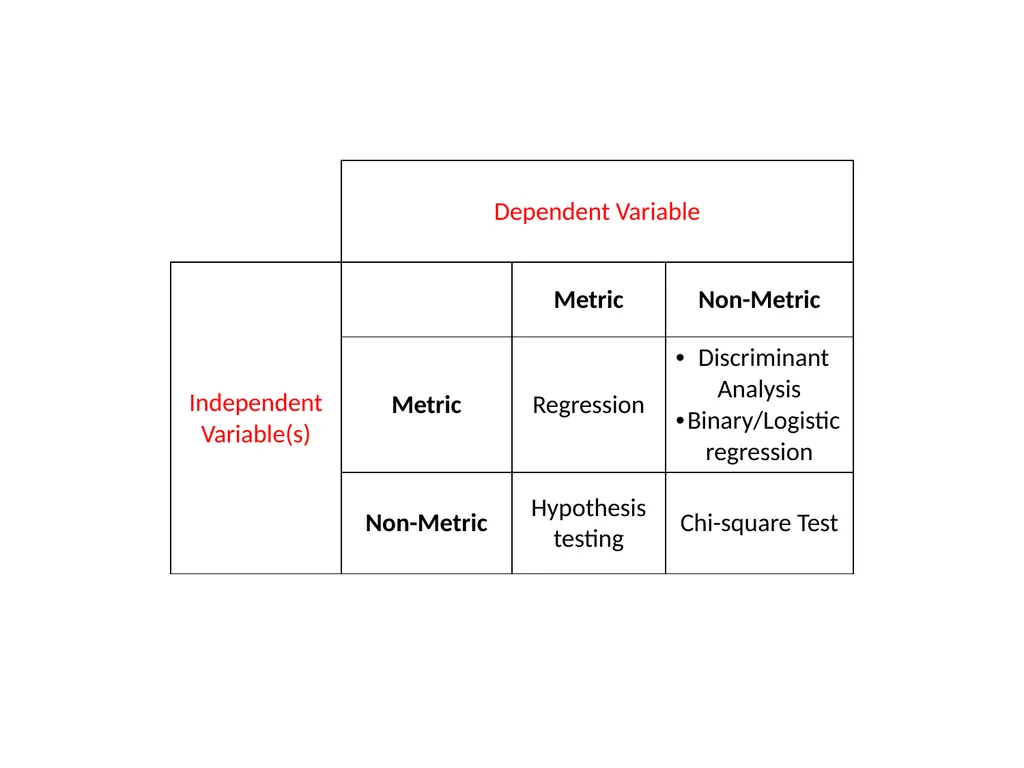
4. Choose a test This involves choosing an appropriate distribution for a particular test
Assumption for parametric tests
The distribution is normally distributed
Variance across samples is homogeneous<br>
17
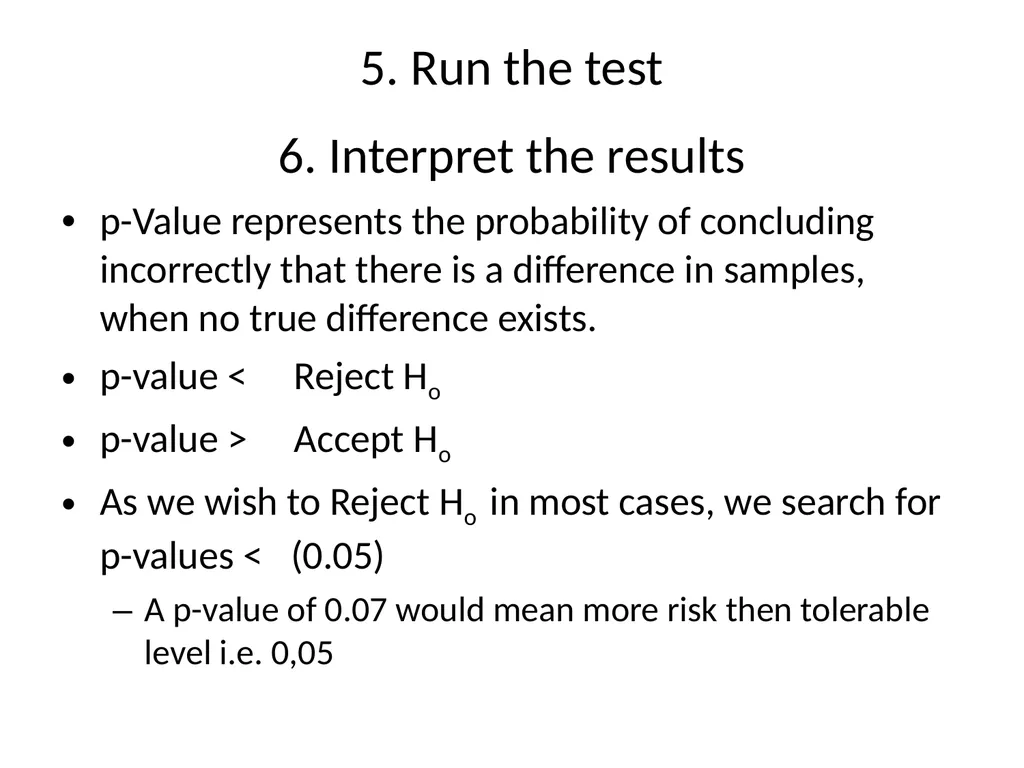
5. Run the test 6. Interpret the results
p-Value represents the probability of concluding incorrectly that there is a difference in samples, when no true difference exists.
p-value < Reject Ho
p-value > Accept Ho
As we wish to Reject Ho in most cases, we search for p-values < (0.05)
A p-value of 0.07 would mean more risk then tolerable level i.e. 0,05<br>