
Effective use of data 4. Interpreting and

Description: Effective use of data 4. Interpreting and analysing data Practitioners The national model of professional learning The national model of professional learning Professional Learning Education Scotland Draft Group Agreement and Protocols
Related Topics
Download Presentation
"Effective use of data 4. Interpreting and" is the property of its rightful owner. Permission is granted to download and print the materials on this website for personal, non-commercial use only, and to display it on your personal computer provided you do not modify the materials and that you retain all copyright notices contained in the materials. By downloading content from our website, you accept the terms of this agreement.
Presentation Transcript
slide1. Effective use of data 4. Interpreting and analysing data
Practitioners<br>
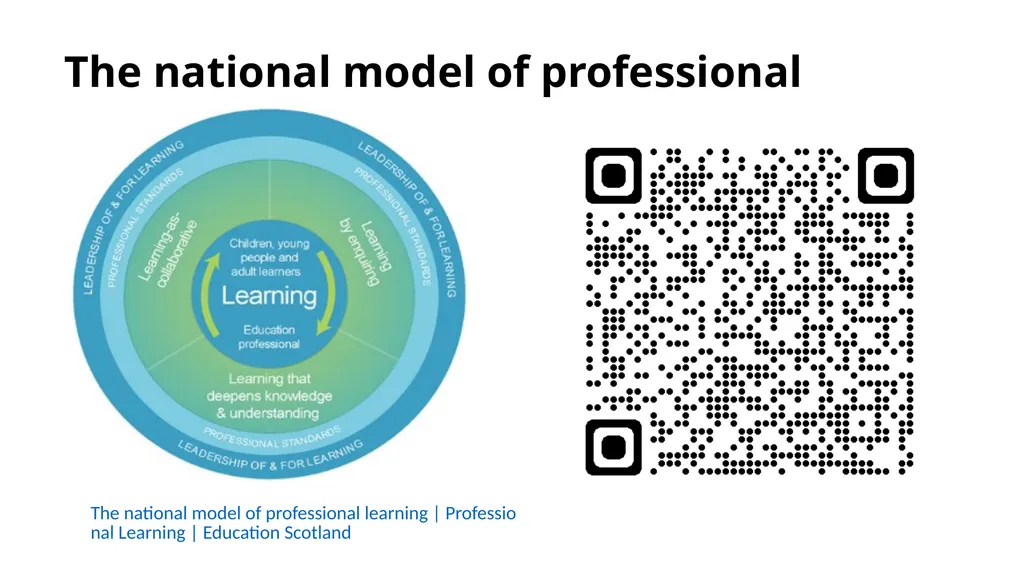
slide2. The national model of professional learning The national model of professional learning | Professional Learning | Education Scotland<br>
slide3. Draft Group Agreement and Protocols Work together
learn from, with, and on behalf of each other
create a safe space to share ideas and build learning
agree that everyone is an equal and valued participant
remain in the room (emails and phone protocol).<br>
slide4. Connector In groups/pairs:
Share the job you thought you might do when you were a child/teenager?<br>
slide5. Re-cap In workshop 1 we looked at the purpose and use of data including: the meaning of data and evidence, the ways in which data is used and what we mean by ‘big’ and ‘small’ data.
In workshop 2 we considered different categories of data and how these may be intersected to support improvement.
In workshop 3 we examined how we create effective systems and processes<br>
slide6. Aims In this workshop we will consider:
national guidance and research including signposting to national data sets
questions to explore when analysing and interpreting data
the use of comparator data, and
how to use a data analysis to inform next steps.<br>
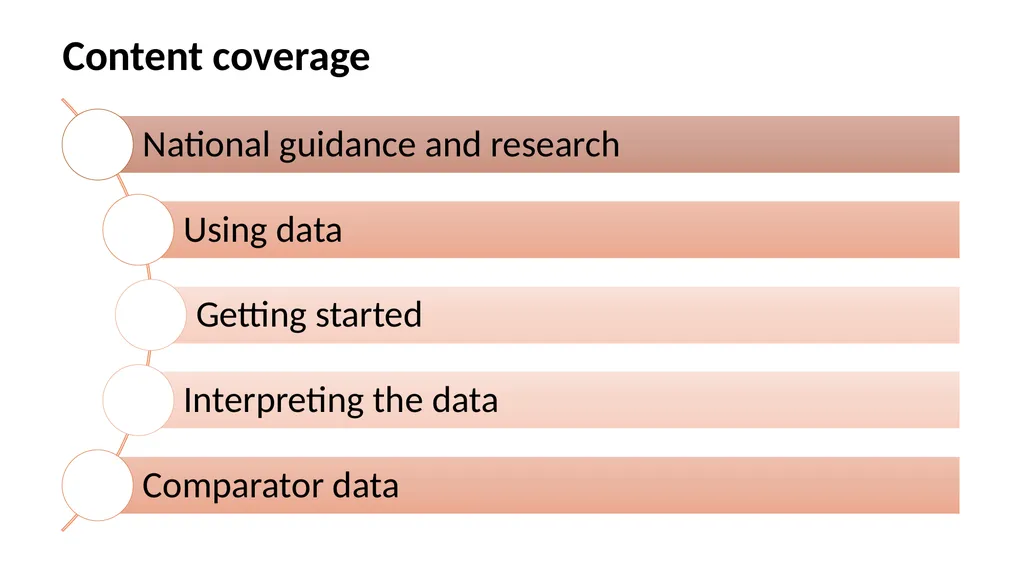
slide7. Content coverage<br>
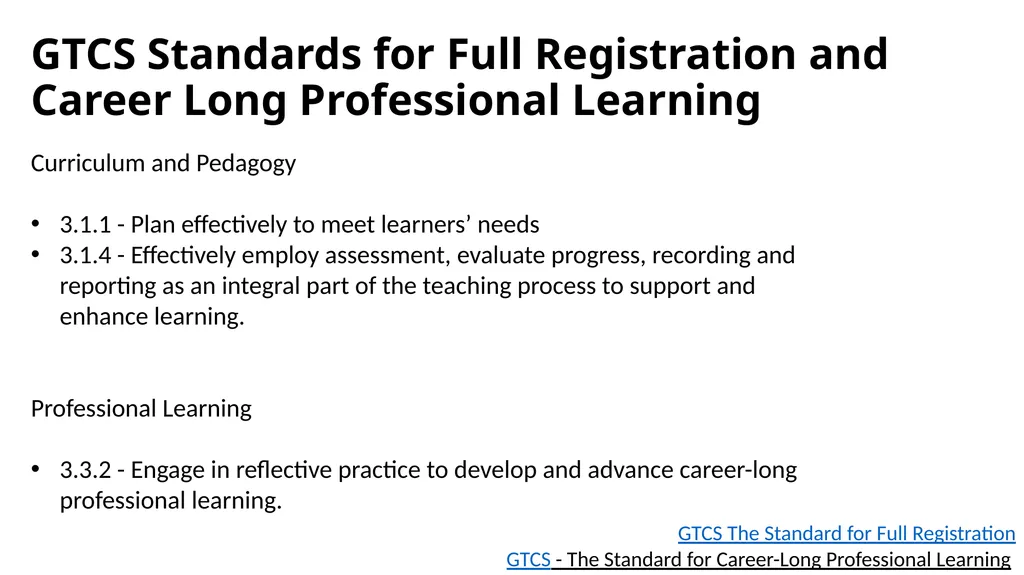
slide8. GTCS Standards for Full Registration and Career Long Professional Learning Curriculum and Pedagogy
3.1.1 - Plan effectively to meet learners’ needs
3.1.4 - Effectively employ assessment, evaluate progress, recording and reporting as an integral part of the teaching process to support and enhance learning.
Professional Learning
3.3.2 - Engage in reflective practice to develop and advance career-long professional learning. GTCS The Standard for Full Registration
GTCS - The Standard for Career-Long Professional Learning<br>
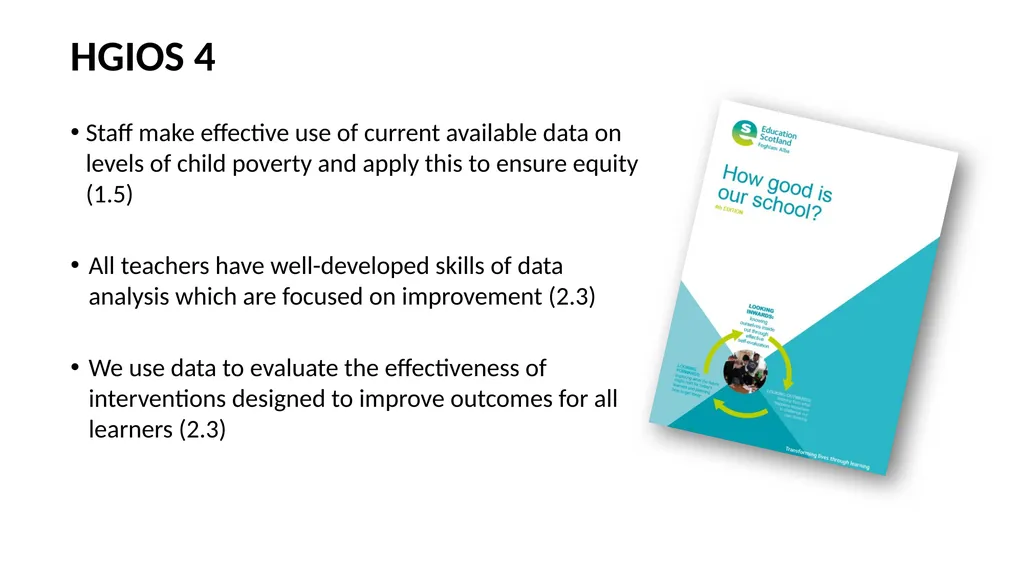
slide9. HGIOS 4 Staff make effective use of current available data on levels of child poverty and apply this to ensure equity (1.5)
All teachers have well-developed skills of data analysis which are focused on improvement (2.3)
We use data to evaluate the effectiveness of interventions designed to improve outcomes for all learners (2.3)<br>
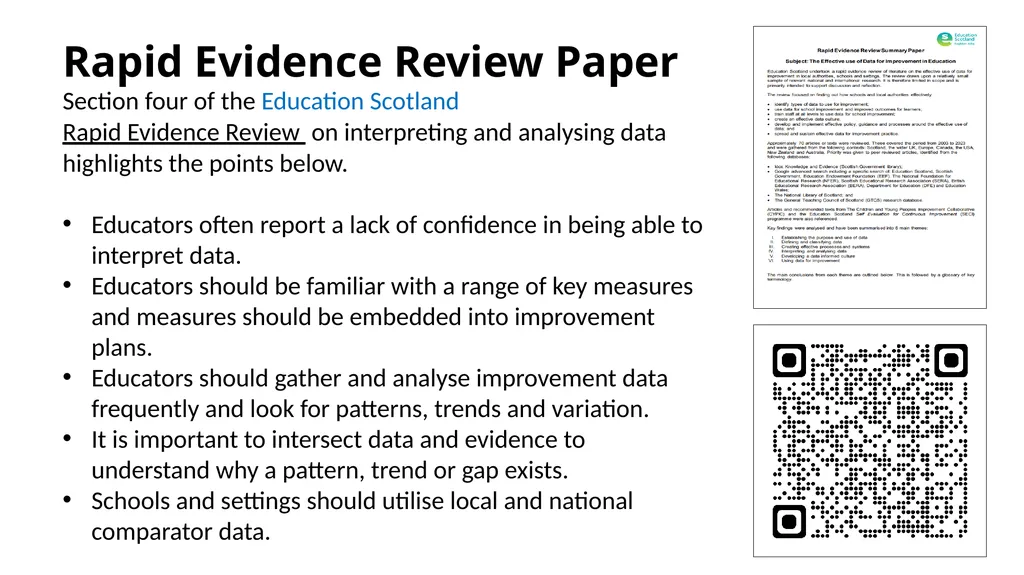
slide10. Rapid Evidence Review Paper Section four of the Education Scotland Rapid Evidence Review on interpreting and analysing data highlights the points below.
Educators often report a lack of confidence in being able to interpret data.
Educators should be familiar with a range of key measures and measures should be embedded into improvement plans.
Educators should gather and analyse improvement data frequently and look for patterns, trends and variation.
It is important to intersect data and evidence to understand why a pattern, trend or gap exists.
Schools and settings should utilise local and national comparator data.<br>
slide11. Using data Data analysis involves examining information and breaking it down for understanding and meaning.
To analyse data effectively educators should be confident in:
reading and interpreting a range of common tables, charts and diagrams, and
analysing and utilising the information gathered to inform improvement.<br>
slide12. Reflection activity “Using data is not separate from planning and from routine decisions in schools. Instead, data is a necessary part of an ongoing process of analysis, insight, new learning and changes in practice.”
(Lorna M Earl and Steven Katz, 2009) How confident do we feel when it comes to analysing data?
What school / classroom level data do we currently analyse?
How do we currently utilise this data to inform improvement?<br>
slide13. How do we start to analyse data? Key questions to ask:
What do we wish to explore or find out?
Which data sets will help us to do this?
Is the data we plan to look at easily available and reliable?<br>
slide14. What are we looking for? Examples:
evidence of progress/ lack of progress
surprising outcomes/anomalies (good and bad)
patterns or trends emerging over time
gaps in attainment
the impact of a change we have implemented
to make comparisons in relation to local/national data.<br>
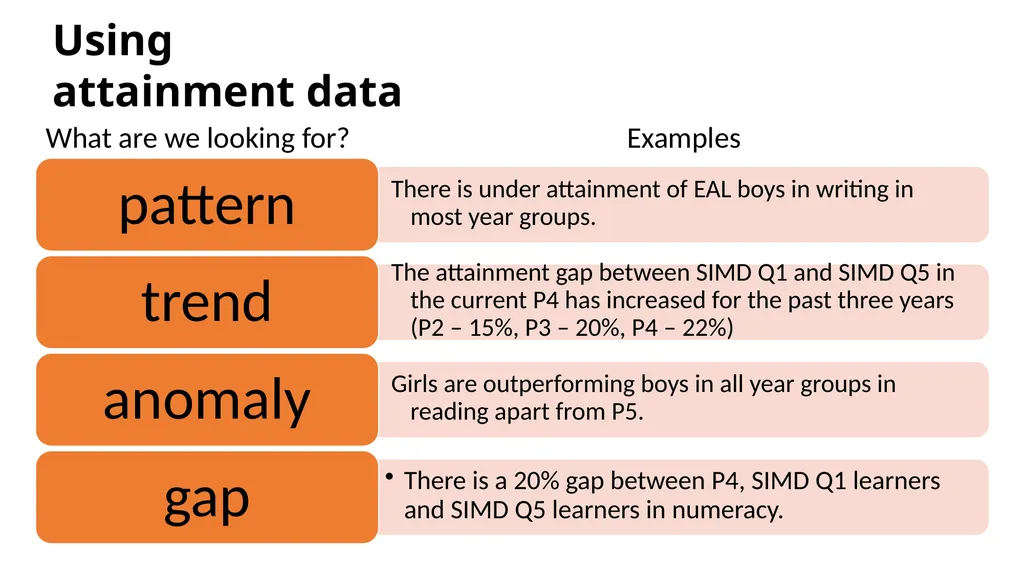
slide15. Using attainment data What are we looking for? Examples<br>
slide16. Which data sets will help us do this? Examples:
class/setting checklists or spreadsheets
establishment tracking files (if available)
local authority tracking tools (if available)
national data tools, e.g. ACEL data, Insight data(secondary), BGE benchmarking tool.<br>
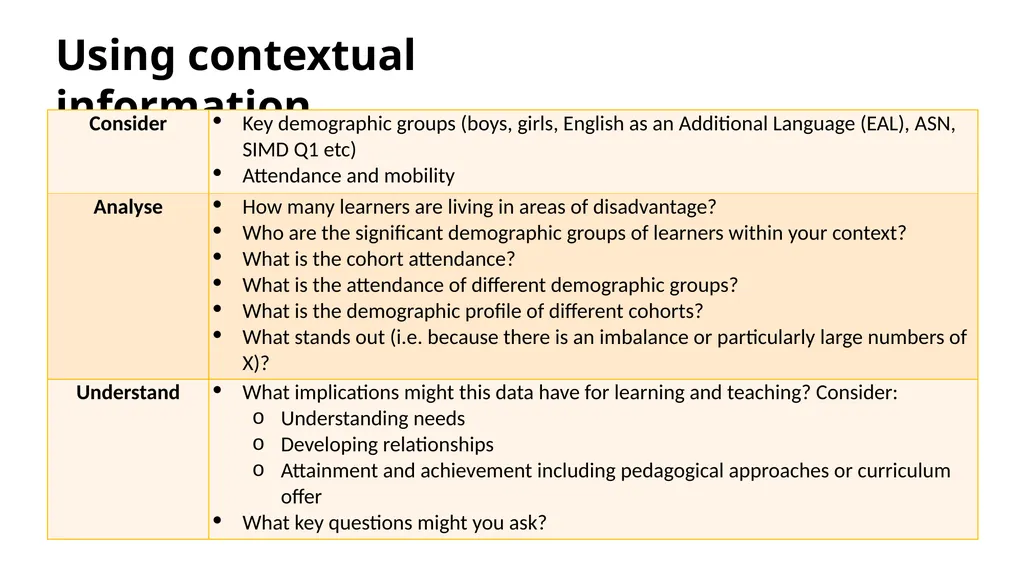
slide17. Using contextual information<br>
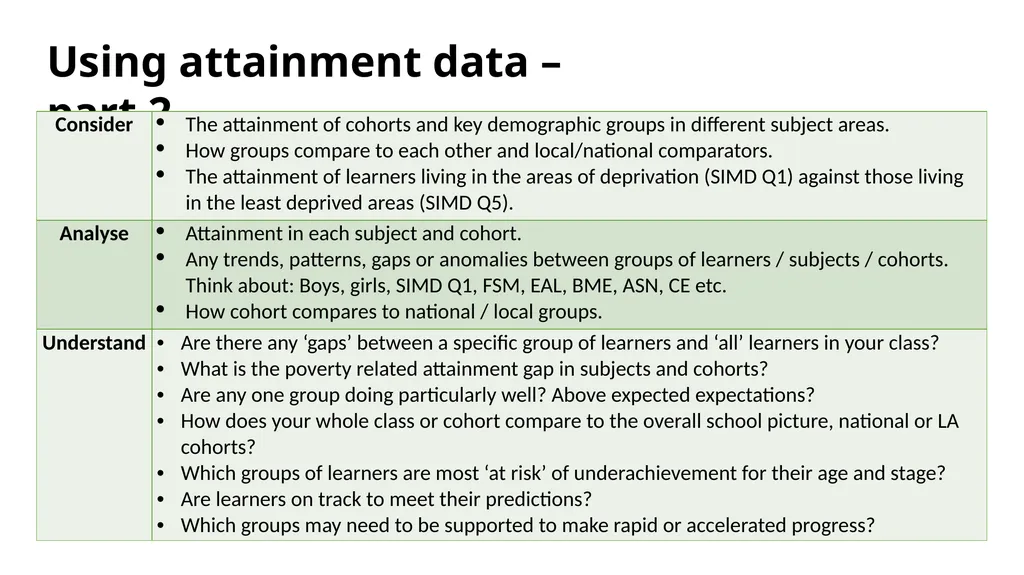
slide18. Using attainment data – part 2<br>
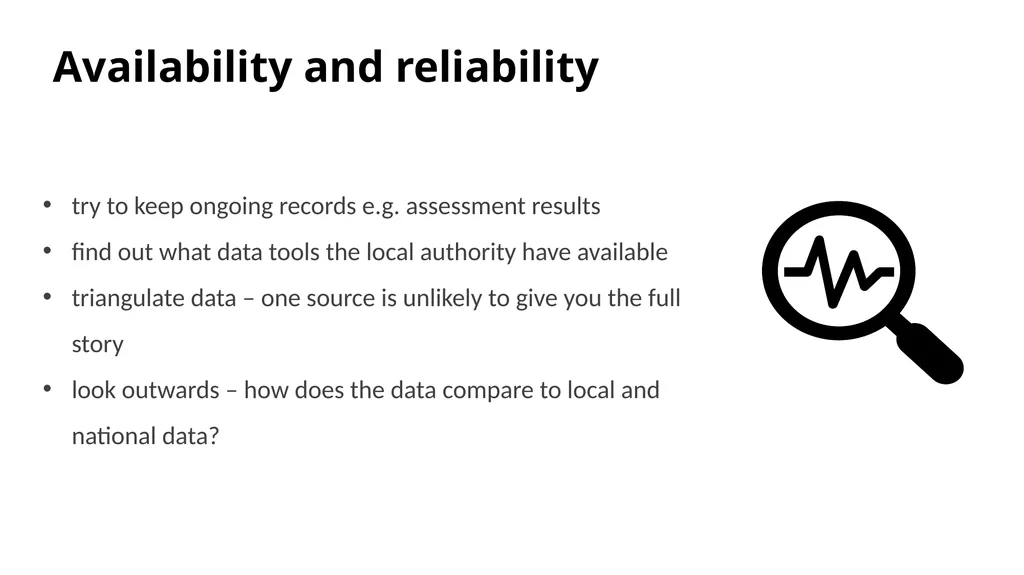
slide19. Availability and reliability try to keep ongoing records e.g. assessment results
find out what data tools the local authority have available
triangulate data – one source is unlikely to give you the full story
look outwards – how does the data compare to local and national data?<br>
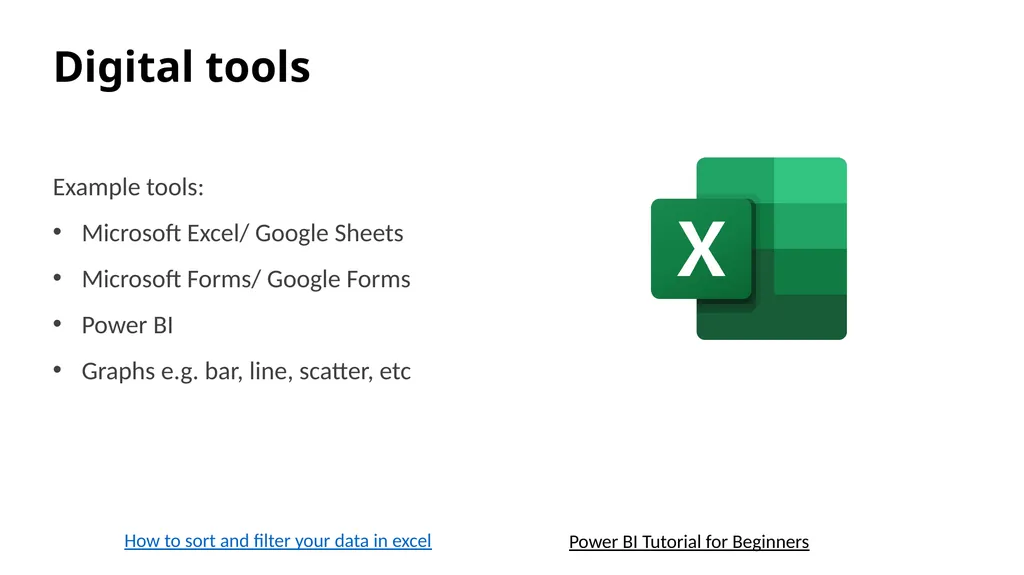
slide20. Digital tools Example tools:
Microsoft Excel/ Google Sheets
Microsoft Forms/ Google Forms
Power BI
Graphs e.g. bar, line, scatter, etc How to sort and filter your data in excel Power BI Tutorial for Beginners<br>
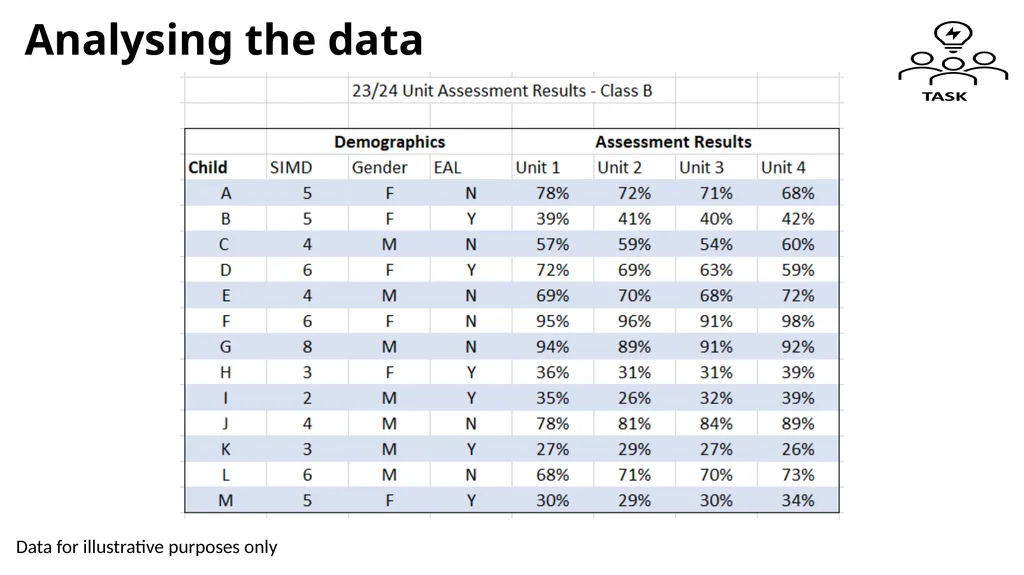
slide21. Analysing the data Data for illustrative purposes only<br>
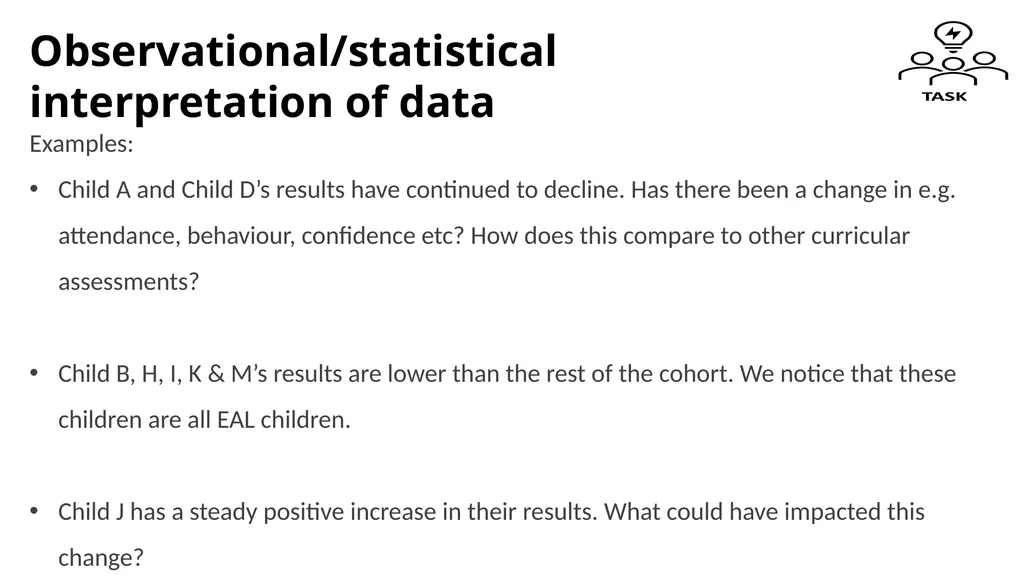
slide22. Observational/statistical interpretation of data Examples:
Child A and Child D’s results have continued to decline. Has there been a change in e.g. attendance, behaviour, confidence etc? How does this compare to other curricular assessments?
Child B, H, I, K & M’s results are lower than the rest of the cohort. We notice that these children are all EAL children.
Child J has a steady positive increase in their results. What could have impacted this change?<br>
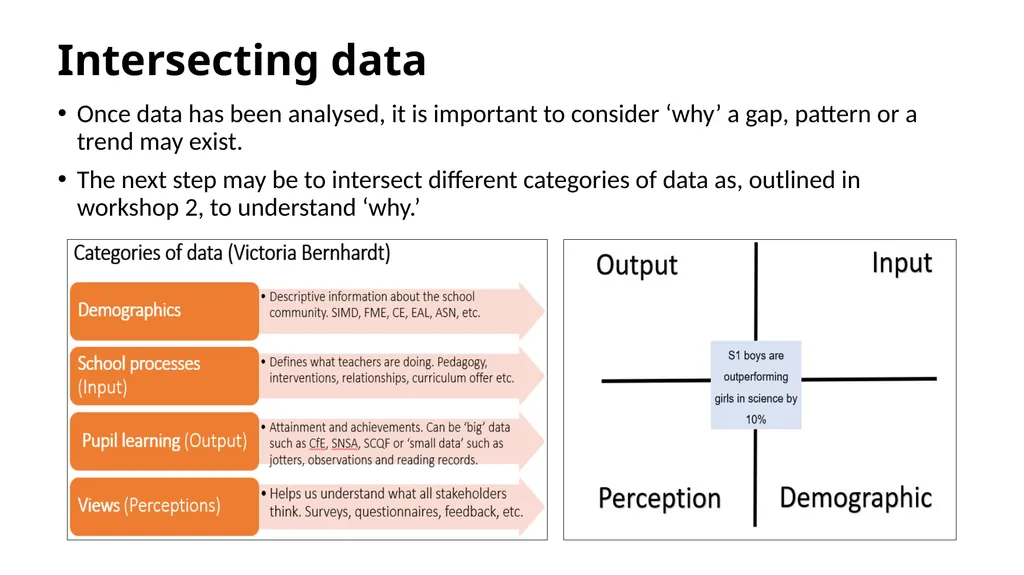
slide23. Intersecting data Once data has been analysed, it is important to consider ‘why’ a gap, pattern or a trend may exist.
The next step may be to intersect different categories of data as, outlined in workshop 2, to understand ‘why.’<br>
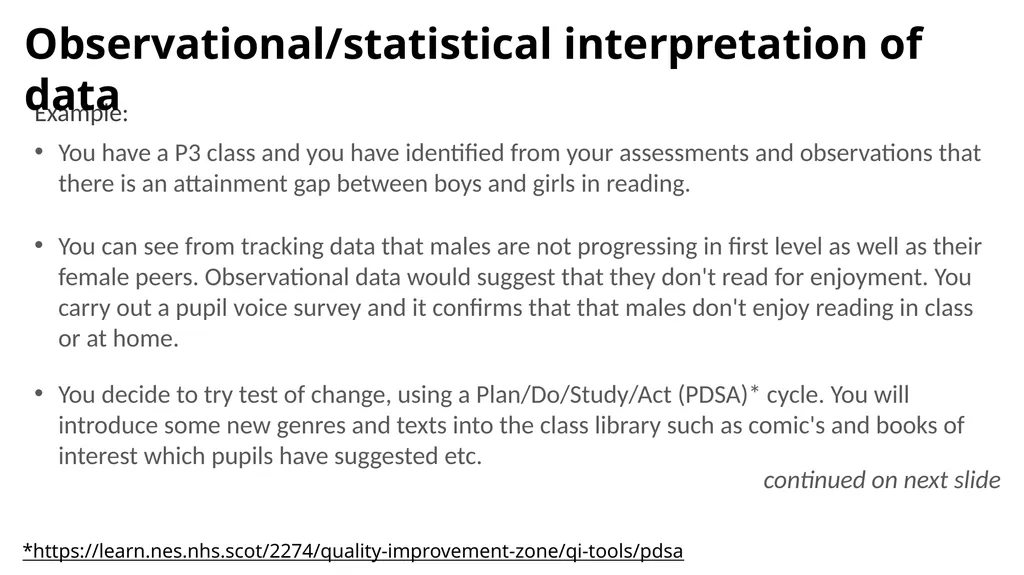
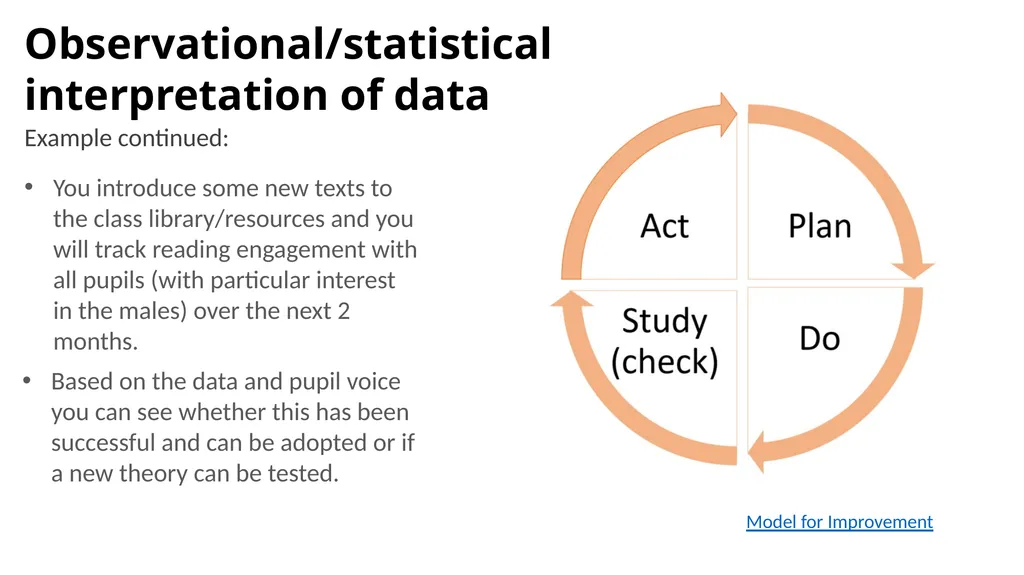
slide24. Example: Observational/statistical interpretation of data You have a P3 class and you have identified from your assessments and observations that there is an attainment gap between boys and girls in reading. You can see from tracking data that males are not progressing in first level as well as their female peers. Observational data would suggest that they don't read for enjoyment. You carry out a pupil voice survey and it confirms that that males don't enjoy reading in class or at home. You decide to try test of change, using a Plan/Do/Study/Act (PDSA)* cycle. You will introduce some new genres and texts into the class library such as comic's and books of interest which pupils have suggested etc. continued on next slide *https://learn.nes.nhs.scot/2274/quality-improvement-zone/qi-tools/pdsa<br>
slide25. Example continued: Observational/statistical interpretation of data You introduce some new texts to the class library/resources and you will track reading engagement with all pupils (with particular interest in the males) over the next 2 months. Based on the data and pupil voice you can see whether this has been successful and can be adopted or if a new theory can be tested. Model for Improvement<br>
slide26. Local examples of data – tables, charts, graphs This slide is a place holder for facilitators to consider adding in any local authority examples of data.
This slide can be added to or removed as appropriate.<br>
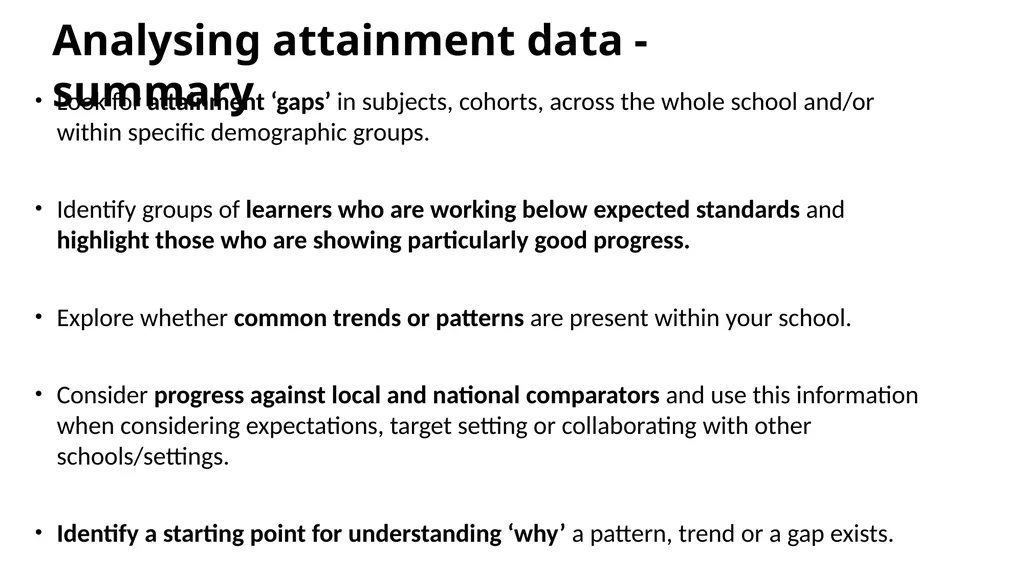
slide27. Analysing attainment data - summary Look for attainment ‘gaps’ in subjects, cohorts, across the whole school and/or within specific demographic groups.
Identify groups of learners who are working below expected standards and highlight those who are showing particularly good progress.
Explore whether common trends or patterns are present within your school.
Consider progress against local and national comparators and use this information when considering expectations, target setting or collaborating with other schools/settings.
Identify a starting point for understanding ‘why’ a pattern, trend or a gap exists.<br>
slide28. Making data comparisons<br>
slide29. Using nationally available comparator data Attainment data can be compared against national or local authority data sets.
There are nationally available improvement tools, such as the BGE Benchmarking tool or Insight which have been created to support schools to make comparisons out with their own establishment.
In these tools a virtual comparator is created using learners from others schools with similar characteristics e.g. SIMD, ASN, Gender.
Virtual comparator values are included to provide context for the data.
A virtual comparator is a sample group of pupils from other parts of Scotland who have similar characteristics to the young people in the school (e.g. matched on gender, additional support needs, stage and the social context in which they live).<br>
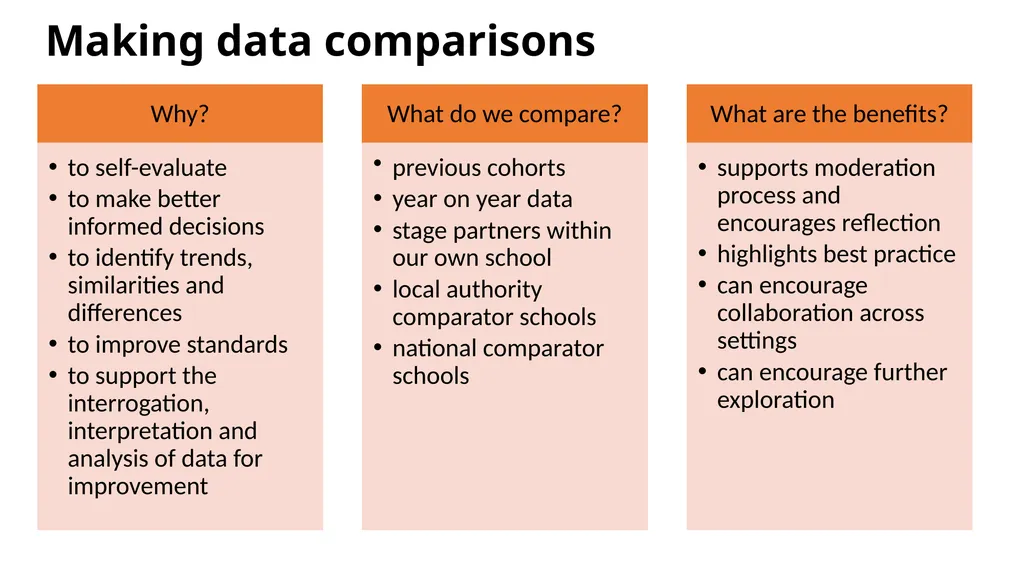
slide30. Comparator data within and across schools and settings Comparisons can also be made within settings and across settings in order to: support self-evaluation, improve standards, support the interrogation, interpretation and analysis of data.
Data can be used to compare cohorts and attainment and progress over time.
Comparisons can also be made with stage partners within schools and departments, as part of moderation processes, and also with other local authority groupings.<br>
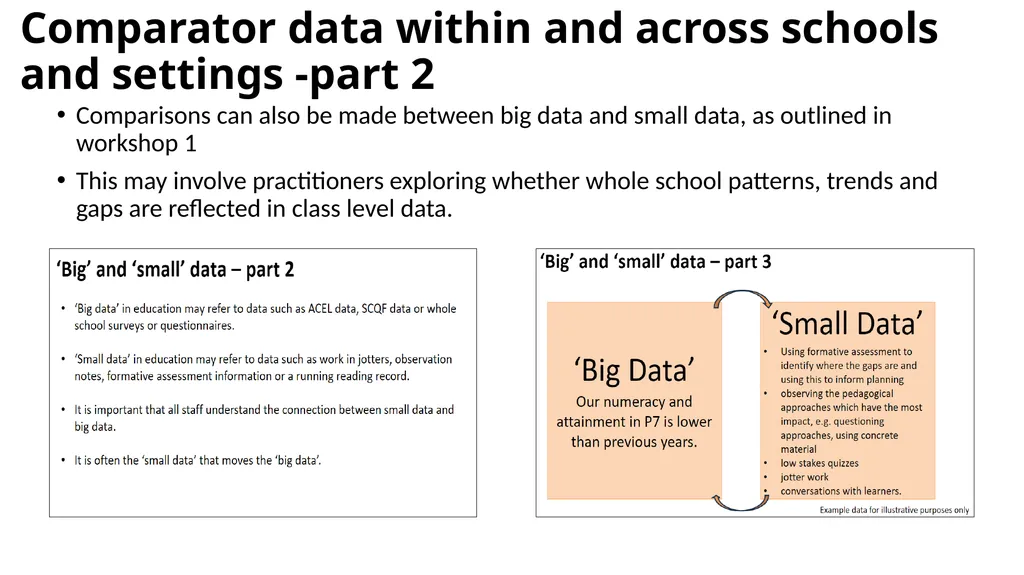
slide31. Comparator data within and across schools and settings -part 2 Comparisons can also be made between big data and small data, as outlined in workshop 1
This may involve practitioners exploring whether whole school patterns, trends and gaps are reflected in class level data.<br>
slide32. Reflect What do you compare when analysing data to review the progress of learners?
How does this inform our teacher professional judgements?
How confident do you feel when using comparator data?<br>
slide33. Aims Review In this workshop we will consider:
national guidance and research including signposting to national data sets
questions to explore when analysing and interpreting data
the use of comparator data, and
how to use a data analysis to inform next steps.<br>
slide34. Reflection Activity How confident do we feel effectively analysing data?
What key messages or actions have you taken from the workshop?
What might you do differently in school?<br>
slide35. Feedback Insert you own evaluation code here<br>
Practitioners<br>
slide2. The national model of professional learning The national model of professional learning | Professional Learning | Education Scotland<br>
slide3. Draft Group Agreement and Protocols Work together
learn from, with, and on behalf of each other
create a safe space to share ideas and build learning
agree that everyone is an equal and valued participant
remain in the room (emails and phone protocol).<br>
slide4. Connector In groups/pairs:
Share the job you thought you might do when you were a child/teenager?<br>
slide5. Re-cap In workshop 1 we looked at the purpose and use of data including: the meaning of data and evidence, the ways in which data is used and what we mean by ‘big’ and ‘small’ data.
In workshop 2 we considered different categories of data and how these may be intersected to support improvement.
In workshop 3 we examined how we create effective systems and processes<br>
slide6. Aims In this workshop we will consider:
national guidance and research including signposting to national data sets
questions to explore when analysing and interpreting data
the use of comparator data, and
how to use a data analysis to inform next steps.<br>
slide7. Content coverage<br>
slide8. GTCS Standards for Full Registration and Career Long Professional Learning Curriculum and Pedagogy
3.1.1 - Plan effectively to meet learners’ needs
3.1.4 - Effectively employ assessment, evaluate progress, recording and reporting as an integral part of the teaching process to support and enhance learning.
Professional Learning
3.3.2 - Engage in reflective practice to develop and advance career-long professional learning. GTCS The Standard for Full Registration
GTCS - The Standard for Career-Long Professional Learning<br>
slide9. HGIOS 4 Staff make effective use of current available data on levels of child poverty and apply this to ensure equity (1.5)
All teachers have well-developed skills of data analysis which are focused on improvement (2.3)
We use data to evaluate the effectiveness of interventions designed to improve outcomes for all learners (2.3)<br>
slide10. Rapid Evidence Review Paper Section four of the Education Scotland Rapid Evidence Review on interpreting and analysing data highlights the points below.
Educators often report a lack of confidence in being able to interpret data.
Educators should be familiar with a range of key measures and measures should be embedded into improvement plans.
Educators should gather and analyse improvement data frequently and look for patterns, trends and variation.
It is important to intersect data and evidence to understand why a pattern, trend or gap exists.
Schools and settings should utilise local and national comparator data.<br>
slide11. Using data Data analysis involves examining information and breaking it down for understanding and meaning.
To analyse data effectively educators should be confident in:
reading and interpreting a range of common tables, charts and diagrams, and
analysing and utilising the information gathered to inform improvement.<br>
slide12. Reflection activity “Using data is not separate from planning and from routine decisions in schools. Instead, data is a necessary part of an ongoing process of analysis, insight, new learning and changes in practice.”
(Lorna M Earl and Steven Katz, 2009) How confident do we feel when it comes to analysing data?
What school / classroom level data do we currently analyse?
How do we currently utilise this data to inform improvement?<br>
slide13. How do we start to analyse data? Key questions to ask:
What do we wish to explore or find out?
Which data sets will help us to do this?
Is the data we plan to look at easily available and reliable?<br>
slide14. What are we looking for? Examples:
evidence of progress/ lack of progress
surprising outcomes/anomalies (good and bad)
patterns or trends emerging over time
gaps in attainment
the impact of a change we have implemented
to make comparisons in relation to local/national data.<br>
slide15. Using attainment data What are we looking for? Examples<br>
slide16. Which data sets will help us do this? Examples:
class/setting checklists or spreadsheets
establishment tracking files (if available)
local authority tracking tools (if available)
national data tools, e.g. ACEL data, Insight data(secondary), BGE benchmarking tool.<br>
slide17. Using contextual information<br>
slide18. Using attainment data – part 2<br>
slide19. Availability and reliability try to keep ongoing records e.g. assessment results
find out what data tools the local authority have available
triangulate data – one source is unlikely to give you the full story
look outwards – how does the data compare to local and national data?<br>
slide20. Digital tools Example tools:
Microsoft Excel/ Google Sheets
Microsoft Forms/ Google Forms
Power BI
Graphs e.g. bar, line, scatter, etc How to sort and filter your data in excel Power BI Tutorial for Beginners<br>
slide21. Analysing the data Data for illustrative purposes only<br>
slide22. Observational/statistical interpretation of data Examples:
Child A and Child D’s results have continued to decline. Has there been a change in e.g. attendance, behaviour, confidence etc? How does this compare to other curricular assessments?
Child B, H, I, K & M’s results are lower than the rest of the cohort. We notice that these children are all EAL children.
Child J has a steady positive increase in their results. What could have impacted this change?<br>
slide23. Intersecting data Once data has been analysed, it is important to consider ‘why’ a gap, pattern or a trend may exist.
The next step may be to intersect different categories of data as, outlined in workshop 2, to understand ‘why.’<br>
slide24. Example: Observational/statistical interpretation of data You have a P3 class and you have identified from your assessments and observations that there is an attainment gap between boys and girls in reading. You can see from tracking data that males are not progressing in first level as well as their female peers. Observational data would suggest that they don't read for enjoyment. You carry out a pupil voice survey and it confirms that that males don't enjoy reading in class or at home. You decide to try test of change, using a Plan/Do/Study/Act (PDSA)* cycle. You will introduce some new genres and texts into the class library such as comic's and books of interest which pupils have suggested etc. continued on next slide *https://learn.nes.nhs.scot/2274/quality-improvement-zone/qi-tools/pdsa<br>
slide25. Example continued: Observational/statistical interpretation of data You introduce some new texts to the class library/resources and you will track reading engagement with all pupils (with particular interest in the males) over the next 2 months. Based on the data and pupil voice you can see whether this has been successful and can be adopted or if a new theory can be tested. Model for Improvement<br>
slide26. Local examples of data – tables, charts, graphs This slide is a place holder for facilitators to consider adding in any local authority examples of data.
This slide can be added to or removed as appropriate.<br>
slide27. Analysing attainment data - summary Look for attainment ‘gaps’ in subjects, cohorts, across the whole school and/or within specific demographic groups.
Identify groups of learners who are working below expected standards and highlight those who are showing particularly good progress.
Explore whether common trends or patterns are present within your school.
Consider progress against local and national comparators and use this information when considering expectations, target setting or collaborating with other schools/settings.
Identify a starting point for understanding ‘why’ a pattern, trend or a gap exists.<br>
slide28. Making data comparisons<br>
slide29. Using nationally available comparator data Attainment data can be compared against national or local authority data sets.
There are nationally available improvement tools, such as the BGE Benchmarking tool or Insight which have been created to support schools to make comparisons out with their own establishment.
In these tools a virtual comparator is created using learners from others schools with similar characteristics e.g. SIMD, ASN, Gender.
Virtual comparator values are included to provide context for the data.
A virtual comparator is a sample group of pupils from other parts of Scotland who have similar characteristics to the young people in the school (e.g. matched on gender, additional support needs, stage and the social context in which they live).<br>
slide30. Comparator data within and across schools and settings Comparisons can also be made within settings and across settings in order to: support self-evaluation, improve standards, support the interrogation, interpretation and analysis of data.
Data can be used to compare cohorts and attainment and progress over time.
Comparisons can also be made with stage partners within schools and departments, as part of moderation processes, and also with other local authority groupings.<br>
slide31. Comparator data within and across schools and settings -part 2 Comparisons can also be made between big data and small data, as outlined in workshop 1
This may involve practitioners exploring whether whole school patterns, trends and gaps are reflected in class level data.<br>
slide32. Reflect What do you compare when analysing data to review the progress of learners?
How does this inform our teacher professional judgements?
How confident do you feel when using comparator data?<br>
slide33. Aims Review In this workshop we will consider:
national guidance and research including signposting to national data sets
questions to explore when analysing and interpreting data
the use of comparator data, and
how to use a data analysis to inform next steps.<br>
slide34. Reflection Activity How confident do we feel effectively analysing data?
What key messages or actions have you taken from the workshop?
What might you do differently in school?<br>
slide35. Feedback Insert you own evaluation code here<br>