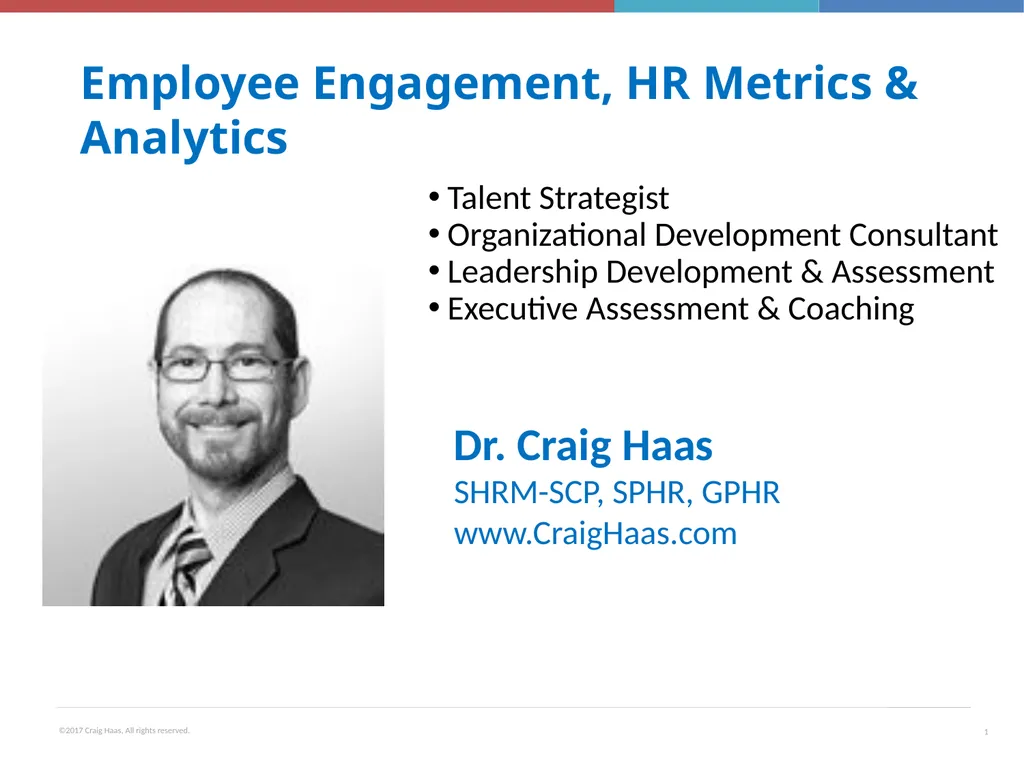
Employee Engagement, HR Metrics & Analytics Talent

Published  . 0 views
↓ Download
Employee Engagement, HR Metrics & Analytics Talent
1 / 1
Employee Engagement, HR Metrics & Analytics Talent - slide 1 of 37 Employee Engagement, HR Metrics & Analytics Talent - slide 2 of 37 Employee Engagement, HR Metrics & Analytics Talent - slide 3 of 37 Employee Engagement, HR Metrics & Analytics Talent - slide 4 of 37 Employee Engagement, HR Metrics & Analytics Talent - slide 5 of 37 Employee Engagement, HR Metrics & Analytics Talent - slide 6 of 37 Employee Engagement, HR Metrics & Analytics Talent - slide 7 of 37 Employee Engagement, HR Metrics & Analytics Talent - slide 8 of 37 Employee Engagement, HR Metrics & Analytics Talent - slide 9 of 37 Employee Engagement, HR Metrics & Analytics Talent - slide 10 of 37 Employee Engagement, HR Metrics & Analytics Talent - slide 11 of 37 Employee Engagement, HR Metrics & Analytics Talent - slide 12 of 37 Employee Engagement, HR Metrics & Analytics Talent - slide 13 of 37 Employee Engagement, HR Metrics & Analytics Talent - slide 14 of 37 Employee Engagement, HR Metrics & Analytics Talent - slide 15 of 37 Employee Engagement, HR Metrics & Analytics Talent - slide 16 of 37 Employee Engagement, HR Metrics & Analytics Talent - slide 17 of 37 Employee Engagement, HR Metrics & Analytics Talent - slide 18 of 37 Employee Engagement, HR Metrics & Analytics Talent - slide 19 of 37 Employee Engagement, HR Metrics & Analytics Talent - slide 20 of 37 Employee Engagement, HR Metrics & Analytics Talent - slide 21 of 37 Employee Engagement, HR Metrics & Analytics Talent - slide 22 of 37 Employee Engagement, HR Metrics & Analytics Talent - slide 23 of 37 Employee Engagement, HR Metrics & Analytics Talent - slide 24 of 37 Employee Engagement, HR Metrics & Analytics Talent - slide 25 of 37 Employee Engagement, HR Metrics & Analytics Talent - slide 26 of 37 Employee Engagement, HR Metrics & Analytics Talent - slide 27 of 37 Employee Engagement, HR Metrics & Analytics Talent - slide 28 of 37 Employee Engagement, HR Metrics & Analytics Talent - slide 29 of 37 Employee Engagement, HR Metrics & Analytics Talent - slide 30 of 37 Employee Engagement, HR Metrics & Analytics Talent - slide 31 of 37 Employee Engagement, HR Metrics & Analytics Talent - slide 32 of 37 Employee Engagement, HR Metrics & Analytics Talent - slide 33 of 37 Employee Engagement, HR Metrics & Analytics Talent - slide 34 of 37 Employee Engagement, HR Metrics & Analytics Talent - slide 35 of 37 Employee Engagement, HR Metrics & Analytics Talent - slide 36 of 37 Employee Engagement, HR Metrics & Analytics Talent - slide 37 of 37
Description: Employee Engagement, HR Metrics Analytics Talent Strategist Organizational Development Consultant Leadership Development Assessment Executive Assessment Coaching Dr. Craig Haas SHRM-SCP, SPHR, GPHR www.CraigHaas.com Some Key Terms -

Related Topics

Download Presentation

"Employee Engagement, HR Metrics & Analytics Talent" is the property of its rightful owner. Permission is granted to download and print the materials on this website for personal, non-commercial use only, and to display it on your personal computer provided you do not modify the materials and that you retain all copyright notices contained in the materials. By downloading content from our website, you accept the terms of this agreement.

Presentation Transcript

slide1. Employee Engagement, HR Metrics & Analytics Talent Strategist
Organizational Development Consultant
Leadership Development & Assessment
Executive Assessment & Coaching Dr. Craig Haas
SHRM-SCP, SPHR, GPHR
www.CraigHaas.com<br>
slide2. Some Key Terms - Employee Engagement
- Big Data
- HR Metrics
- HR Analytics<br>
slide3. Employee Engagement Our working definition…

Employee engagement is the emotional commitment the employee has to the organization and its goals<br>
slide4. What is Big Data?<br>
slide5. What are HR Metrics?<br>
slide6. Question What Metrics do you track?<br>
slide7. Benefits of HR Metrics Feedback is required for continuous learning
Accountability ‘What gets measured gets done’
Quantify the value of HR
Guide workforce strategies
Maximize HR’s return on investments
Show what HR contributes to business results
Make the business case for HR’s objectives<br>
slide8. Challenges with Metrics “You can’t measure what we do…”
Lack of clear purpose for measuring
Lack of cooperation between departments
Difficulty extracting data from multiple systems
Difficulty understanding and analyzing metrics
Numbers used to draw inaccurate conclusions<br>
slide9. Analytics use statistics to identify relationships between data sets to help firms address problems and make talent decisions.

Most HR organizations have been slow to adopt analytics – too slow, in fact, in the minds of many impatient business leaders.

For example, while ~50% of companies are using Online Assessments…just 14% of HR organizations in the U.S are using predictive analytics to make talent decisions (Bersin by Deloitte’s study, 2013). What Are Analytics<br>
slide10. What can HR Analytics help us to solve? Staff Churn Productivity Sales Target
Achievement All sorts of business problems that involve people…
But first you need to have the relevant data sources.<br>
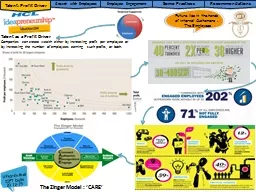
slide11. Employee Engagement Research has shown it to be linked to important outcomes:

- Discretionary effort
- Job performance
- Employee retention
- Innovation
- Adapting to change
- Revenue & profitability
- Customer experience

Employee Engagement data shows you a snap shot in time about the current state of Workforce Engagement.<br>
slide12. Where Shall We Focus?<br>
slide13. Can help Your Internal clients’ solve critical problems and answer burning questions

It is not a complex as it seems,
but it requires a bit of statistics skills. Predictive Analytics Applied to
Employee Engagement Data & Big HR Data<br>
slide14. what happens when we look at a metric for one thousand candidates? 14 Big Data Meets
Predictive Analytics<br>
slide15. 15 15 Predictive Analytics<br>
slide16. 16 16 Bell Curve Average<br>
slide17. Correlations (r) 0 1 2 3 4 5 6 7 8 9 10 0 1 2 3 4 5 6 7 8 9 10 weight height Correlations(r) from +1.0 to -1.0 r = + 0.44
n = 16,948
USA population<br>
slide18. Negative Correlation
Example Use of Umbrellas Correlations(r) from +1.0 to -1.0<br>
slide19. Correlations of common
medical procedures & outcomes<br>
slide20. Regression Line (prediction) 0 1 2 3 4 5 6 7 8 9 10 0 1 2 3 4 5 6 7 8 9 10 weight height<br>
slide21. Antecedents of
Employee Engagement Talent Acquisition & Onboarding
- Person-Organizational Fit
- Person- Job Fit
- Setting realistic work expectations
- Fostering positive work relationships

Talent Development
- Training & career development opportunities
- Supervisor development & coaching oriented
- Feedback loops

Leadership
- Supervisor as a people leader (positive leadership traits)
- Psychological safety - work climate in which employees can thrive
- Employees empowered to make important decisions

Org Practices
- Perceived organizational support, justice and fairness
- Merit based recognition & rewards
- Flexibility in work-life arrangements<br>
slide22. Start Small…Baby Steps HR Analytics<br>
slide23. Analyzing Data Microsoft Excel
Formulas
Sum
Average & Median
Time Calculations
Correlations
Regressions<br>
slide24. Simple HR Analytics
with MS Excel<br>
slide25. Select a Column or Row: Left click on very top of column (or far left end of row) and it will highlight the whole column (or row).

Average Formula: = average(A1, A2, A3)
Correlation Formula: =CORREL(array1, array2)
Note: an Array is any column (or a row) you select.

Formulas can be copied/pasted but you want to use ‘$’ to lock down certain columns. Excel Tips<br>
slide26. Select a Column or Row: Left click on very top of column (or far left end of row) and it will highlight the whole column (or row).

Average Formula: = average(A1, A2, A3)
Correlation Formula: =CORREL(array1, array2)
Note: an Array is any column (or a row) you select.

Formulas can be copied/pasted but you want to use ‘$’ to lock down certain columns. Excel Tips<br>
slide27. Simple Reporting Microsoft Excel (or equivalent)
Reports
Tables
Bar Graphs
Pie Charts
Scatter Plots

Warning:
Do not show your internal client a big
Excel file spread sheet with lots of data!<br>
slide28. Execs Like Dashboards ! If you can visually present in an intuitive way the impact that multiple variables have on a key outcome, you will more easily make your point to the Executive Leadership Team.

MS Office or equivalent are fine…..but there are also some really “Geeky Cool” Data Visualization tools available these days.<br>
slide29. Example of Using
MS Office for Dashboard:

A Business Case
on Selecting Salespeople Excel & PPT<br>
slide30. New Sales Goal Achievement
An Excel Bar Graph Percentage of New Sales Target Achievement
High match score candidates achieved 98% of their sales target
Moderate match score candidates achieved 63% of their sales target
Low match score candidates only achieved 32% of their sales target<br>
slide31. Closed Sales From Referrals
An Excel Pie Chart # of New Sales from Salesperson’s Registered Referral Sources
High score candidates closed 63% of all the referrals sales
Moderate score candidates closed 32% of all the referral sales
Low score candidates only closed 5% of all the referral sales<br>
slide32. Difference in Tenure
PPT Special Font for Emphasis The average tenure for both
High and Moderate match score
candidates was at least

that of the Low match score candidates Double<br>
slide33. Sunburst of Engagement Scores by Team Hierarchy Source: OrgVue Dashboards w/ Cool Data Viz Software<br>
slide34. Get Started Now – Easy Steps Find a leader with a problem

Persuade him/her to let you use analytics to help solve it

Figure out what metrics/outcomes may be relevant predictors & then collect the data

Create a combined score (regression formula) that predicts the desired outcome

Initiate the intervention based on what you have learned and measure change of performance over time<br>
slide35. HR Analytics Team Wanted Find a business leader who is willing to partner on an analytics project to solve a problem (e.g. reducing turnover or accidents)

Create a project team (e.g. borrow talent from other departments, leverage the local Univ. or a supplier)

Get a small win and then promote its success

Repeat above process a few times to collect some small wins and build credibility with business leaders<br>
slide36. Ask for resources to build an analytics team
Process must be owned by Executives, Managers, HR, Finance, and IT
Review org strategy, objectives and then discuss the leadership’s burning questions about talent?
Select a problem or question to address
Figure out what data be used to predict it Once You’ve Proven It Works<br>
slide37. Craig Haas, PhD
Talent Strategist, OD Consultant & Coach

Mobile: 305-773-3167
Direct: 401-484-8348
chaas@AdvantagePerformance.com

I love networking let’s meet for coffee,etc.

Connect to me on LinkedIn www.linkedin.com/in/craighaas
Twitter : @CraigDHaas
YouTube: http://bit.ly/2jtuM7f Let’s Talk<br>