Environmental Life Cycle Assessment of Electricity
Description: Environmental Life Cycle Assessment of Electricity from PV systems, 2021 data update R. Frischknecht, (Ed.) November 2022 Environmental Life Cycle Assessment Life Cycle Assessment (LCA) is a structured, comprehensive method of quantifying
Related Topics
Download Presentation
"Environmental Life Cycle Assessment of Electricity" is the property of its rightful owner. Permission is granted to download and print the materials on this website for personal, non-commercial use only, and to display it on your personal computer provided you do not modify the materials and that you retain all copyright notices contained in the materials. By downloading content from our website, you accept the terms of this agreement.
Presentation Transcript
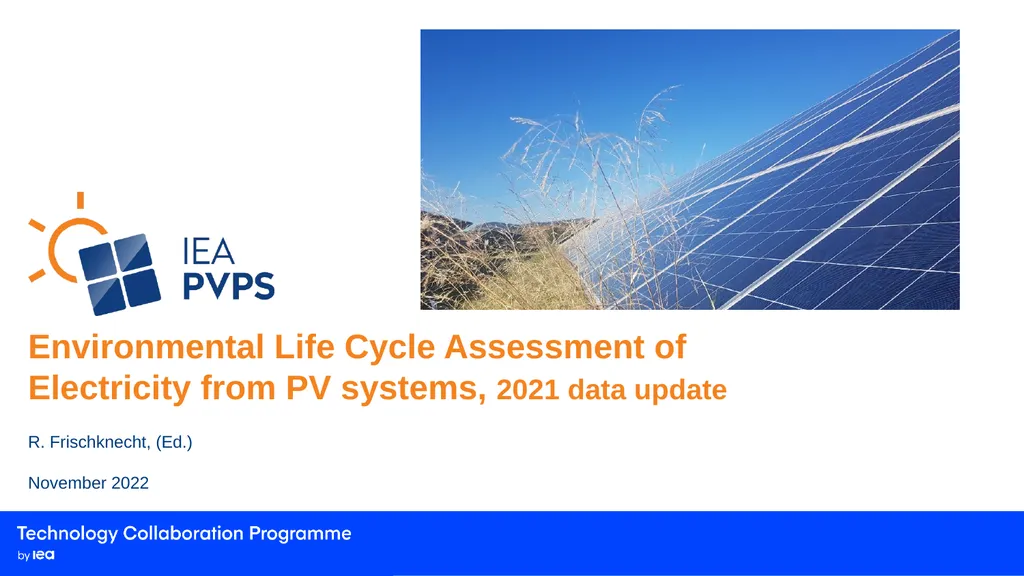
slide1. Environmental Life Cycle Assessment of Electricity from PV systems, 2021 data update R. Frischknecht, (Ed.) November 2022<br>
slide2. Environmental Life Cycle Assessment Life Cycle Assessment (LCA) is a structured, comprehensive method of quantifying material and energy flows, including the associated emissions caused in the life cycle of goods and services.
The life cycle of goods and services covers raw material and primary energy extraction, material and energy supply, manufacture, use and end of life, including transport and waste management services where needed. www.lifecycleinitiative.org<br>
slide3. Product System and System Boundary PV Electricity Generation IEA PVPS Report T12-19:2020 Company specific data: Data from PV panel manufacturer and companies operating supply chain activities such as cell manufacturing
Secondary data:
Data derived from scientific publications, reports and statistics or industry average data<br>
slide4. Environmental Footprint PV: Scope Reference flow: 1 kWh AC electricity (at connection point with the network), produced with a 3 kWp PV system, rooftop mounted
Annual production (Europe): 975 kWh/kWp, including degradation (linear, 0.7 %/year*)
Service life: 30 years (Panel), 15 years (inverter)
PV technologies and efficiencies
Cadmium-Tellurid (CdTe), 18.2 %
Copper-Indium-Gallium-Selenid (CIS/CIGS), 17.0 %
Multicrystalline Silicon (multi-Si, BSF), 18.0 %
Monocrystalline Silicon (mono-Si, BSF), 20.0 % * As per current Task 12 LCA methodology (IEA-PVPS T12-18:2020), though research on recent systems suggests degradation rates in the order of 0.5-0.6 %/year (Jordan et al. 2016). Results presented here can be adjusted by assuming a linear relationship with the degradation rate dependent yield. For a degradation rate of 0.5 %/year simply multiply results by a factor of 0.968; while for a degradation rate of 0.9 %/year multiply results by a factor of 1.053.<br>
slide5. Main updates crystalline silicon PV modules
module efficiency (Fraunhofer ISE 2021)
market shares polysilicon, ingot, wafer, cell and panel manufacturing (IHS Markit 2020)
electricity and thermal energy consumption in polysilicon, ingot, wafer, cell and panel manufacturing (IEA PVPS 2019&2021, ITRPV 2020, Smith et al. 2021, Woodhouse et al. 2019)
wafer thickness (ITRPV 2021)
silicon losses in wafer production (ITRPV 2021)
CIS PV modules
module efficiency (Fraunhofer ISE 2021)
CdTe
module type and module efficiency (Sinha 2021)
update of inventory data of all production sites in Malaysia, Vietnam and USA (Sinha 2021)<br>
slide6. Key Parameters and Key Data (1) Standard technology Back Surface Field, BSF
(2) 2010: production data; 2020: module efficiency<br>
slide7. Environmental Impacts of 1 kWh AC Electricity (2021 update) 1 kWh AC electricity. Annual irradiation: 1’331 kWh/m2. Annual yield (Europe): 975 kWh/kWp, including degradation (linear, 0.7%/a). To adjust results for a degradation rate of 0.5 %/year multiply results by 0.968; while for a degradation rate of 0.9 %/year, multiply results by a factor of 1.053. Service life: 30 years (Panel), 15 years (inverter)<br>
slide8. Environmental Impacts of 2021 Systems Relative to 2018 Systems 1 kWh AC electricity. Annual irradiation: 1’331 kWh/m2. Annual yield (Europe): 975 kWh/kWp, including degradation (linear, 0.7%/a). Service life: 30 years (Panel), 15 years (inverter).
Impacts of 2018 systems equal 100%; 2018 module efficiency in brackets. values >100 % indicate an increase in environmental impact relative to 2020; see slide 12 for discussion of reasons for these changes<br>
slide9. Greenhouse Gas Emissions 1 kWh PV-System 3kWp (2021 update) 20.0% 18.0% 17.0% 18.2% module efficiency 1 kWh AC electricity. Annual irradiation: 1’331 kWh/m2. Annual yield (Europe): 975 kWh/kWp, including degradation (linear, 0.7%/a). To adjust results for a degradation rate of 0.5 %/year multiply results by 0.968; while for a degradation rate of 0.9 %/year, multiply results by a factor of 1.053. Service life: 30 years (Panel), 15 years (inverter)<br>
slide10. Supply Chain Contributions to Greenhouse gas emissions (2021 update) 20.0% 18.0% module efficiency 1 kWh AC electricity. Annual irradiation: 1’331 kWh/m2. Annual yield (Europe): 975 kWh/kWp, including degradation (linear, 0.7%/a). To adjust results for a degradation rate of 0.5 %/year multiply results by 0.968; while for a degradation rate of 0.9 %/year, multiply results by a factor of 1.053. Service life: 30 years (Panel), 15 years (inverter)<br>
slide11. Time series greenhouse gas emissions Residential, rooftop mounted, scale mono-Si crystalline silicon photovoltaic systemInstalled in Switzerland Service life: 30 years (Panel), 15 years (inverter)
Background data:
1996: Ökoinventare von Energiesystemen
2003: ecoinvent v1.01
2007: ecoinvent v2.0
2014: ecoinvent v2.2
2016: KBOB LCA data DQRv2:2016
2020: UVEK LCA data DQRv2:2020
2021: UVEK LCA data DQRv2:2022 References
1996: Ciseri L., Doka G., Vollmer M. (996) Photovoltaik, in Frischknecht et al. (1996) Ökoinventare von Energiesystemen, Bern
2003/2007: Jungbluth N. (2003) Photovoltaik. In: Sachbilanzen von Energiesystemen: Grundlagen für den ökologischen Vergleich von Energiesystemen und den Einbezug von Energiesystemen in Ökobilanzen für die Schweiz (Ed. Dones R.). Paul Scherrer Institut Villigen, Swiss Centre for Life Cycle Inventories, Dübendorf, CH
2014: Jungbluth N., Stucki M., Flury K., Frischknecht R. and Buesser S. (2012) Life Cycle Inventories of Photovoltaics. ESU-services Ltd., Uster, CH
2016: R. Frischknecht, R. Itten, P. Sinha, M. de Wild-Scholten, J. Zhang, V. Fthenakis, H. C. Kim, M. Raugei, M. Stucki, 2015, Life Cycle Inventories and Life Cycle Assessment of Photovoltaic Systems, International Energy Agency (IEA) PVPS Task 12, Report T12-04:2015
2020: IEA-PVPS Report T12-19:2020 (1) The increase in 2016 is due to the geographical relocation of the supply chains<br>
slide12. Main reasons for changes compared to 2018 PV systems crystalline silicon PV panels
increased panel efficiency (leading to a decrease in life cycle environmental impacts)
higher thermal energy demand in polysilicon production (increase in impacts)
increased share of Chinese and Asian production of cells and wafers (increase in impacts)
CIS PV panels
increased panel efficiency (decrease in impacts)
CdTe
increased panel efficiency (decrease in impacts)
increased manufacturing efficiency (material and energy) (decrease in impacts)<br>
slide13. Non Renewable Energy Payback Time (2021 update) NREPBTNon renewable energy payback time is defined as the period required for a renewable energy system to generate the same amount of energy (in terms of non renewable primary energy equivalent) that was used to produce the system itself. 1 kWh AC electricity. Annual irradiation: 1’331 kWh/m2. Annual yield (Europe): 975 kWh/kWp, including degradation (linear, 0.7%/a).Service life: 30 years (Panel), 15 years (inverter).
Reference electricity mix: mix of power plants using non renewable energy sources (coal, oil, natural gas, uranium) in Europe.<br>
slide14. Bill of Materials IEA PVPS Report T12-19:2020<br>
slide15. Market Situation Crystalline Silicon 2020 in MW PV Power Capacity based on IHS Markit 2020 conversion from tons of Polysilicon to MW power with 3260 kg per MW PV power capacity<br>
slide16. Methodology and Database Methodology protocolIEA PVPS Task 12 Methodology guidelines, 4th edition (IEA PVPS Report T12-18:2020)
System modelAttributional LCI
Allocation
Multifunctional processes: economic relationships
Recycling: recycled content approach
Background dataUVEK LCI data DQRv2:2022
LCA softwareSimaPro v9.3<br>
slide17. Environmental Footprint PV: Environmental Indicators Selection of indicators from Life Cycle Impact Assessment Method “Environmental Footprint v3”:
Climate change: Greenhouse gas emissions, kg CO2-eq;IPCC (2013)
Resource use, minerals and metals:Abiotic depletion potential (ADP, ultimate reserves), kg Sb-eq;CML 2002 (Guinée et al. 2001) and (van Oers et al. 2002)
Resource use, fossils: Abiotic resource depletion – fossil fuels (ADP-fossil), MJ, CML 2002;(Guinée et al. 2001) and (van Oers et al. 2002)
Acidification:Accumulated Exceedance (AE), mol H+-eq;(Posch et al. 2008; Seppälä et al. 2006)
Particulate matter:Impact on human health, disease incidence;(Fantke et al. 2016)
Water use:User deprivation potential (deprivation-weighted water consumption); m3 water-eq;Boulay et al. (2017)<br>
slide18. Main References Fraunhofer ISE, Photovoltaics Report (16 September 2020), Freiburg, Germany, 2020
Fraunhofer ISE, Photovoltaics Report (27 July 2021), Freiburg, Germany, 2021
Frischknecht R., Stolz P., Krebs L., de Wild-Scholten M., Sinha P. and Raugei M. (2020) Life Cycle Inventories and Life Cycle Assessments of Photovoltaic Systems, Report T12-19:2020. International Energy Agency, IEA, Paris.
Frischknecht R., Stolz P., Heath G., Raugei M., Sinha P. and de Wild-Scholten M. (2020) Methodology Guidelines on Life Cycle Assessment of Photovoltaic Electricity, 4th edition, IEA-PVPS T12-18:2020. International Energy Agency, IEA, Paris.
IEA-PVPS, Trends in Photovoltaic Applications 2019, IEA PVPS Task 1, Report T1-36:2019, 2019
IEA-PVPS, Trends in Photovoltaic Applications 2019, IEA PVPS Task 1, Report T1-41:2021, 2021
IHS Markit, market report 2020
Jordan D. C., Kurtz S. R., VanSant K., and Newmiller J. (2016) Compendium of photovoltaic degradation rates, Prog. Photov., Vol. 24(7), pp. 978-989.
VDMA, International Technology Roadmap for Photovoltaic (ITRPV) - 2019 Results, Vol. Eleventh Edition, VDMA Photovoltaic equipment, 2020
Woodhouse M., Smith B., Ramdas A., and Margolis R., Crystalline Silicon Photovoltaic Module Manufacturing Costs and Sustainable Pricing: 1H 2018 Benchmark and Cost Reduction Road Map, NREL, Golden, CO, USA, 2019
Smith B. L., Woodhouse M., Horowitz K. A. W., Silverman T. J., Zuboy J. and Margolis R. M., Photovoltaic (PV) Module Technologies: 2020 Benchmark Costs and Technology Evolution Framework Results. National Renewable Energy Laboratory, NREL, Golden, CO, USA, 2021
P. Sinha, First Solar Series 6 Photovoltaic Module Environmental Product Declaration, NEPD-2993-1671-EN, 2021. https://www.epd-norge.no/solcellepaneler-og-komponenter/series-6-photovoltaic-module-article3438-552.html<br>
slide19. What is PVPS Task 12 – PV Sustainability The goal of Task 12 is to foster international collaboration and knowledge creation in PV environmental sustainability and safety, as crucial elements for the sustainable growth of PV as a major contributor to global energy supply and emission reductions of the member countries and the world. In doing so, Task 12 aims to facilitate a common understanding of PV Sustainability, with a focus on Environment Health and Safety (EH&S), among the various country-members and disseminate the Task’s outcomes and knowledge to stakeholders, energy and environmental policy decision makers, and the general public.
Task 12 is operated jointly by the National Renewable Energy Laboratory (NREL) and University of New South Wales (UNSW). Support from the United States’ Department of Energy (DOE) and the Australian University of New South Wales (UNSW) are gratefully acknowledged.
Task 12 Subtasks
End of Life of PV systems
Environmental Life Cycle Assessment (LCA)
Other PV sustainability topics
Task 12 Operating agents
Garvin Heath, NREL, USA
Jose Bilbao, UNSW, Australia<br>
slide20. PVPS Task 12 Reports T12-22:2022: Frischknecht R., Krebs L. (2022) Resource Use Footprints of Residential PV Systems, IEA-PVPS Task 12, Report T12-22:2022. International Energy Agency, IEA, Paris.
T12-20:2021: M. Raugei, Frischknecht R., Olson C., Sinha P., Heath G. (2021) Methodological guidelines on Net Energy Analysis of Photovoltaic Electricity, 2nd Edition, IEA-PVPS Task 12, Report T12-20:2021,
T12-19:2020: Frischknecht R., Stolz P., Krebs L., de Wild-Scholten M., Sinha P. and Raugei M. (2020) Life Cycle Inventories and Life Cycle Assessments of Photovoltaic Systems, IEA-PVPS Task 12, Report T12-19:2020. International Energy Agency, IEA, Paris.
T12-18:2020: Frischknecht R., Stolz P., Heath G., Raugei M., Sinha P. and de Wild-Scholten M. (2020) Methodology Guidelines on Life Cycle Assessment of Photovoltaic Electricity, 4th edition, IEA-PVPS Task 12, Report IEA-PVPS T12-18:2020. International Energy Agency, IEA, Paris.
T12-17:2020: Krebs L., Frischknecht R., Stolz P., Heath G., Komoto K., Sinha P. and Wade A. (2020) Environmental Life Cycle Assessment of residential PV and battery storage system. IEA-PVPS Task 12, Report IEA-PVPS T12-17:2020, International Energy Agency, IEA, Paris.
T12-16:2020: Sinha P., Heath G., Wade A., Komoto K. (2020) Human Health Risk Assessment, Part 3: Module Disposal Risks, PVPS Task 12, Report T12-16:2020, International Energy Agency, IEA, Paris.
T12-15:2019: Sinha P., Heath G., Wade A., Komoto K. (2019) Human Health Risk Assessment, Part 2: Breakage Risks, PVPS Task 12, Report T12-15:2019, International Energy Agency, IEA, Paris.
T12-14:2018: Sinha P., Heath G., Wade A., Komoto K. (2018) Human Health Risk Assessment, Part 1: Fire Risks, PVPS Task 12, Report T12-14:2018, International Energy Agency, IEA, Paris.
T12-05:2015: R. Frischknecht, R. Itten, F. Wyss, I. Blanc, G. Heath, M. Raugei, P. Sinha, A. Wade, 2014, Life cycle assessment of future photovoltaic electricity production from residential-scale systems operated in Europe, IEA-PVPS Task 12, Report IEA-PVPS T12-05:2015, International Energy Agency, IEA, Paris.
see https://iea-pvps.org/research-tasks/pv-sustainability/ for further publications of IEA PVPS Task 12<br>
slide21. Imprint CopyrightAll content provided in this report is copyrighted by IEA-PVPS Task 12.
Liability StatementInformation contained herein have been compiled or arrived from sources believed to be reliable. Nevertheless, the authors or their organizations do not accept liability for any loss or damage arising from the use thereof. Using the given information is strictly your own responsibility.
Size of documentThis set of slides has 22 pages
Version1.3, 1.11.2022<br>
slide22. R. Frischknecht, treeze Ltd. (ed.) info@treeze.ch<br>
slide2. Environmental Life Cycle Assessment Life Cycle Assessment (LCA) is a structured, comprehensive method of quantifying material and energy flows, including the associated emissions caused in the life cycle of goods and services.
The life cycle of goods and services covers raw material and primary energy extraction, material and energy supply, manufacture, use and end of life, including transport and waste management services where needed. www.lifecycleinitiative.org<br>
slide3. Product System and System Boundary PV Electricity Generation IEA PVPS Report T12-19:2020 Company specific data: Data from PV panel manufacturer and companies operating supply chain activities such as cell manufacturing
Secondary data:
Data derived from scientific publications, reports and statistics or industry average data<br>
slide4. Environmental Footprint PV: Scope Reference flow: 1 kWh AC electricity (at connection point with the network), produced with a 3 kWp PV system, rooftop mounted
Annual production (Europe): 975 kWh/kWp, including degradation (linear, 0.7 %/year*)
Service life: 30 years (Panel), 15 years (inverter)
PV technologies and efficiencies
Cadmium-Tellurid (CdTe), 18.2 %
Copper-Indium-Gallium-Selenid (CIS/CIGS), 17.0 %
Multicrystalline Silicon (multi-Si, BSF), 18.0 %
Monocrystalline Silicon (mono-Si, BSF), 20.0 % * As per current Task 12 LCA methodology (IEA-PVPS T12-18:2020), though research on recent systems suggests degradation rates in the order of 0.5-0.6 %/year (Jordan et al. 2016). Results presented here can be adjusted by assuming a linear relationship with the degradation rate dependent yield. For a degradation rate of 0.5 %/year simply multiply results by a factor of 0.968; while for a degradation rate of 0.9 %/year multiply results by a factor of 1.053.<br>
slide5. Main updates crystalline silicon PV modules
module efficiency (Fraunhofer ISE 2021)
market shares polysilicon, ingot, wafer, cell and panel manufacturing (IHS Markit 2020)
electricity and thermal energy consumption in polysilicon, ingot, wafer, cell and panel manufacturing (IEA PVPS 2019&2021, ITRPV 2020, Smith et al. 2021, Woodhouse et al. 2019)
wafer thickness (ITRPV 2021)
silicon losses in wafer production (ITRPV 2021)
CIS PV modules
module efficiency (Fraunhofer ISE 2021)
CdTe
module type and module efficiency (Sinha 2021)
update of inventory data of all production sites in Malaysia, Vietnam and USA (Sinha 2021)<br>
slide6. Key Parameters and Key Data (1) Standard technology Back Surface Field, BSF
(2) 2010: production data; 2020: module efficiency<br>
slide7. Environmental Impacts of 1 kWh AC Electricity (2021 update) 1 kWh AC electricity. Annual irradiation: 1’331 kWh/m2. Annual yield (Europe): 975 kWh/kWp, including degradation (linear, 0.7%/a). To adjust results for a degradation rate of 0.5 %/year multiply results by 0.968; while for a degradation rate of 0.9 %/year, multiply results by a factor of 1.053. Service life: 30 years (Panel), 15 years (inverter)<br>
slide8. Environmental Impacts of 2021 Systems Relative to 2018 Systems 1 kWh AC electricity. Annual irradiation: 1’331 kWh/m2. Annual yield (Europe): 975 kWh/kWp, including degradation (linear, 0.7%/a). Service life: 30 years (Panel), 15 years (inverter).
Impacts of 2018 systems equal 100%; 2018 module efficiency in brackets. values >100 % indicate an increase in environmental impact relative to 2020; see slide 12 for discussion of reasons for these changes<br>
slide9. Greenhouse Gas Emissions 1 kWh PV-System 3kWp (2021 update) 20.0% 18.0% 17.0% 18.2% module efficiency 1 kWh AC electricity. Annual irradiation: 1’331 kWh/m2. Annual yield (Europe): 975 kWh/kWp, including degradation (linear, 0.7%/a). To adjust results for a degradation rate of 0.5 %/year multiply results by 0.968; while for a degradation rate of 0.9 %/year, multiply results by a factor of 1.053. Service life: 30 years (Panel), 15 years (inverter)<br>
slide10. Supply Chain Contributions to Greenhouse gas emissions (2021 update) 20.0% 18.0% module efficiency 1 kWh AC electricity. Annual irradiation: 1’331 kWh/m2. Annual yield (Europe): 975 kWh/kWp, including degradation (linear, 0.7%/a). To adjust results for a degradation rate of 0.5 %/year multiply results by 0.968; while for a degradation rate of 0.9 %/year, multiply results by a factor of 1.053. Service life: 30 years (Panel), 15 years (inverter)<br>
slide11. Time series greenhouse gas emissions Residential, rooftop mounted, scale mono-Si crystalline silicon photovoltaic systemInstalled in Switzerland Service life: 30 years (Panel), 15 years (inverter)
Background data:
1996: Ökoinventare von Energiesystemen
2003: ecoinvent v1.01
2007: ecoinvent v2.0
2014: ecoinvent v2.2
2016: KBOB LCA data DQRv2:2016
2020: UVEK LCA data DQRv2:2020
2021: UVEK LCA data DQRv2:2022 References
1996: Ciseri L., Doka G., Vollmer M. (996) Photovoltaik, in Frischknecht et al. (1996) Ökoinventare von Energiesystemen, Bern
2003/2007: Jungbluth N. (2003) Photovoltaik. In: Sachbilanzen von Energiesystemen: Grundlagen für den ökologischen Vergleich von Energiesystemen und den Einbezug von Energiesystemen in Ökobilanzen für die Schweiz (Ed. Dones R.). Paul Scherrer Institut Villigen, Swiss Centre for Life Cycle Inventories, Dübendorf, CH
2014: Jungbluth N., Stucki M., Flury K., Frischknecht R. and Buesser S. (2012) Life Cycle Inventories of Photovoltaics. ESU-services Ltd., Uster, CH
2016: R. Frischknecht, R. Itten, P. Sinha, M. de Wild-Scholten, J. Zhang, V. Fthenakis, H. C. Kim, M. Raugei, M. Stucki, 2015, Life Cycle Inventories and Life Cycle Assessment of Photovoltaic Systems, International Energy Agency (IEA) PVPS Task 12, Report T12-04:2015
2020: IEA-PVPS Report T12-19:2020 (1) The increase in 2016 is due to the geographical relocation of the supply chains<br>
slide12. Main reasons for changes compared to 2018 PV systems crystalline silicon PV panels
increased panel efficiency (leading to a decrease in life cycle environmental impacts)
higher thermal energy demand in polysilicon production (increase in impacts)
increased share of Chinese and Asian production of cells and wafers (increase in impacts)
CIS PV panels
increased panel efficiency (decrease in impacts)
CdTe
increased panel efficiency (decrease in impacts)
increased manufacturing efficiency (material and energy) (decrease in impacts)<br>
slide13. Non Renewable Energy Payback Time (2021 update) NREPBTNon renewable energy payback time is defined as the period required for a renewable energy system to generate the same amount of energy (in terms of non renewable primary energy equivalent) that was used to produce the system itself. 1 kWh AC electricity. Annual irradiation: 1’331 kWh/m2. Annual yield (Europe): 975 kWh/kWp, including degradation (linear, 0.7%/a).Service life: 30 years (Panel), 15 years (inverter).
Reference electricity mix: mix of power plants using non renewable energy sources (coal, oil, natural gas, uranium) in Europe.<br>
slide14. Bill of Materials IEA PVPS Report T12-19:2020<br>
slide15. Market Situation Crystalline Silicon 2020 in MW PV Power Capacity based on IHS Markit 2020 conversion from tons of Polysilicon to MW power with 3260 kg per MW PV power capacity<br>
slide16. Methodology and Database Methodology protocolIEA PVPS Task 12 Methodology guidelines, 4th edition (IEA PVPS Report T12-18:2020)
System modelAttributional LCI
Allocation
Multifunctional processes: economic relationships
Recycling: recycled content approach
Background dataUVEK LCI data DQRv2:2022
LCA softwareSimaPro v9.3<br>
slide17. Environmental Footprint PV: Environmental Indicators Selection of indicators from Life Cycle Impact Assessment Method “Environmental Footprint v3”:
Climate change: Greenhouse gas emissions, kg CO2-eq;IPCC (2013)
Resource use, minerals and metals:Abiotic depletion potential (ADP, ultimate reserves), kg Sb-eq;CML 2002 (Guinée et al. 2001) and (van Oers et al. 2002)
Resource use, fossils: Abiotic resource depletion – fossil fuels (ADP-fossil), MJ, CML 2002;(Guinée et al. 2001) and (van Oers et al. 2002)
Acidification:Accumulated Exceedance (AE), mol H+-eq;(Posch et al. 2008; Seppälä et al. 2006)
Particulate matter:Impact on human health, disease incidence;(Fantke et al. 2016)
Water use:User deprivation potential (deprivation-weighted water consumption); m3 water-eq;Boulay et al. (2017)<br>
slide18. Main References Fraunhofer ISE, Photovoltaics Report (16 September 2020), Freiburg, Germany, 2020
Fraunhofer ISE, Photovoltaics Report (27 July 2021), Freiburg, Germany, 2021
Frischknecht R., Stolz P., Krebs L., de Wild-Scholten M., Sinha P. and Raugei M. (2020) Life Cycle Inventories and Life Cycle Assessments of Photovoltaic Systems, Report T12-19:2020. International Energy Agency, IEA, Paris.
Frischknecht R., Stolz P., Heath G., Raugei M., Sinha P. and de Wild-Scholten M. (2020) Methodology Guidelines on Life Cycle Assessment of Photovoltaic Electricity, 4th edition, IEA-PVPS T12-18:2020. International Energy Agency, IEA, Paris.
IEA-PVPS, Trends in Photovoltaic Applications 2019, IEA PVPS Task 1, Report T1-36:2019, 2019
IEA-PVPS, Trends in Photovoltaic Applications 2019, IEA PVPS Task 1, Report T1-41:2021, 2021
IHS Markit, market report 2020
Jordan D. C., Kurtz S. R., VanSant K., and Newmiller J. (2016) Compendium of photovoltaic degradation rates, Prog. Photov., Vol. 24(7), pp. 978-989.
VDMA, International Technology Roadmap for Photovoltaic (ITRPV) - 2019 Results, Vol. Eleventh Edition, VDMA Photovoltaic equipment, 2020
Woodhouse M., Smith B., Ramdas A., and Margolis R., Crystalline Silicon Photovoltaic Module Manufacturing Costs and Sustainable Pricing: 1H 2018 Benchmark and Cost Reduction Road Map, NREL, Golden, CO, USA, 2019
Smith B. L., Woodhouse M., Horowitz K. A. W., Silverman T. J., Zuboy J. and Margolis R. M., Photovoltaic (PV) Module Technologies: 2020 Benchmark Costs and Technology Evolution Framework Results. National Renewable Energy Laboratory, NREL, Golden, CO, USA, 2021
P. Sinha, First Solar Series 6 Photovoltaic Module Environmental Product Declaration, NEPD-2993-1671-EN, 2021. https://www.epd-norge.no/solcellepaneler-og-komponenter/series-6-photovoltaic-module-article3438-552.html<br>
slide19. What is PVPS Task 12 – PV Sustainability The goal of Task 12 is to foster international collaboration and knowledge creation in PV environmental sustainability and safety, as crucial elements for the sustainable growth of PV as a major contributor to global energy supply and emission reductions of the member countries and the world. In doing so, Task 12 aims to facilitate a common understanding of PV Sustainability, with a focus on Environment Health and Safety (EH&S), among the various country-members and disseminate the Task’s outcomes and knowledge to stakeholders, energy and environmental policy decision makers, and the general public.
Task 12 is operated jointly by the National Renewable Energy Laboratory (NREL) and University of New South Wales (UNSW). Support from the United States’ Department of Energy (DOE) and the Australian University of New South Wales (UNSW) are gratefully acknowledged.
Task 12 Subtasks
End of Life of PV systems
Environmental Life Cycle Assessment (LCA)
Other PV sustainability topics
Task 12 Operating agents
Garvin Heath, NREL, USA
Jose Bilbao, UNSW, Australia<br>
slide20. PVPS Task 12 Reports T12-22:2022: Frischknecht R., Krebs L. (2022) Resource Use Footprints of Residential PV Systems, IEA-PVPS Task 12, Report T12-22:2022. International Energy Agency, IEA, Paris.
T12-20:2021: M. Raugei, Frischknecht R., Olson C., Sinha P., Heath G. (2021) Methodological guidelines on Net Energy Analysis of Photovoltaic Electricity, 2nd Edition, IEA-PVPS Task 12, Report T12-20:2021,
T12-19:2020: Frischknecht R., Stolz P., Krebs L., de Wild-Scholten M., Sinha P. and Raugei M. (2020) Life Cycle Inventories and Life Cycle Assessments of Photovoltaic Systems, IEA-PVPS Task 12, Report T12-19:2020. International Energy Agency, IEA, Paris.
T12-18:2020: Frischknecht R., Stolz P., Heath G., Raugei M., Sinha P. and de Wild-Scholten M. (2020) Methodology Guidelines on Life Cycle Assessment of Photovoltaic Electricity, 4th edition, IEA-PVPS Task 12, Report IEA-PVPS T12-18:2020. International Energy Agency, IEA, Paris.
T12-17:2020: Krebs L., Frischknecht R., Stolz P., Heath G., Komoto K., Sinha P. and Wade A. (2020) Environmental Life Cycle Assessment of residential PV and battery storage system. IEA-PVPS Task 12, Report IEA-PVPS T12-17:2020, International Energy Agency, IEA, Paris.
T12-16:2020: Sinha P., Heath G., Wade A., Komoto K. (2020) Human Health Risk Assessment, Part 3: Module Disposal Risks, PVPS Task 12, Report T12-16:2020, International Energy Agency, IEA, Paris.
T12-15:2019: Sinha P., Heath G., Wade A., Komoto K. (2019) Human Health Risk Assessment, Part 2: Breakage Risks, PVPS Task 12, Report T12-15:2019, International Energy Agency, IEA, Paris.
T12-14:2018: Sinha P., Heath G., Wade A., Komoto K. (2018) Human Health Risk Assessment, Part 1: Fire Risks, PVPS Task 12, Report T12-14:2018, International Energy Agency, IEA, Paris.
T12-05:2015: R. Frischknecht, R. Itten, F. Wyss, I. Blanc, G. Heath, M. Raugei, P. Sinha, A. Wade, 2014, Life cycle assessment of future photovoltaic electricity production from residential-scale systems operated in Europe, IEA-PVPS Task 12, Report IEA-PVPS T12-05:2015, International Energy Agency, IEA, Paris.
see https://iea-pvps.org/research-tasks/pv-sustainability/ for further publications of IEA PVPS Task 12<br>
slide21. Imprint CopyrightAll content provided in this report is copyrighted by IEA-PVPS Task 12.
Liability StatementInformation contained herein have been compiled or arrived from sources believed to be reliable. Nevertheless, the authors or their organizations do not accept liability for any loss or damage arising from the use thereof. Using the given information is strictly your own responsibility.
Size of documentThis set of slides has 22 pages
Version1.3, 1.11.2022<br>
slide22. R. Frischknecht, treeze Ltd. (ed.) info@treeze.ch<br>