
Epidemiological study designs 5/17/2020 EYERUS
YM
Published · 232 slides · 0 views

1 / 1






Description
Epidemiological study designs 5172020 EYERUS T.(BSC,MPHE) 1 Session objectives After completing this session you will be able to Understand epidemiological study designs Differentiate the type of study design used by investigators
Related Topics
Share
Embed code
Download this presentation From Below
"Epidemiological study designs 5/17/2020 EYERUS" is the property of its rightful owner. Permission is granted to download and print the materials on this website for personal, non-commercial use only, and to display it on your personal computer provided you do not modify the materials and that you retain all copyright notices contained in the materials. By downloading content from our website, you accept the terms of this agreement.
Presentation Transcript
01
Epidemiological study designs 5/17/2020 EYERUS T.(BSC,MPHE) 1<br>
02
Session objectives After completing this session you will be able to
Understand epidemiological study designs
Differentiate the type of study design used by investigators
Identify the merits and demerits of each study designs
Apply epidemiological study designs to conduct a study. 5/17/2020 EYERUS T.(BSC,MPHE) 2<br>
Understand epidemiological study designs
Differentiate the type of study design used by investigators
Identify the merits and demerits of each study designs
Apply epidemiological study designs to conduct a study. 5/17/2020 EYERUS T.(BSC,MPHE) 2<br>
03
Introduction Role of epidemiology
To diagnose community health problems
To identify natural history and etiology of diseases
To evaluate and plan health services
Therefore, to achieve these roles
-------we use epidemiological study designs.
The common goal in epidemiological studies is understanding the frequency, pattern, and causes of disease in populations. 5/17/2020 3 EYERUS T.(BSC,MPHE)<br>
To diagnose community health problems
To identify natural history and etiology of diseases
To evaluate and plan health services
Therefore, to achieve these roles
-------we use epidemiological study designs.
The common goal in epidemiological studies is understanding the frequency, pattern, and causes of disease in populations. 5/17/2020 3 EYERUS T.(BSC,MPHE)<br>
04
Epidemiology: is primarily concerned with the distribution and determinants of disease in human population.
Study Design: is an arrangement of conditions for the collection and analysis of data that leads to the most accurate answer to the research question and the most economical way. 5/17/2020 EYERUS T.(BSC,MPHE) 4<br>
Study Design: is an arrangement of conditions for the collection and analysis of data that leads to the most accurate answer to the research question and the most economical way. 5/17/2020 EYERUS T.(BSC,MPHE) 4<br>
05
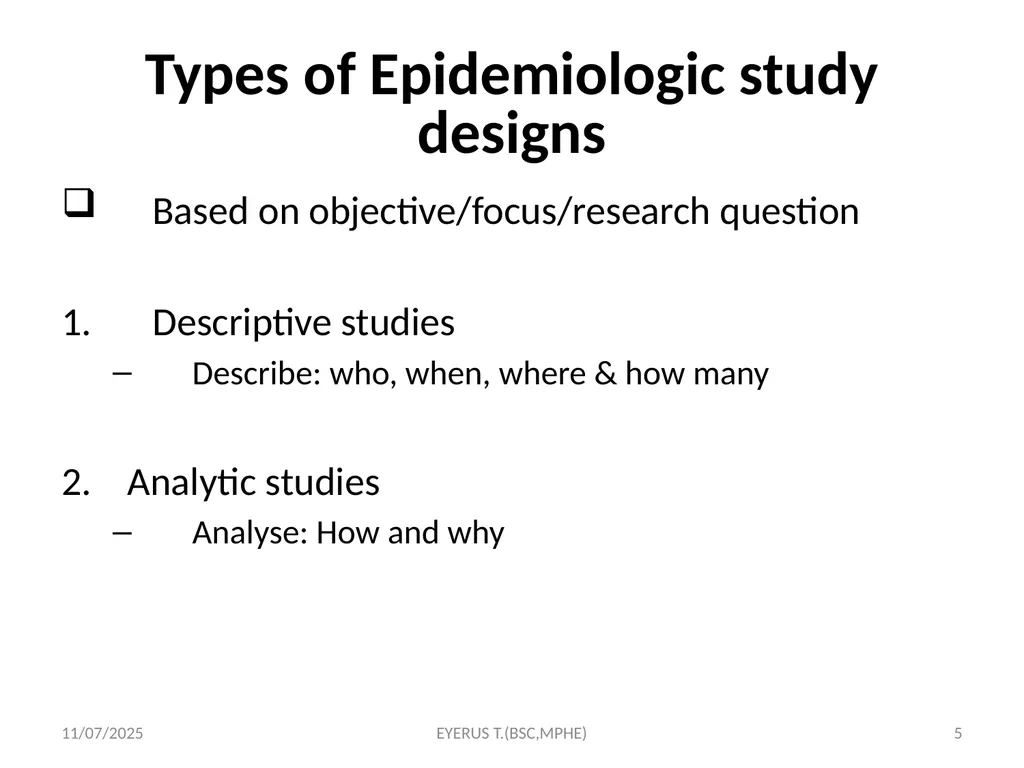
Types of Epidemiologic study designs Based on objective/focus/research question
Descriptive studies
Describe: who, when, where & how many
2. Analytic studies
Analyse: How and why 5/17/2020 EYERUS T.(BSC,MPHE) 5<br>
Descriptive studies
Describe: who, when, where & how many
2. Analytic studies
Analyse: How and why 5/17/2020 EYERUS T.(BSC,MPHE) 5<br>
06
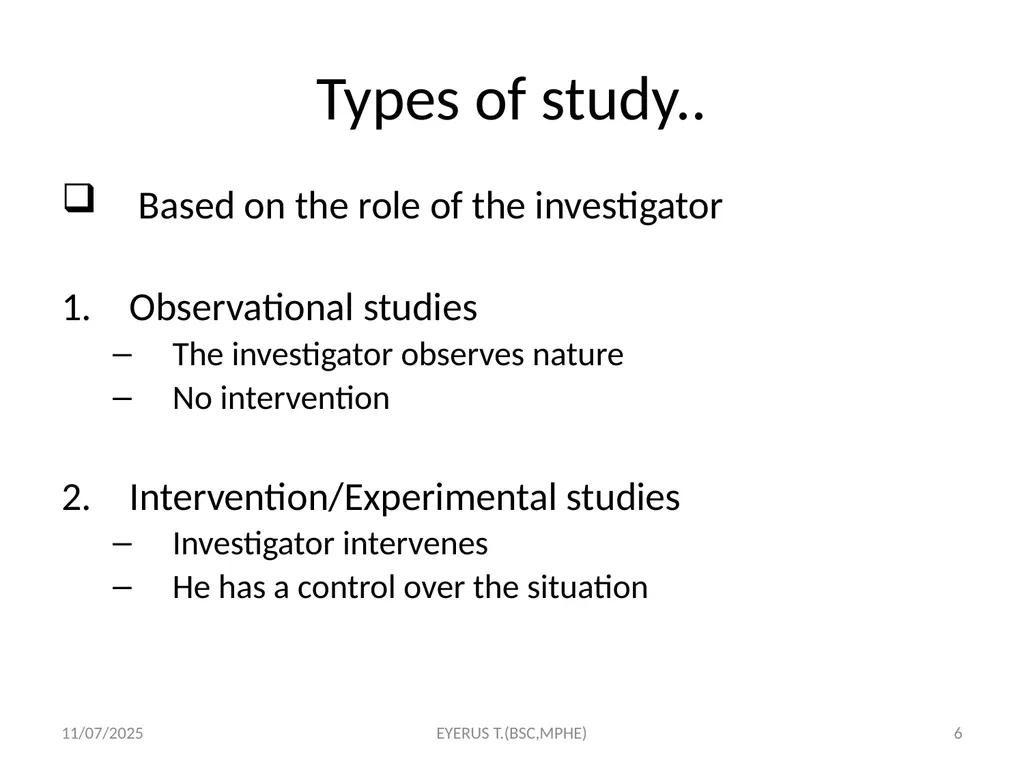
Types of study.. Based on the role of the investigator
Observational studies
The investigator observes nature
No intervention
Intervention/Experimental studies
Investigator intervenes
He has a control over the situation 5/17/2020 EYERUS T.(BSC,MPHE) 6<br>
Observational studies
The investigator observes nature
No intervention
Intervention/Experimental studies
Investigator intervenes
He has a control over the situation 5/17/2020 EYERUS T.(BSC,MPHE) 6<br>
07
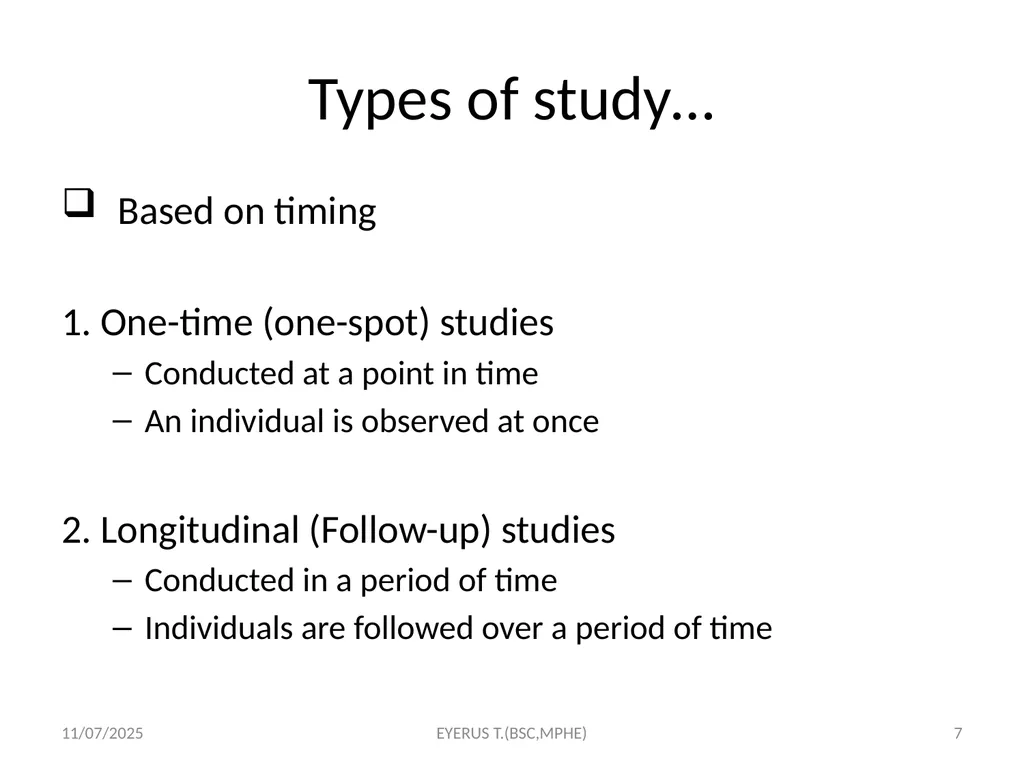
Types of study… Based on timing
1. One-time (one-spot) studies
Conducted at a point in time
An individual is observed at once
2. Longitudinal (Follow-up) studies
Conducted in a period of time
Individuals are followed over a period of time 5/17/2020 EYERUS T.(BSC,MPHE) 7<br>
1. One-time (one-spot) studies
Conducted at a point in time
An individual is observed at once
2. Longitudinal (Follow-up) studies
Conducted in a period of time
Individuals are followed over a period of time 5/17/2020 EYERUS T.(BSC,MPHE) 7<br>
08
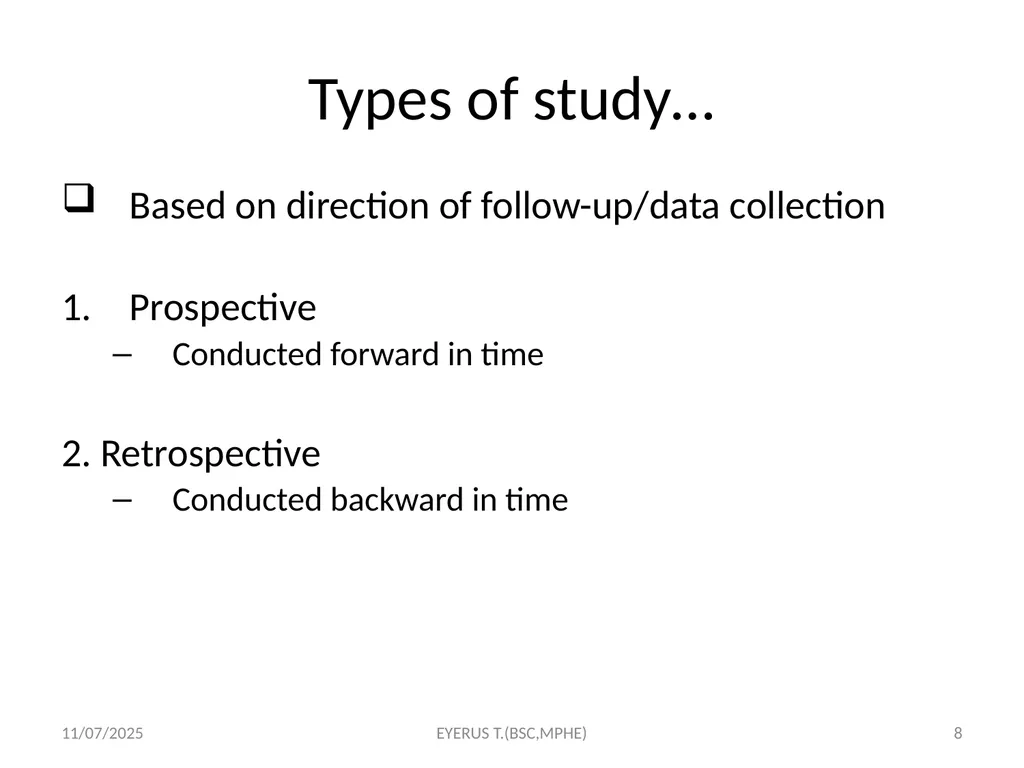
Types of study… Based on direction of follow-up/data collection
Prospective
Conducted forward in time
2. Retrospective
Conducted backward in time 5/17/2020 EYERUS T.(BSC,MPHE) 8<br>
Prospective
Conducted forward in time
2. Retrospective
Conducted backward in time 5/17/2020 EYERUS T.(BSC,MPHE) 8<br>
09
Types of study… Based on type of data they generate
Qualitative studies
Generate contextual data
Also called exploratory studies
2. Quantitative studies
Generate numerical data
Also called explanatory studies 5/17/2020 EYERUS T.(BSC,MPHE) 9<br>
Qualitative studies
Generate contextual data
Also called exploratory studies
2. Quantitative studies
Generate numerical data
Also called explanatory studies 5/17/2020 EYERUS T.(BSC,MPHE) 9<br>
10
Types of study… Based on study setting
Community-based studies
Conducted in communities
2. Institution-based studies
Conducted in institutions
3. Laboratory-based studies
Conducted in major laboratories 5/17/2020 EYERUS T.(BSC,MPHE) 10<br>
Community-based studies
Conducted in communities
2. Institution-based studies
Conducted in institutions
3. Laboratory-based studies
Conducted in major laboratories 5/17/2020 EYERUS T.(BSC,MPHE) 10<br>
11
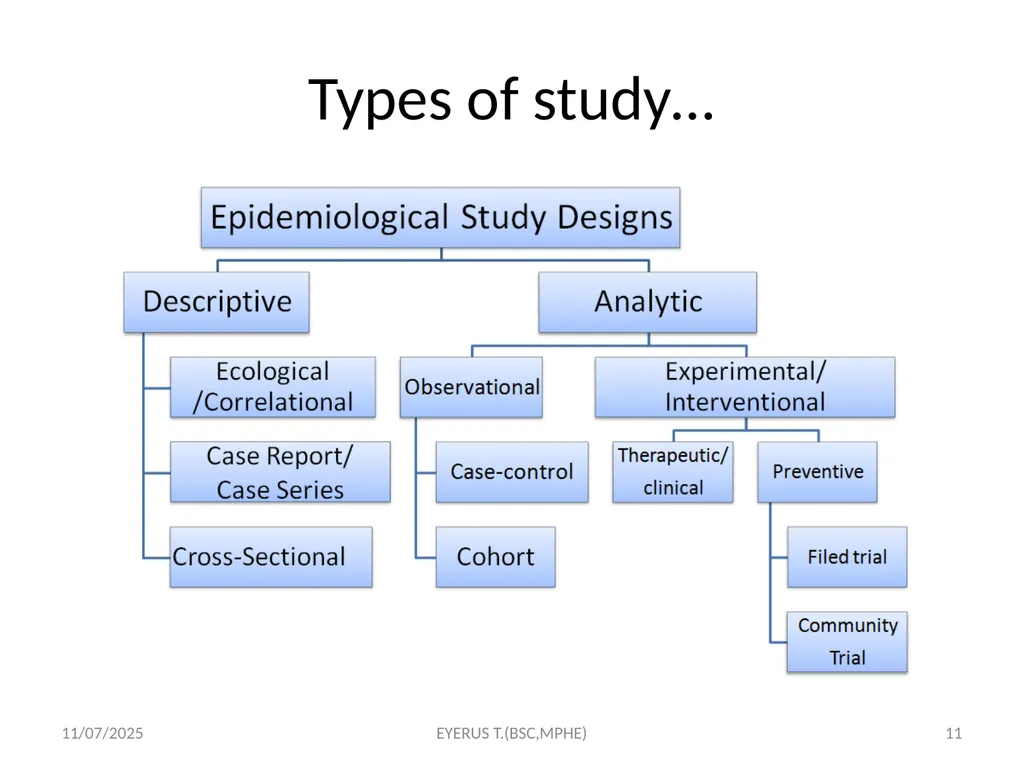
Types of study… 5/17/2020 EYERUS T.(BSC,MPHE) 11<br>
12
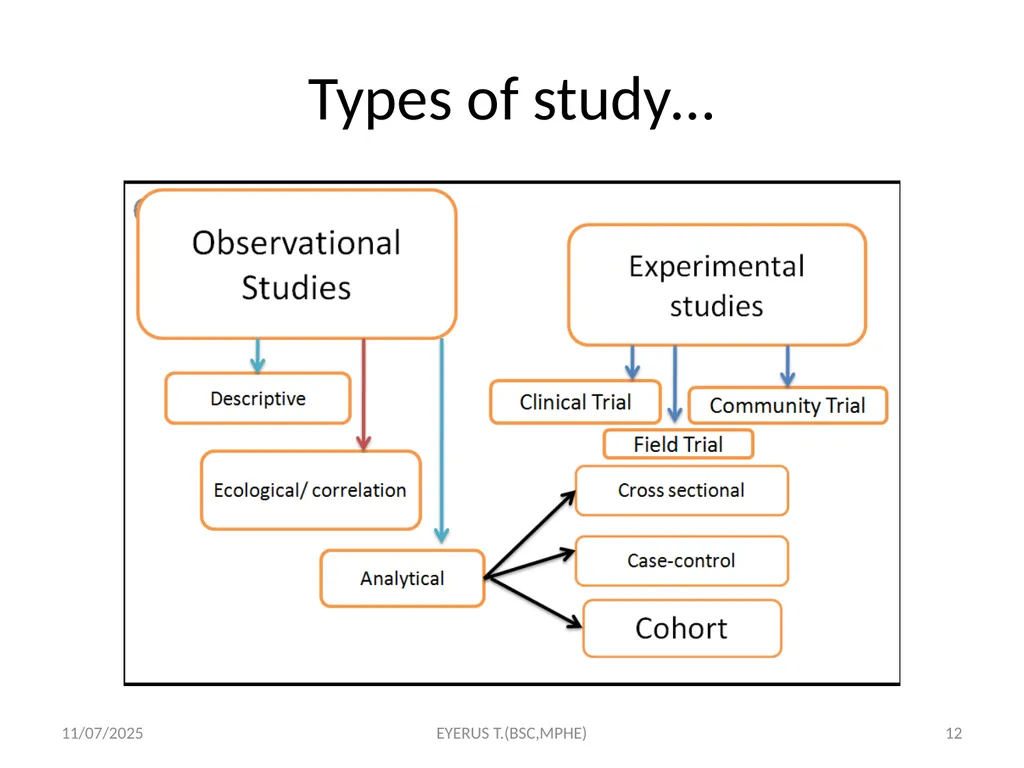
Types of study… 5/17/2020 EYERUS T.(BSC,MPHE) 12<br>
13
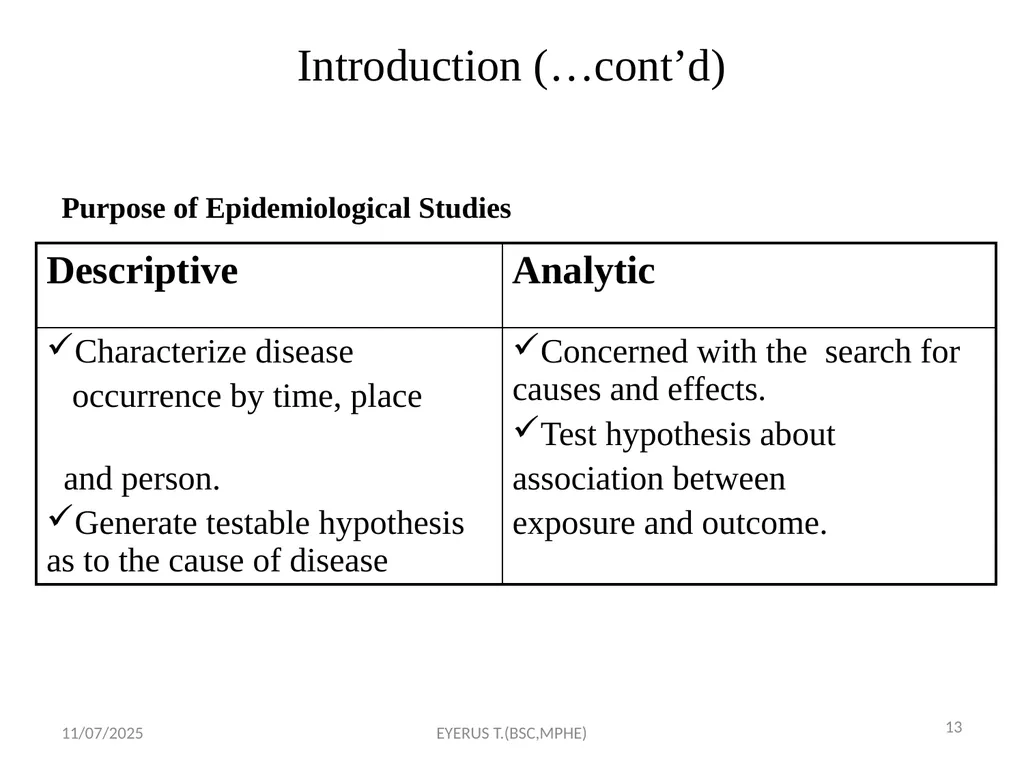
Introduction (…cont’d) Purpose of Epidemiological Studies 13 5/17/2020 EYERUS T.(BSC,MPHE)<br>
14
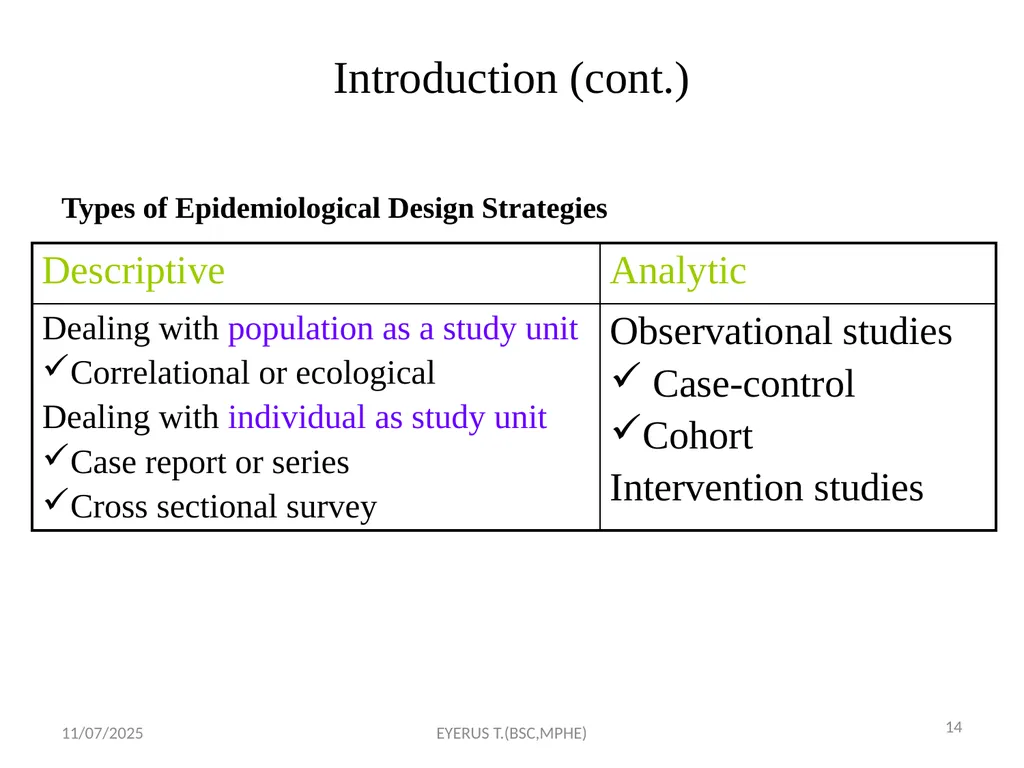
Introduction (cont.) Types of Epidemiological Design Strategies 14 5/17/2020 EYERUS T.(BSC,MPHE)<br>
15
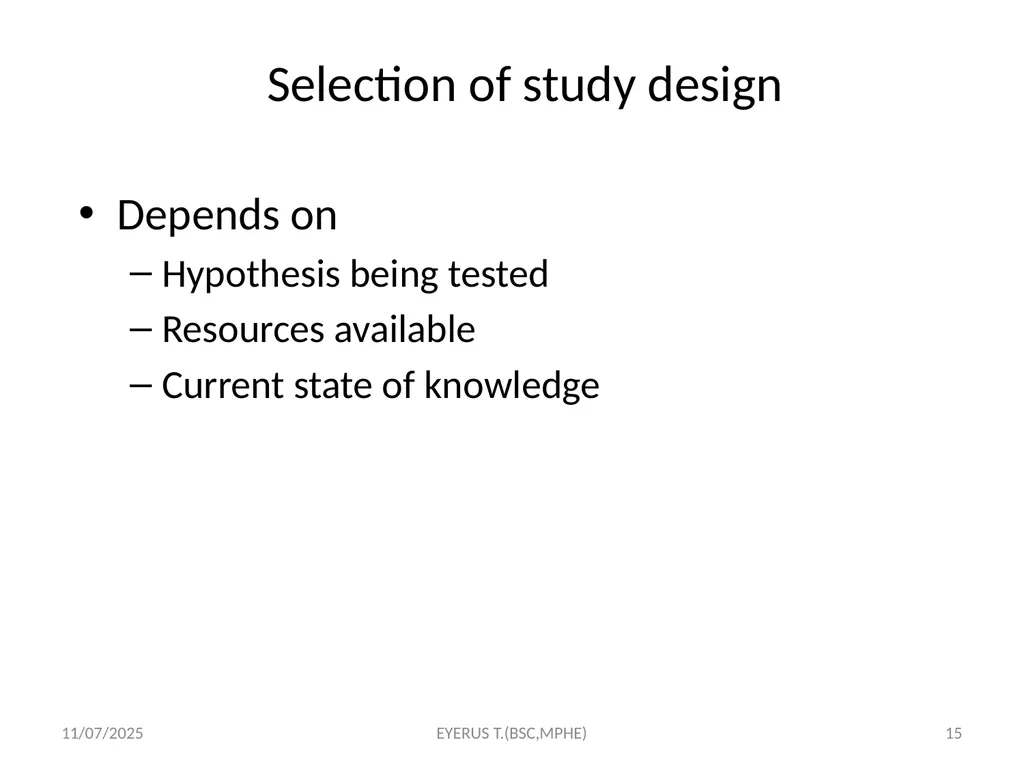
Selection of study design 15 Depends on
Hypothesis being tested
Resources available
Current state of knowledge 5/17/2020 EYERUS T.(BSC,MPHE)<br>
Hypothesis being tested
Resources available
Current state of knowledge 5/17/2020 EYERUS T.(BSC,MPHE)<br>
16
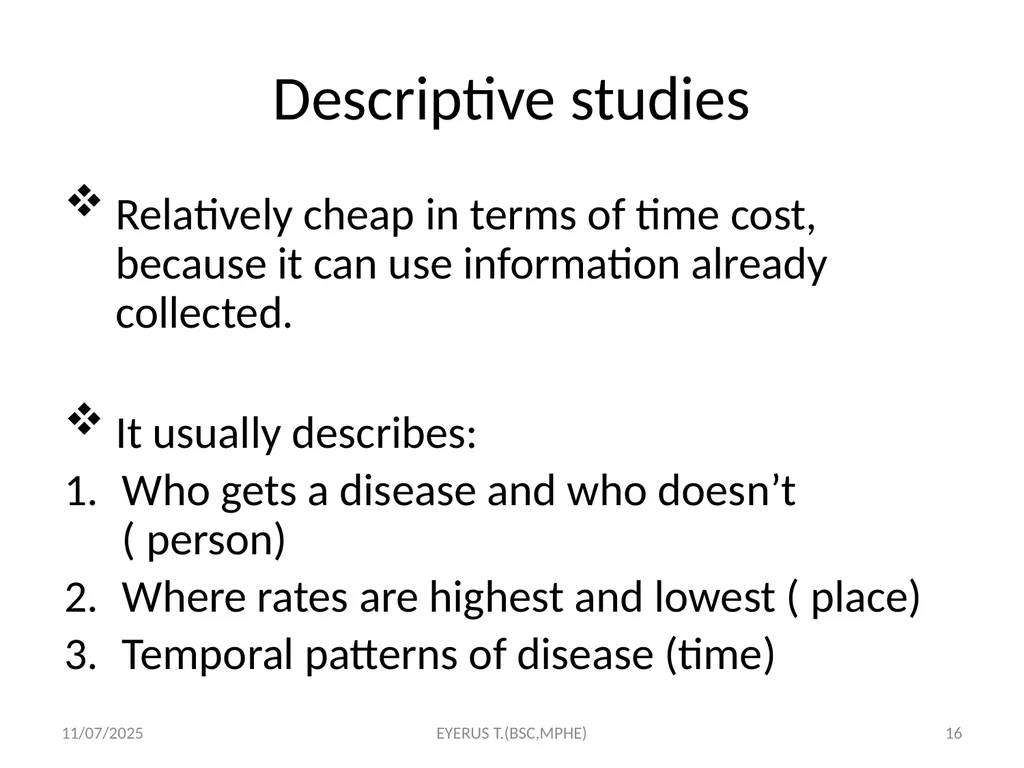
Descriptive studies Relatively cheap in terms of time cost, because it can use information already collected.
It usually describes:
Who gets a disease and who doesn’t ( person)
Where rates are highest and lowest ( place)
Temporal patterns of disease (time) 5/17/2020 EYERUS T.(BSC,MPHE) 16<br>
It usually describes:
Who gets a disease and who doesn’t ( person)
Where rates are highest and lowest ( place)
Temporal patterns of disease (time) 5/17/2020 EYERUS T.(BSC,MPHE) 16<br>
17
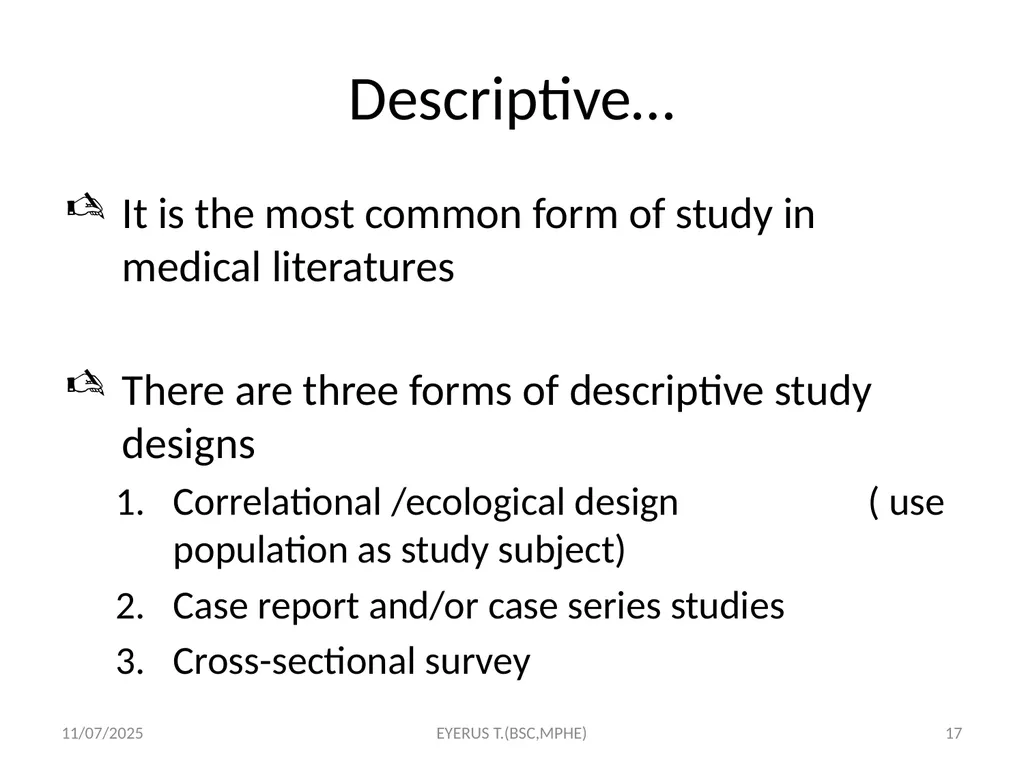
Descriptive… It is the most common form of study in medical literatures
There are three forms of descriptive study designs
Correlational /ecological design ( use population as study subject)
Case report and/or case series studies
Cross-sectional survey 5/17/2020 EYERUS T.(BSC,MPHE) 17<br>
There are three forms of descriptive study designs
Correlational /ecological design ( use population as study subject)
Case report and/or case series studies
Cross-sectional survey 5/17/2020 EYERUS T.(BSC,MPHE) 17<br>
18
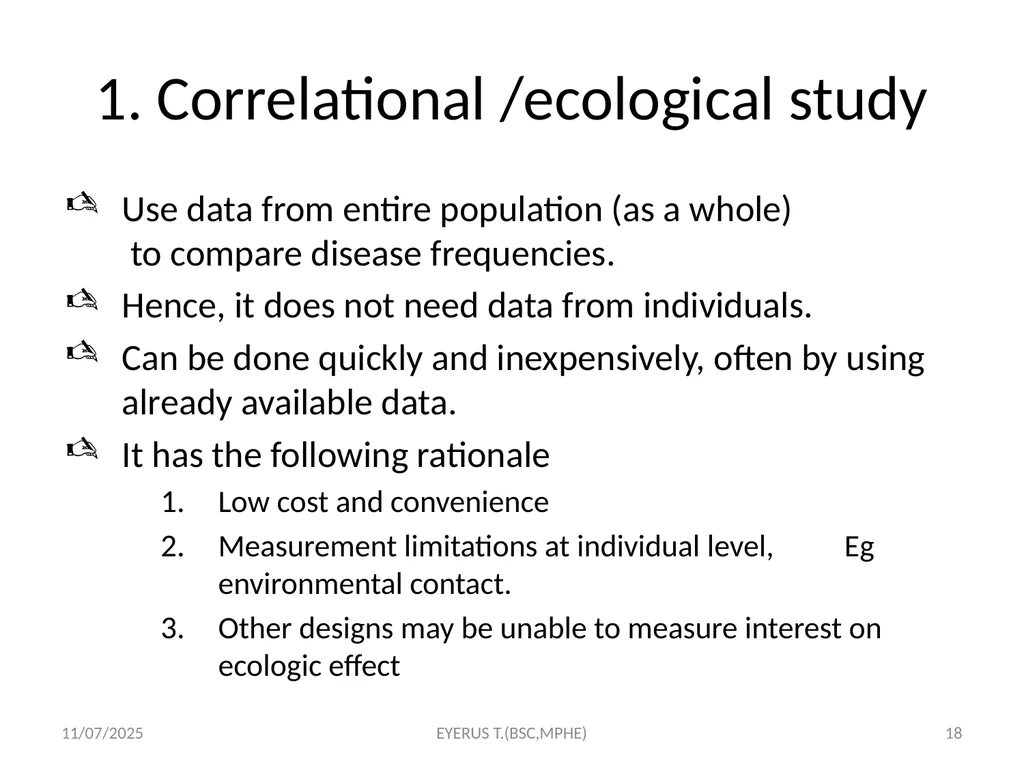
1. Correlational /ecological study Use data from entire population (as a whole) to compare disease frequencies.
Hence, it does not need data from individuals.
Can be done quickly and inexpensively, often by using already available data.
It has the following rationale
Low cost and convenience
Measurement limitations at individual level, Eg environmental contact.
Other designs may be unable to measure interest on ecologic effect 5/17/2020 EYERUS T.(BSC,MPHE) 18<br>
Hence, it does not need data from individuals.
Can be done quickly and inexpensively, often by using already available data.
It has the following rationale
Low cost and convenience
Measurement limitations at individual level, Eg environmental contact.
Other designs may be unable to measure interest on ecologic effect 5/17/2020 EYERUS T.(BSC,MPHE) 18<br>
19
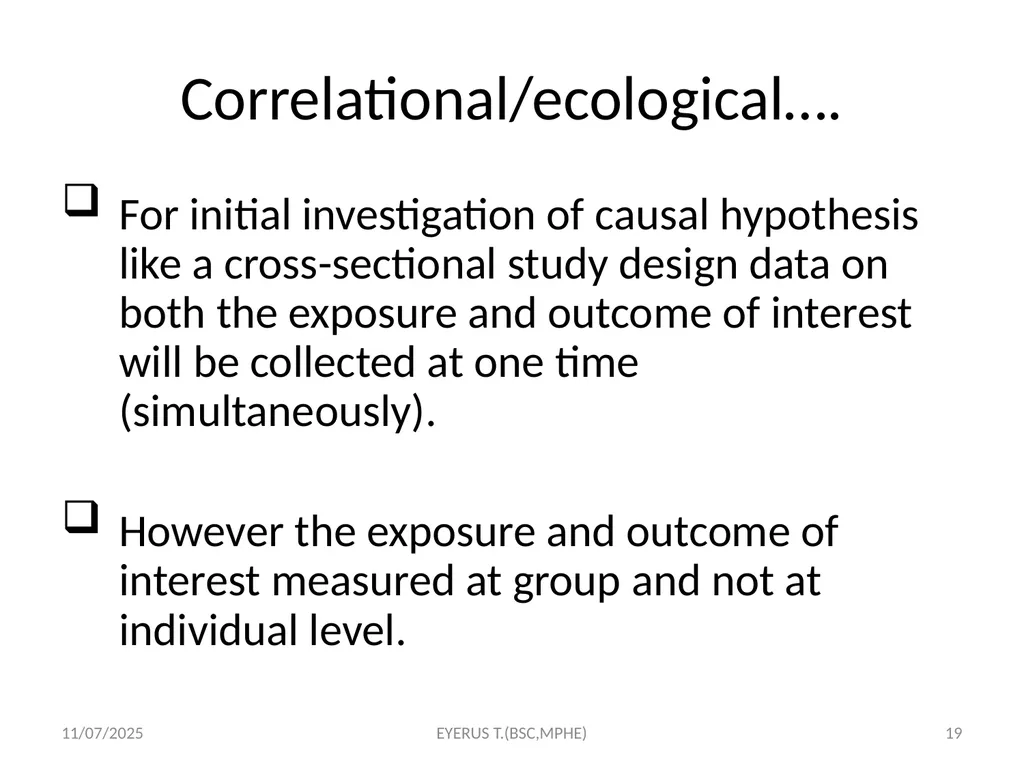
Correlational/ecological…. For initial investigation of causal hypothesis like a cross-sectional study design data on both the exposure and outcome of interest will be collected at one time (simultaneously).
However the exposure and outcome of interest measured at group and not at individual level. 5/17/2020 EYERUS T.(BSC,MPHE) 19<br>
However the exposure and outcome of interest measured at group and not at individual level. 5/17/2020 EYERUS T.(BSC,MPHE) 19<br>
20
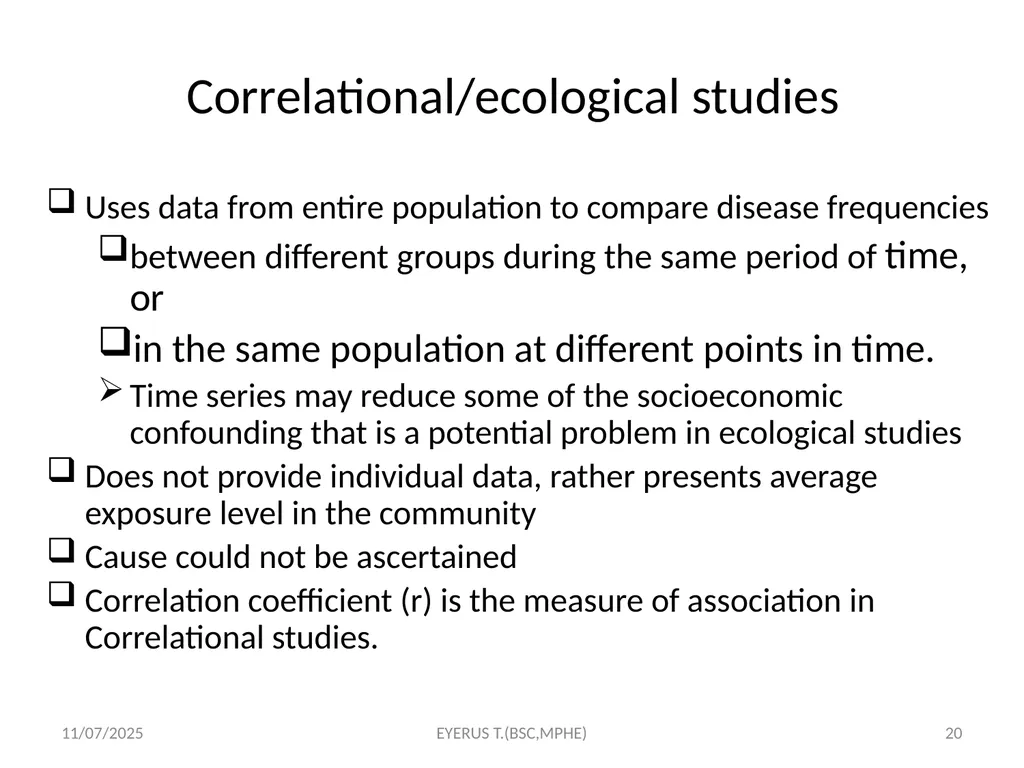
Correlational/ecological studies 20 Uses data from entire population to compare disease frequencies
between different groups during the same period of time, or
in the same population at different points in time.
Time series may reduce some of the socioeconomic confounding that is a potential problem in ecological studies
Does not provide individual data, rather presents average exposure level in the community
Cause could not be ascertained
Correlation coefficient (r) is the measure of association in Correlational studies. 5/17/2020 EYERUS T.(BSC,MPHE)<br>
between different groups during the same period of time, or
in the same population at different points in time.
Time series may reduce some of the socioeconomic confounding that is a potential problem in ecological studies
Does not provide individual data, rather presents average exposure level in the community
Cause could not be ascertained
Correlation coefficient (r) is the measure of association in Correlational studies. 5/17/2020 EYERUS T.(BSC,MPHE)<br>
21
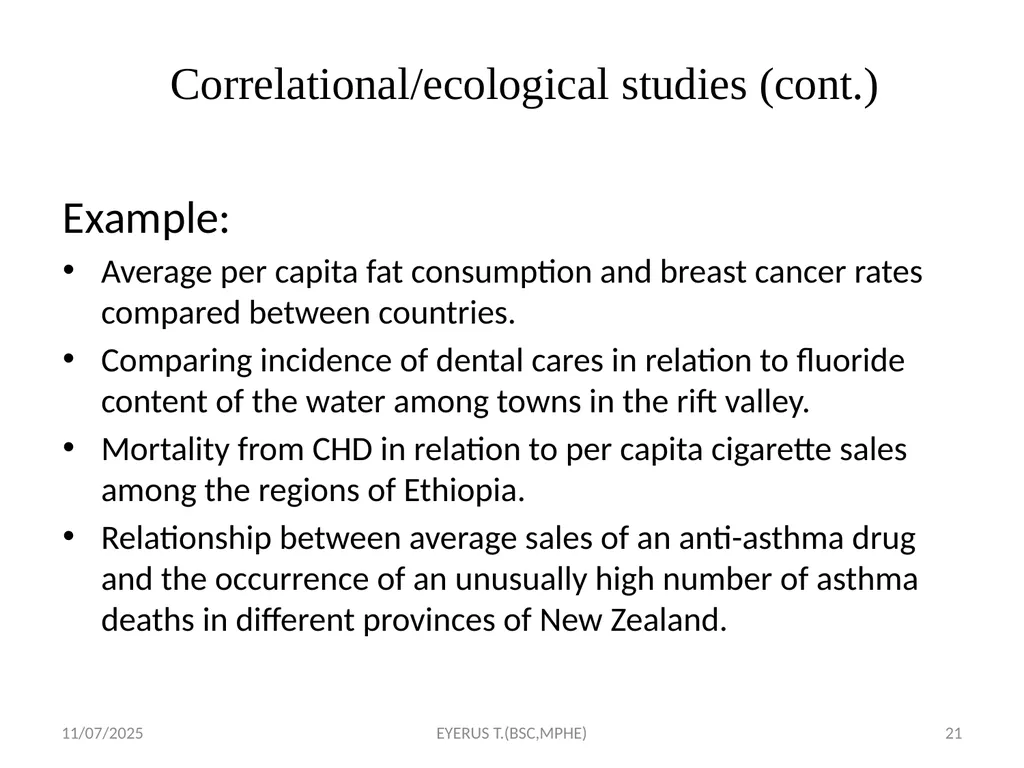
Correlational/ecological studies (cont.) 21 Example:
Average per capita fat consumption and breast cancer rates compared between countries.
Comparing incidence of dental cares in relation to fluoride content of the water among towns in the rift valley.
Mortality from CHD in relation to per capita cigarette sales among the regions of Ethiopia.
Relationship between average sales of an anti-asthma drug and the occurrence of an unusually high number of asthma deaths in different provinces of New Zealand. 5/17/2020 EYERUS T.(BSC,MPHE)<br>
Average per capita fat consumption and breast cancer rates compared between countries.
Comparing incidence of dental cares in relation to fluoride content of the water among towns in the rift valley.
Mortality from CHD in relation to per capita cigarette sales among the regions of Ethiopia.
Relationship between average sales of an anti-asthma drug and the occurrence of an unusually high number of asthma deaths in different provinces of New Zealand. 5/17/2020 EYERUS T.(BSC,MPHE)<br>
22
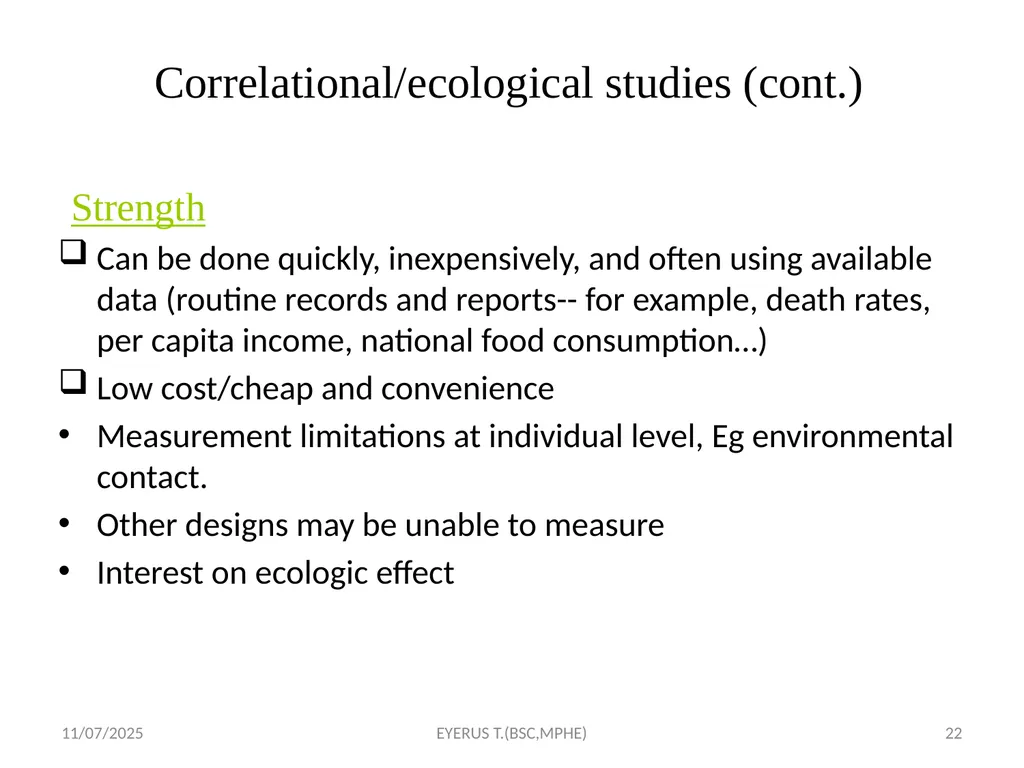
Correlational/ecological studies (cont.) 22 Strength
Can be done quickly, inexpensively, and often using available data (routine records and reports-- for example, death rates, per capita income, national food consumption…)
Low cost/cheap and convenience
Measurement limitations at individual level, Eg environmental contact.
Other designs may be unable to measure
Interest on ecologic effect 5/17/2020 EYERUS T.(BSC,MPHE)<br>
Can be done quickly, inexpensively, and often using available data (routine records and reports-- for example, death rates, per capita income, national food consumption…)
Low cost/cheap and convenience
Measurement limitations at individual level, Eg environmental contact.
Other designs may be unable to measure
Interest on ecologic effect 5/17/2020 EYERUS T.(BSC,MPHE)<br>
23
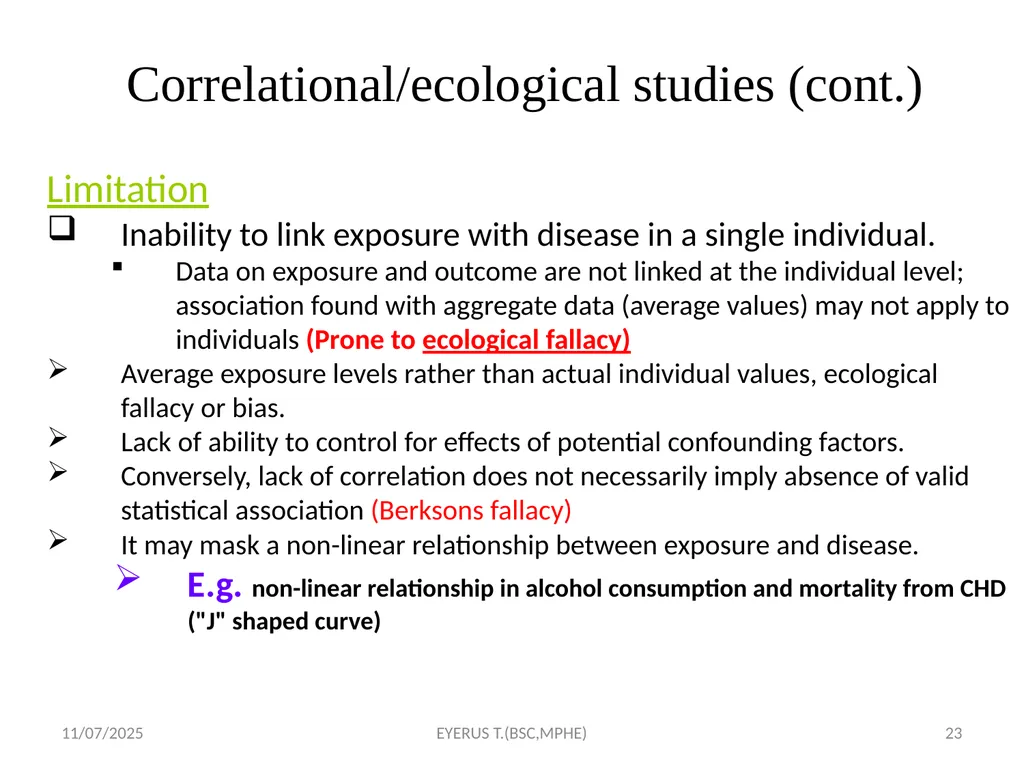
Correlational/ecological studies (cont.) Limitation
Inability to link exposure with disease in a single individual.
Data on exposure and outcome are not linked at the individual level; association found with aggregate data (average values) may not apply to individuals (Prone to ecological fallacy)
Average exposure levels rather than actual individual values, ecological fallacy or bias.
Lack of ability to control for effects of potential confounding factors.
Conversely, lack of correlation does not necessarily imply absence of valid statistical association (Berksons fallacy)
It may mask a non-linear relationship between exposure and disease.
E.g. non-linear relationship in alcohol consumption and mortality from CHD ("J" shaped curve) 23 5/17/2020 EYERUS T.(BSC,MPHE)<br>
Inability to link exposure with disease in a single individual.
Data on exposure and outcome are not linked at the individual level; association found with aggregate data (average values) may not apply to individuals (Prone to ecological fallacy)
Average exposure levels rather than actual individual values, ecological fallacy or bias.
Lack of ability to control for effects of potential confounding factors.
Conversely, lack of correlation does not necessarily imply absence of valid statistical association (Berksons fallacy)
It may mask a non-linear relationship between exposure and disease.
E.g. non-linear relationship in alcohol consumption and mortality from CHD ("J" shaped curve) 23 5/17/2020 EYERUS T.(BSC,MPHE)<br>
24
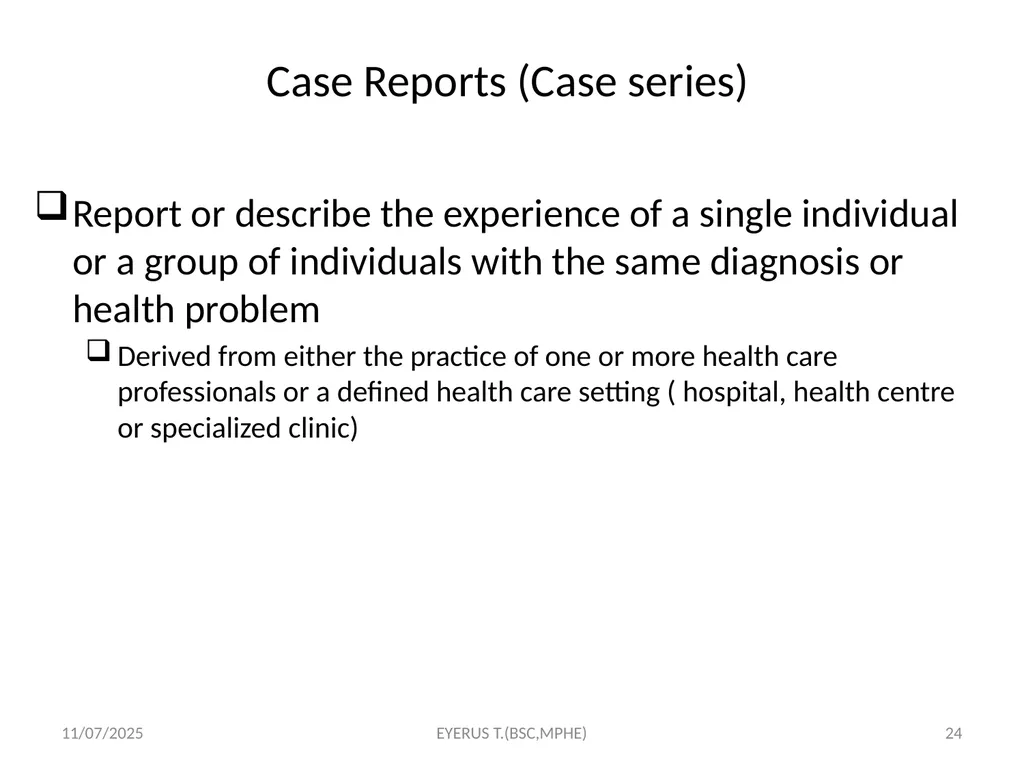
Case Reports (Case series) 24 Report or describe the experience of a single individual or a group of individuals with the same diagnosis or health problem
Derived from either the practice of one or more health care professionals or a defined health care setting ( hospital, health centre or specialized clinic) 5/17/2020 EYERUS T.(BSC,MPHE)<br>
Derived from either the practice of one or more health care professionals or a defined health care setting ( hospital, health centre or specialized clinic) 5/17/2020 EYERUS T.(BSC,MPHE)<br>
25
Case Reports (Case series)… 2.1. Case study/report
A most basic type of descriptive study of individuals comprising of a careful and detailed report of a single patient by one or more physician
E.g. the progress of symptom and sign, response of treatment
It is the study of health profile of a single individual using a careful and detailed report by one or more clinicians
It is common form that is published in articles
It is made using
Simple history, physical examination and Lab./ radiologic investigation 5/17/2020 25 EYERUS T.(BSC,MPHE)<br>
A most basic type of descriptive study of individuals comprising of a careful and detailed report of a single patient by one or more physician
E.g. the progress of symptom and sign, response of treatment
It is the study of health profile of a single individual using a careful and detailed report by one or more clinicians
It is common form that is published in articles
It is made using
Simple history, physical examination and Lab./ radiologic investigation 5/17/2020 25 EYERUS T.(BSC,MPHE)<br>
26
Case Reports … Useful for the recognition of new disease
Important for constructing the natural history of disease
Help to formulate a research hypothesis and detection of epidemics
It was a single case report that formulated the hypothesis of oral contraceptive use increases venous thrombo-embolism 26 5/17/2020 EYERUS T.(BSC,MPHE)<br>
Important for constructing the natural history of disease
Help to formulate a research hypothesis and detection of epidemics
It was a single case report that formulated the hypothesis of oral contraceptive use increases venous thrombo-embolism 26 5/17/2020 EYERUS T.(BSC,MPHE)<br>
27
Case report :Limitations No appropriate comparison group
Cannot be used to test for presence of a valid statistical association
Since based on the experience of one person:
Presence of any risk factor may be coincidental
Not a true epidemiologic design 5/17/2020 27 EYERUS T.(BSC,MPHE)<br>
Cannot be used to test for presence of a valid statistical association
Since based on the experience of one person:
Presence of any risk factor may be coincidental
Not a true epidemiologic design 5/17/2020 27 EYERUS T.(BSC,MPHE)<br>
28
2.2. Case series
A sequence of case reports with common elements such as similar clinical features and suspected common exposures
Individual case report can be expanded to a case series, which describes characteristics of a number of patients (usually 5-12) with a similar disease
Similar to case report, it is usually made on cases having new and/ or unusual disease (giving interest to clinicians)
It is often used to detect the emergence of new disease or an epidemics Case Reports (Case series)… 5/17/2020 28 EYERUS T.(BSC,MPHE)<br>
A sequence of case reports with common elements such as similar clinical features and suspected common exposures
Individual case report can be expanded to a case series, which describes characteristics of a number of patients (usually 5-12) with a similar disease
Similar to case report, it is usually made on cases having new and/ or unusual disease (giving interest to clinicians)
It is often used to detect the emergence of new disease or an epidemics Case Reports (Case series)… 5/17/2020 28 EYERUS T.(BSC,MPHE)<br>
29
Examples of case-series studies Five young, previously health homosexual men were diagnosed as having Pneumocystis carinii pneumonia at Los Angeles hospital during a six month period from 1980 to 1981
This form of pneumonia had been seen almost exclusively among older men and women whose immune systems were suppressed
This unusual circumstance suggested that these individuals were actually suffering with a previously unknown disease, subsequently it was called AIDS 29 5/17/2020 EYERUS T.(BSC,MPHE)<br>
This form of pneumonia had been seen almost exclusively among older men and women whose immune systems were suppressed
This unusual circumstance suggested that these individuals were actually suffering with a previously unknown disease, subsequently it was called AIDS 29 5/17/2020 EYERUS T.(BSC,MPHE)<br>
30
Uses of case series studies Can be valuable early evidence for associations between exposures and diseases which can be studied in more detail
Useful for the recognition of new diseases
Useful for constructing of the natural history of a disease,
Use to formulate a hypothesis and to detect an epidemic 30 5/17/2020 EYERUS T.(BSC,MPHE)<br>
Useful for the recognition of new diseases
Useful for constructing of the natural history of a disease,
Use to formulate a hypothesis and to detect an epidemic 30 5/17/2020 EYERUS T.(BSC,MPHE)<br>
31
Limitations of series studies Are able to formulate a hypothesis but are not able to test for presence of valid association
Their fundamental limitation is presence of a risk factor that is simply coincidental (by chance)
It is difficult to test for association because there is no relevant comparison group
Case-series lack a control (comparison) group, and so can result in false leads, wasted energy and resources 31 5/17/2020 EYERUS T.(BSC,MPHE)<br>
Their fundamental limitation is presence of a risk factor that is simply coincidental (by chance)
It is difficult to test for association because there is no relevant comparison group
Case-series lack a control (comparison) group, and so can result in false leads, wasted energy and resources 31 5/17/2020 EYERUS T.(BSC,MPHE)<br>
32
Case Reports (Case series) (cont.) 32 Strength:
useful for studying signs and symptoms (new syndromes) and creating case definitions for epidemiological studies. Example: AIDS
Case-series that include cases at various stages of an illness from mild cases to dead supplemented by investigation of the past medical history of these cases and observing them to death (doing autopsy as appropriate) can help build up a picture of the natural history of a disease
Very useful in providing critical information, for hypothesis generation. 5/17/2020 EYERUS T.(BSC,MPHE)<br>
useful for studying signs and symptoms (new syndromes) and creating case definitions for epidemiological studies. Example: AIDS
Case-series that include cases at various stages of an illness from mild cases to dead supplemented by investigation of the past medical history of these cases and observing them to death (doing autopsy as appropriate) can help build up a picture of the natural history of a disease
Very useful in providing critical information, for hypothesis generation. 5/17/2020 EYERUS T.(BSC,MPHE)<br>
33
Case Reports (Case series) (cont.) 33 Limitation:
Report is based on single or few patients, which could happen just by coincidence
Lack of an appropriate comparison group
Rates can not be calculated since the population corresponding to the source of cases can not be defined well
Detailed and complete risk factor information is difficult to obtain for all cases from records
Studies are prone to atomistic fallacy (the opposite of ecological fallacy).
Example: at an individual level a high income may be associated with lower rate of suicide but this does not mean that societies which are rich have a lower rate of suicide. 5/17/2020 EYERUS T.(BSC,MPHE)<br>
Report is based on single or few patients, which could happen just by coincidence
Lack of an appropriate comparison group
Rates can not be calculated since the population corresponding to the source of cases can not be defined well
Detailed and complete risk factor information is difficult to obtain for all cases from records
Studies are prone to atomistic fallacy (the opposite of ecological fallacy).
Example: at an individual level a high income may be associated with lower rate of suicide but this does not mean that societies which are rich have a lower rate of suicide. 5/17/2020 EYERUS T.(BSC,MPHE)<br>
34
Cross-Sectional Studies /prevalence survey/ 34 Measure disease and exposure status simultaneously among individuals in a well-defined population at a point in time
Is generally called prevalent study
Snapshot of the health status of populations at a certain point in time
Steps in the conduct of cross-sectional studies:
1. Define a population of interest (reference population)
2. Recruiting a representative sample (adequate size, random selection)
3. Measure the variables of interest (disease &or exposure) at the same point in time
4. Sorting (if necessary) & Analyze the data 5/17/2020 EYERUS T.(BSC,MPHE)<br>
Is generally called prevalent study
Snapshot of the health status of populations at a certain point in time
Steps in the conduct of cross-sectional studies:
1. Define a population of interest (reference population)
2. Recruiting a representative sample (adequate size, random selection)
3. Measure the variables of interest (disease &or exposure) at the same point in time
4. Sorting (if necessary) & Analyze the data 5/17/2020 EYERUS T.(BSC,MPHE)<br>
35
Cross-Sectional Studies (cont.) 35 Characteristics of cross-sectional studies:
Assess both exposure and outcome simultaneously
Are based on point prevalence rates
Are frequently made on total population samples
Subdivision of the total population takes place after data collection unlike in cohort & case- control studies
Are cheaper, easier & useful for studies of exposures that are unalterable over time or relatively permanent features for individuals E.g.-blood group, ethnicity, sex, etc. 5/17/2020 EYERUS T.(BSC,MPHE)<br>
Assess both exposure and outcome simultaneously
Are based on point prevalence rates
Are frequently made on total population samples
Subdivision of the total population takes place after data collection unlike in cohort & case- control studies
Are cheaper, easier & useful for studies of exposures that are unalterable over time or relatively permanent features for individuals E.g.-blood group, ethnicity, sex, etc. 5/17/2020 EYERUS T.(BSC,MPHE)<br>
36
Cross-Sectional Studies (cont.) Data are obtained only once
Individuals with a defined disease, risk factor, or other condition of interest are identified at a point in time
May be used first step in longitudinal or case control studies
Can have descriptive or analytic purposes
The descriptive type is carried out to study prevalence of health related events at a point in time/snapshot
Diseases, risk factors, coverage of interventions, health service utilization, knowledge, attitude and practice
The analytic type is carried out to assess association between exposure and outcome
Exposure and disease status are assessed simultaneously among individuals at the same point in time
Measures of association is made using odds ratio 5/17/2020 36 EYERUS T.(BSC,MPHE)<br>
Individuals with a defined disease, risk factor, or other condition of interest are identified at a point in time
May be used first step in longitudinal or case control studies
Can have descriptive or analytic purposes
The descriptive type is carried out to study prevalence of health related events at a point in time/snapshot
Diseases, risk factors, coverage of interventions, health service utilization, knowledge, attitude and practice
The analytic type is carried out to assess association between exposure and outcome
Exposure and disease status are assessed simultaneously among individuals at the same point in time
Measures of association is made using odds ratio 5/17/2020 36 EYERUS T.(BSC,MPHE)<br>
37
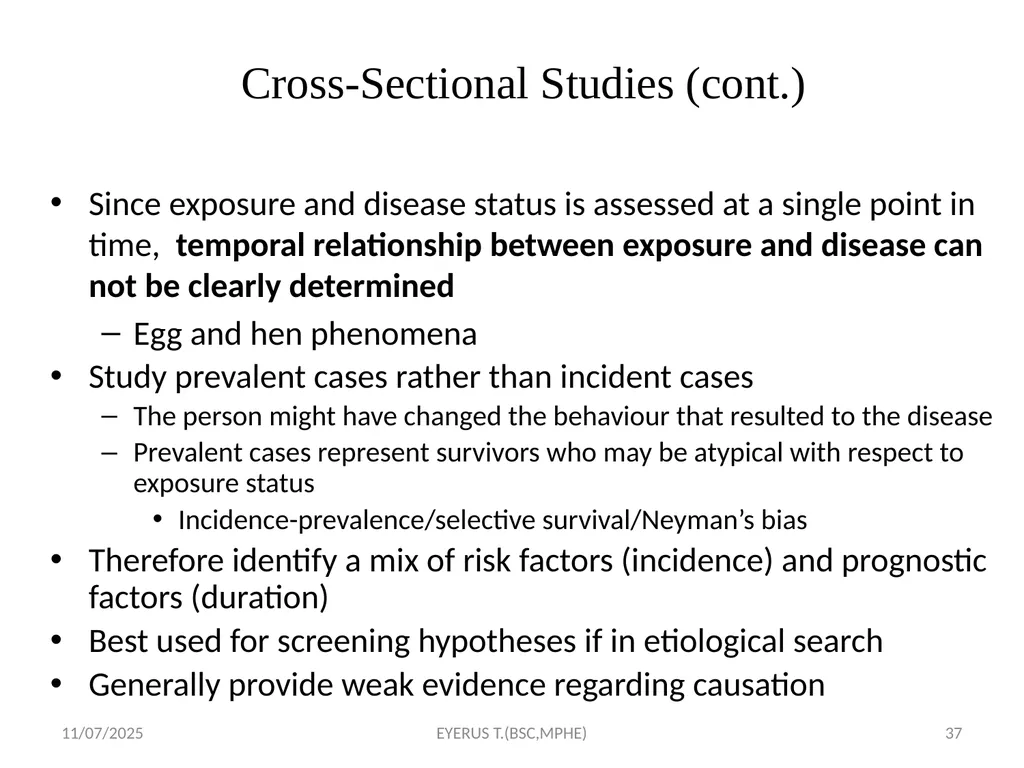
Cross-Sectional Studies (cont.) Since exposure and disease status is assessed at a single point in time, temporal relationship between exposure and disease can not be clearly determined
Egg and hen phenomena
Study prevalent cases rather than incident cases
The person might have changed the behaviour that resulted to the disease
Prevalent cases represent survivors who may be atypical with respect to exposure status
Incidence-prevalence/selective survival/Neyman’s bias
Therefore identify a mix of risk factors (incidence) and prognostic factors (duration)
Best used for screening hypotheses if in etiological search
Generally provide weak evidence regarding causation 5/17/2020 37 EYERUS T.(BSC,MPHE)<br>
Egg and hen phenomena
Study prevalent cases rather than incident cases
The person might have changed the behaviour that resulted to the disease
Prevalent cases represent survivors who may be atypical with respect to exposure status
Incidence-prevalence/selective survival/Neyman’s bias
Therefore identify a mix of risk factors (incidence) and prognostic factors (duration)
Best used for screening hypotheses if in etiological search
Generally provide weak evidence regarding causation 5/17/2020 37 EYERUS T.(BSC,MPHE)<br>
38
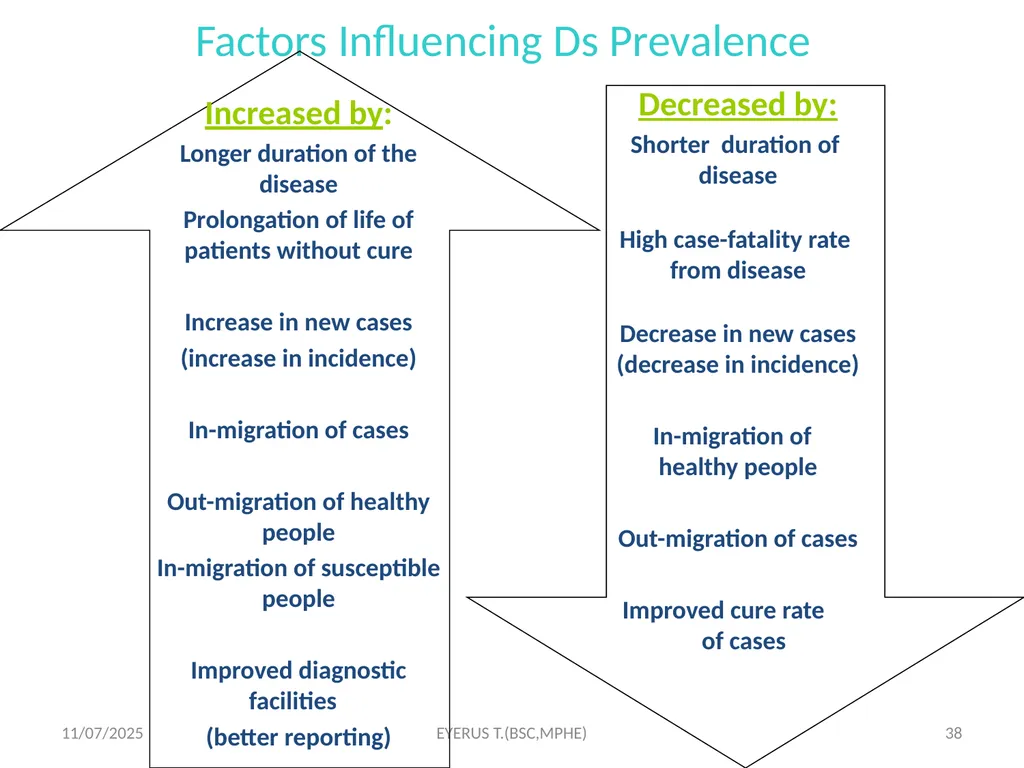
Factors Influencing Ds Prevalence 38 Increased by:
Longer duration of the disease
Prolongation of life of patients without cure
Increase in new cases
(increase in incidence)
In-migration of cases
Out-migration of healthy people
In-migration of susceptible people
Improved diagnostic facilities
(better reporting) Decreased by:
Shorter duration of disease
High case-fatality rate from disease
Decrease in new cases (decrease in incidence)
In-migration of healthy people
Out-migration of cases
Improved cure rate of cases 5/17/2020 EYERUS T.(BSC,MPHE)<br>
Longer duration of the disease
Prolongation of life of patients without cure
Increase in new cases
(increase in incidence)
In-migration of cases
Out-migration of healthy people
In-migration of susceptible people
Improved diagnostic facilities
(better reporting) Decreased by:
Shorter duration of disease
High case-fatality rate from disease
Decrease in new cases (decrease in incidence)
In-migration of healthy people
Out-migration of cases
Improved cure rate of cases 5/17/2020 EYERUS T.(BSC,MPHE)<br>
39
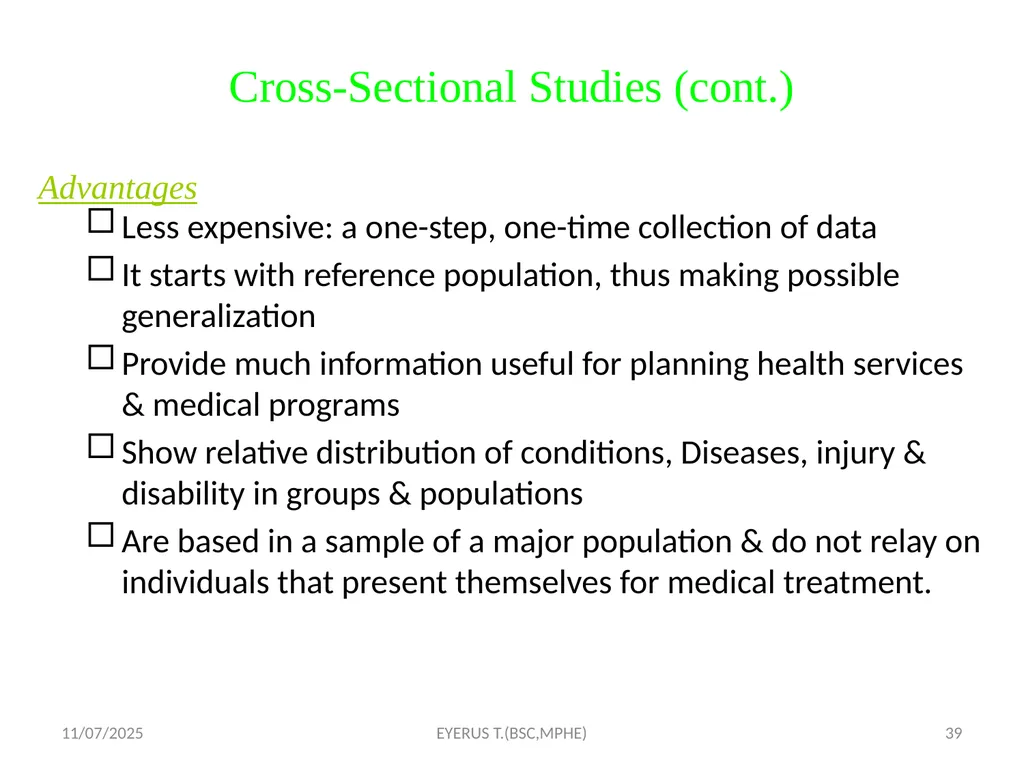
Cross-Sectional Studies (cont.) 39 Advantages
Less expensive: a one-step, one-time collection of data
It starts with reference population, thus making possible generalization
Provide much information useful for planning health services & medical programs
Show relative distribution of conditions, Diseases, injury & disability in groups & populations
Are based in a sample of a major population & do not relay on individuals that present themselves for medical treatment. 5/17/2020 EYERUS T.(BSC,MPHE)<br>
Less expensive: a one-step, one-time collection of data
It starts with reference population, thus making possible generalization
Provide much information useful for planning health services & medical programs
Show relative distribution of conditions, Diseases, injury & disability in groups & populations
Are based in a sample of a major population & do not relay on individuals that present themselves for medical treatment. 5/17/2020 EYERUS T.(BSC,MPHE)<br>
40
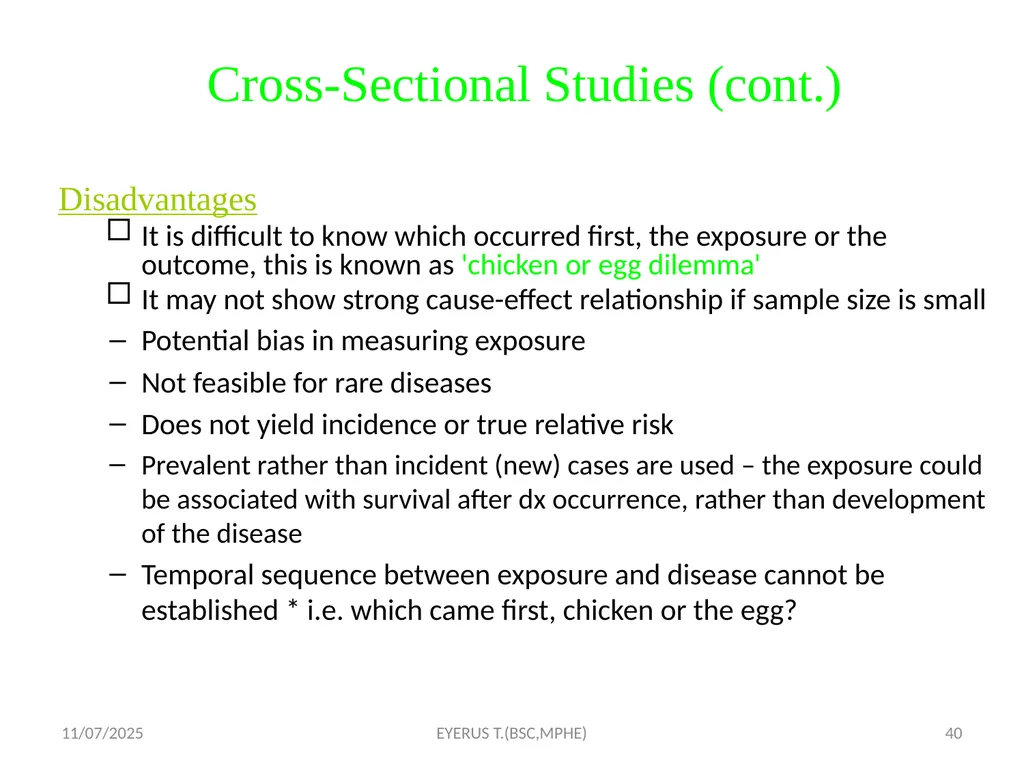
Cross-Sectional Studies (cont.) Disadvantages
It is difficult to know which occurred first, the exposure or the outcome, this is known as 'chicken or egg dilemma'
It may not show strong cause-effect relationship if sample size is small
Potential bias in measuring exposure
Not feasible for rare diseases
Does not yield incidence or true relative risk
Prevalent rather than incident (new) cases are used – the exposure could be associated with survival after dx occurrence, rather than development of the disease
Temporal sequence between exposure and disease cannot be established * i.e. which came first, chicken or the egg? 40 5/17/2020 EYERUS T.(BSC,MPHE)<br>
It is difficult to know which occurred first, the exposure or the outcome, this is known as 'chicken or egg dilemma'
It may not show strong cause-effect relationship if sample size is small
Potential bias in measuring exposure
Not feasible for rare diseases
Does not yield incidence or true relative risk
Prevalent rather than incident (new) cases are used – the exposure could be associated with survival after dx occurrence, rather than development of the disease
Temporal sequence between exposure and disease cannot be established * i.e. which came first, chicken or the egg? 40 5/17/2020 EYERUS T.(BSC,MPHE)<br>
41
ANALYTIC EPIDEMIOLOGIC STUDY PURPOSE
To test hypothesis about causal relationship
To search for cause & effect
To compare treatment regimens / prevention programs
To assess diagnostic tests
To quantify the association b/n exposure & outcome (measure of association)
Focuses on determinants of diagnosis by testing hypothesis 5/17/2020 41 EYERUS T.(BSC,MPHE)<br>
To test hypothesis about causal relationship
To search for cause & effect
To compare treatment regimens / prevention programs
To assess diagnostic tests
To quantify the association b/n exposure & outcome (measure of association)
Focuses on determinants of diagnosis by testing hypothesis 5/17/2020 41 EYERUS T.(BSC,MPHE)<br>
42
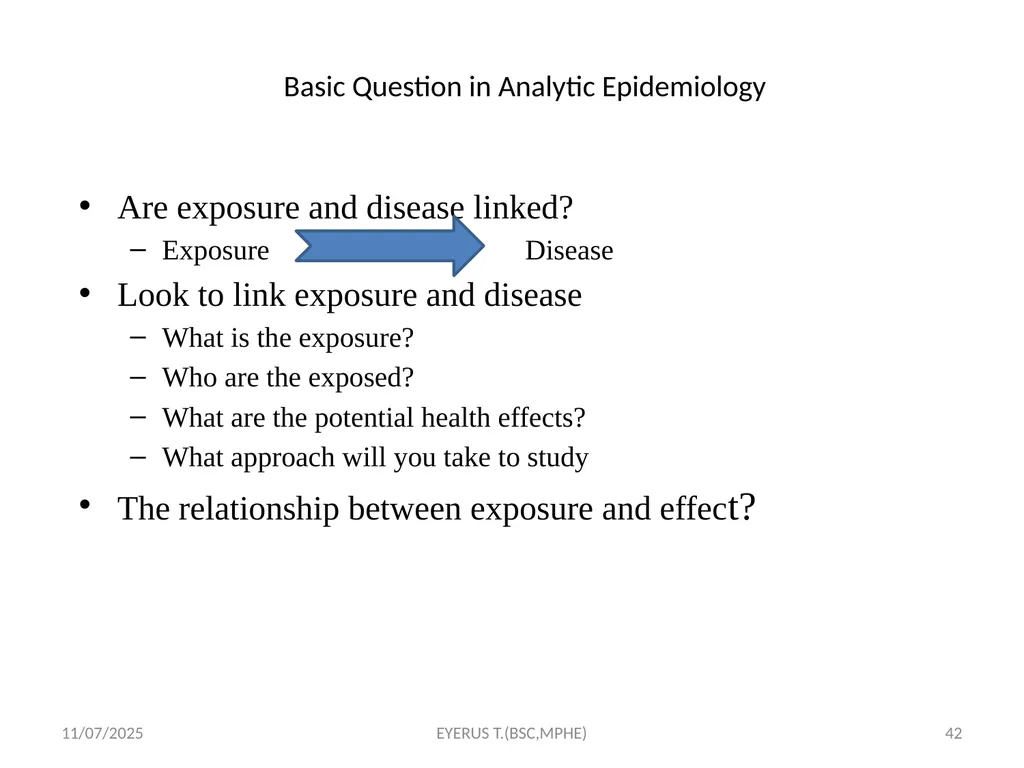
Basic Question in Analytic Epidemiology Are exposure and disease linked?
Exposure Disease
Look to link exposure and disease
What is the exposure?
Who are the exposed?
What are the potential health effects?
What approach will you take to study
The relationship between exposure and effect? 5/17/2020 42 EYERUS T.(BSC,MPHE)<br>
Exposure Disease
Look to link exposure and disease
What is the exposure?
Who are the exposed?
What are the potential health effects?
What approach will you take to study
The relationship between exposure and effect? 5/17/2020 42 EYERUS T.(BSC,MPHE)<br>
43
Time frame of Studies Prospective Study
looks forward,
looks to the future, examines future events, follows a condition, concern or disease into the future
Retrospective Study
to look back´,
looks back in time to study events that have already occurred 5/17/2020 43 EYERUS T.(BSC,MPHE)<br>
looks forward,
looks to the future, examines future events, follows a condition, concern or disease into the future
Retrospective Study
to look back´,
looks back in time to study events that have already occurred 5/17/2020 43 EYERUS T.(BSC,MPHE)<br>
44
Types of analytic study design There are two types of analytic study designs
Observational- to simply observe
Interventional - manipulation or determination
OBSERVATIONAL STUDIES
Information is obtained by simple observation of the event (two basic types): -
Case control study
Cohort study
Cross sectional (some times) 5/17/2020 44 EYERUS T.(BSC,MPHE)<br>
Observational- to simply observe
Interventional - manipulation or determination
OBSERVATIONAL STUDIES
Information is obtained by simple observation of the event (two basic types): -
Case control study
Cohort study
Cross sectional (some times) 5/17/2020 44 EYERUS T.(BSC,MPHE)<br>
45
Case-Control Studies Syn: case-comparison study, case-referent study, retrospective study
Defn: past history of exposure is compared in cases and their controls for their exposure status
Look back at exposure (retrospective) - It assess retrospectively on exposure status.
Case control studies aim to identify potential associations between ‘risk’ factors or exposure and a particular disease or outcome 45 5/17/2020 EYERUS T.(BSC,MPHE)<br>
Defn: past history of exposure is compared in cases and their controls for their exposure status
Look back at exposure (retrospective) - It assess retrospectively on exposure status.
Case control studies aim to identify potential associations between ‘risk’ factors or exposure and a particular disease or outcome 45 5/17/2020 EYERUS T.(BSC,MPHE)<br>
46
Case-Control Studies… Unit of observation and analysis: Individual (not group)
Case-control studies are the most frequently undertaken analytical epidemiological studies
They are the only practical approach for identifying risk factors for rare diseases
They are best suited to the study of diseases for which medical care is sought, such as cancers or hip fracture
It is relatively cheaper
Measure of association is using OR 46 5/17/2020 EYERUS T.(BSC,MPHE)<br>
Case-control studies are the most frequently undertaken analytical epidemiological studies
They are the only practical approach for identifying risk factors for rare diseases
They are best suited to the study of diseases for which medical care is sought, such as cancers or hip fracture
It is relatively cheaper
Measure of association is using OR 46 5/17/2020 EYERUS T.(BSC,MPHE)<br>
47
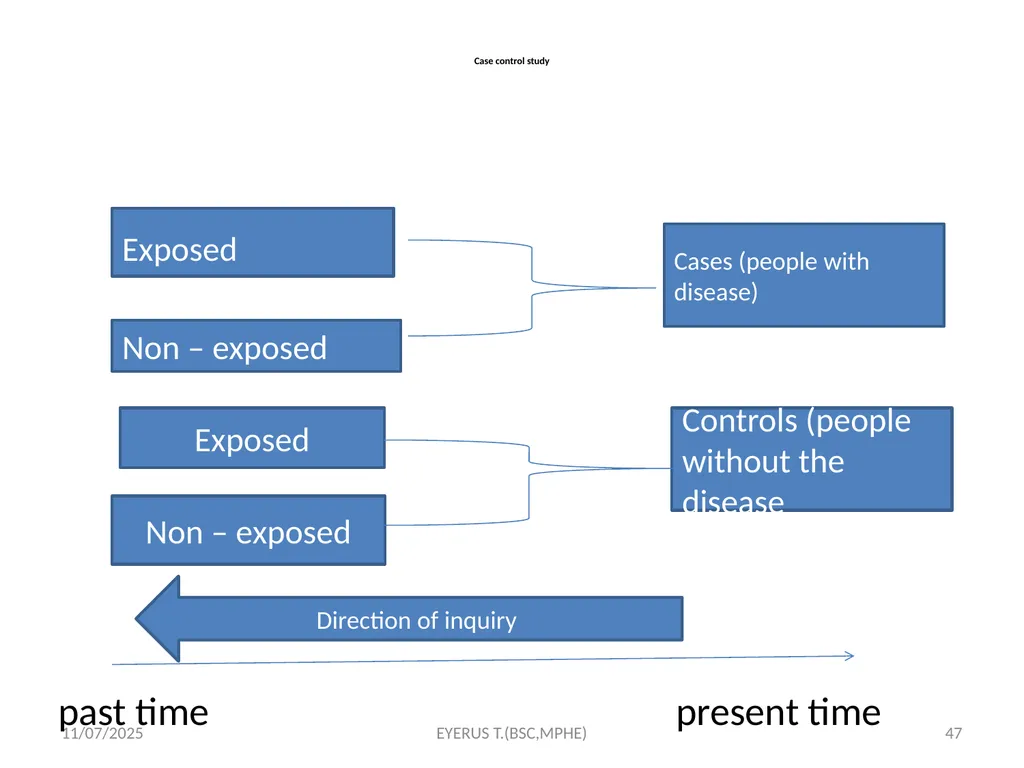
Case control study past time present time Non – exposed Exposed Cases (people with disease) Controls (people without the disease Exposed Non – exposed Direction of inquiry 5/17/2020 47 EYERUS T.(BSC,MPHE)<br>
48
Case-control design Select a group of subjects with disease (cases) and
Try to characterize their pre-disease exposure status
Select a group of subjects without disease (controls)
try to characterize their exposure status
Compare how common exposure was among cases with how common it was among controls, as a measure of exposure-disease association (measure of association) 5/17/2020 48 EYERUS T.(BSC,MPHE)<br>
Try to characterize their pre-disease exposure status
Select a group of subjects without disease (controls)
try to characterize their exposure status
Compare how common exposure was among cases with how common it was among controls, as a measure of exposure-disease association (measure of association) 5/17/2020 48 EYERUS T.(BSC,MPHE)<br>
49
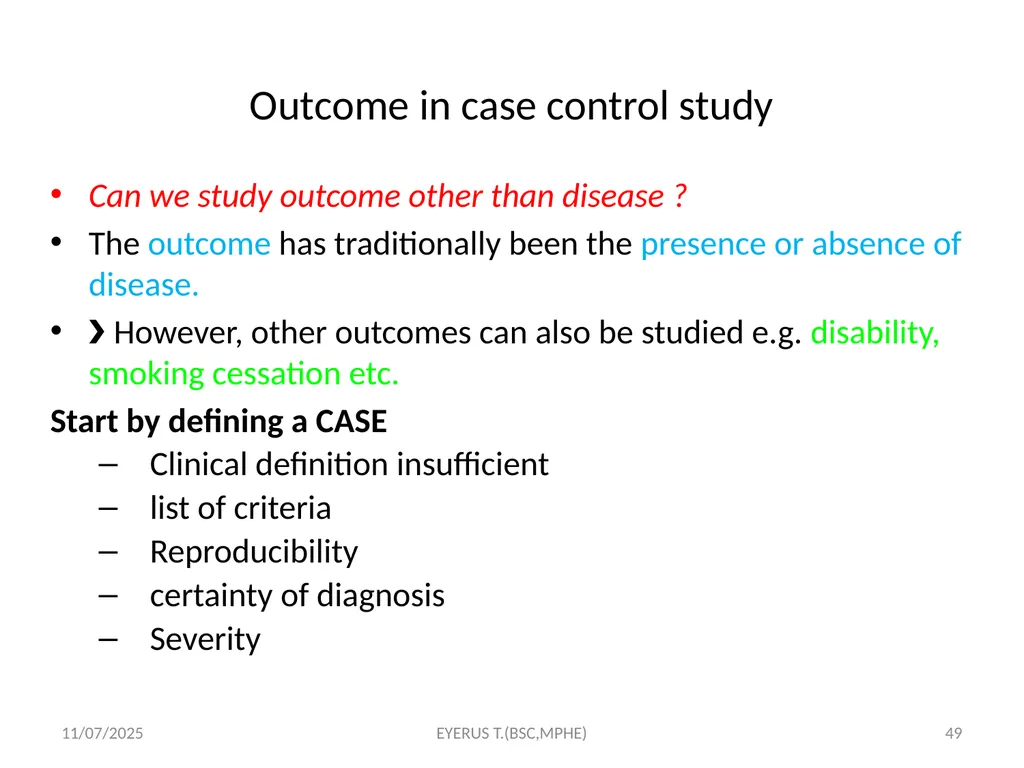
Outcome in case control study Can we study outcome other than disease ?
The outcome has traditionally been the presence or absence of disease.
However, other outcomes can also be studied e.g. disability, smoking cessation etc.
Start by defining a CASE
Clinical definition insufficient
list of criteria
Reproducibility
certainty of diagnosis
Severity 5/17/2020 49 EYERUS T.(BSC,MPHE)<br>
The outcome has traditionally been the presence or absence of disease.
However, other outcomes can also be studied e.g. disability, smoking cessation etc.
Start by defining a CASE
Clinical definition insufficient
list of criteria
Reproducibility
certainty of diagnosis
Severity 5/17/2020 49 EYERUS T.(BSC,MPHE)<br>
50
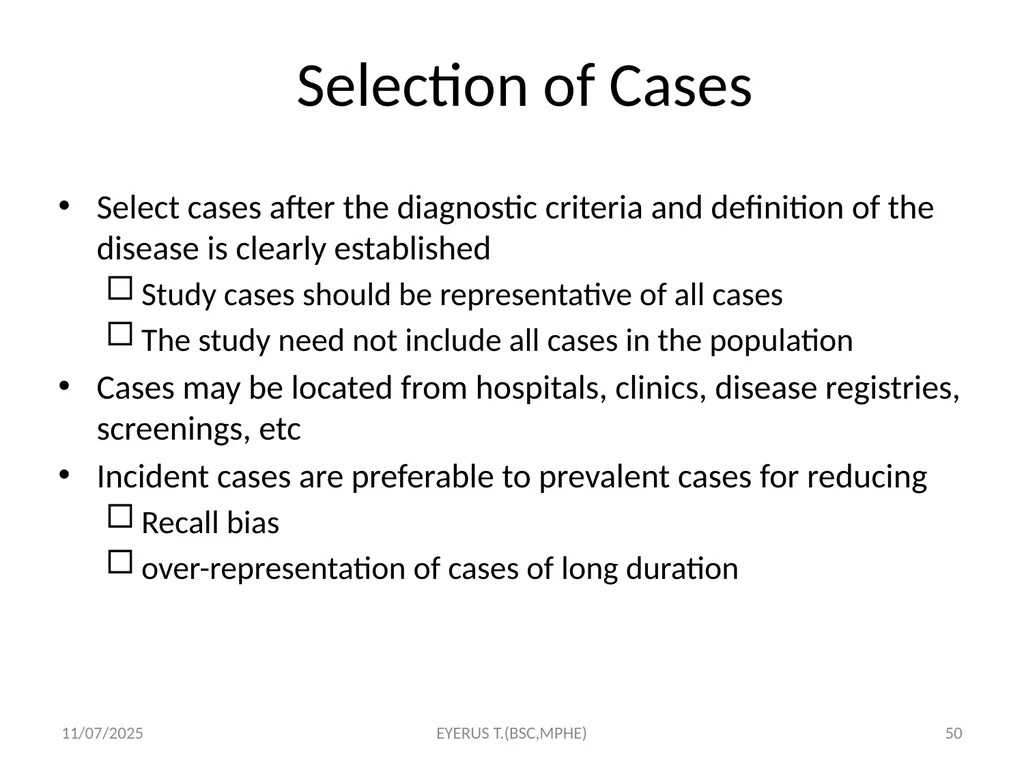
Selection of Cases 50 Select cases after the diagnostic criteria and definition of the disease is clearly established
Study cases should be representative of all cases
The study need not include all cases in the population
Cases may be located from hospitals, clinics, disease registries, screenings, etc
Incident cases are preferable to prevalent cases for reducing
Recall bias
over-representation of cases of long duration 5/17/2020 EYERUS T.(BSC,MPHE)<br>
Study cases should be representative of all cases
The study need not include all cases in the population
Cases may be located from hospitals, clinics, disease registries, screenings, etc
Incident cases are preferable to prevalent cases for reducing
Recall bias
over-representation of cases of long duration 5/17/2020 EYERUS T.(BSC,MPHE)<br>
51
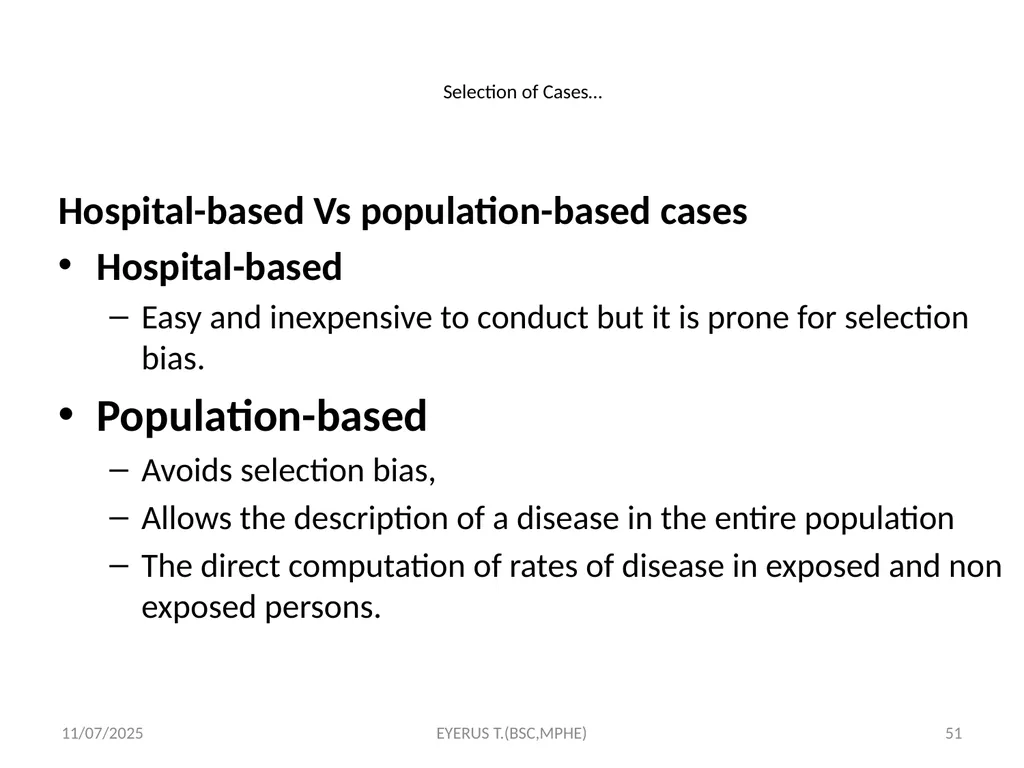
Selection of Cases… 51 Hospital-based Vs population-based cases
Hospital-based
Easy and inexpensive to conduct but it is prone for selection bias.
Population-based
Avoids selection bias,
Allows the description of a disease in the entire population
The direct computation of rates of disease in exposed and non exposed persons. 5/17/2020 EYERUS T.(BSC,MPHE)<br>
Hospital-based
Easy and inexpensive to conduct but it is prone for selection bias.
Population-based
Avoids selection bias,
Allows the description of a disease in the entire population
The direct computation of rates of disease in exposed and non exposed persons. 5/17/2020 EYERUS T.(BSC,MPHE)<br>
52
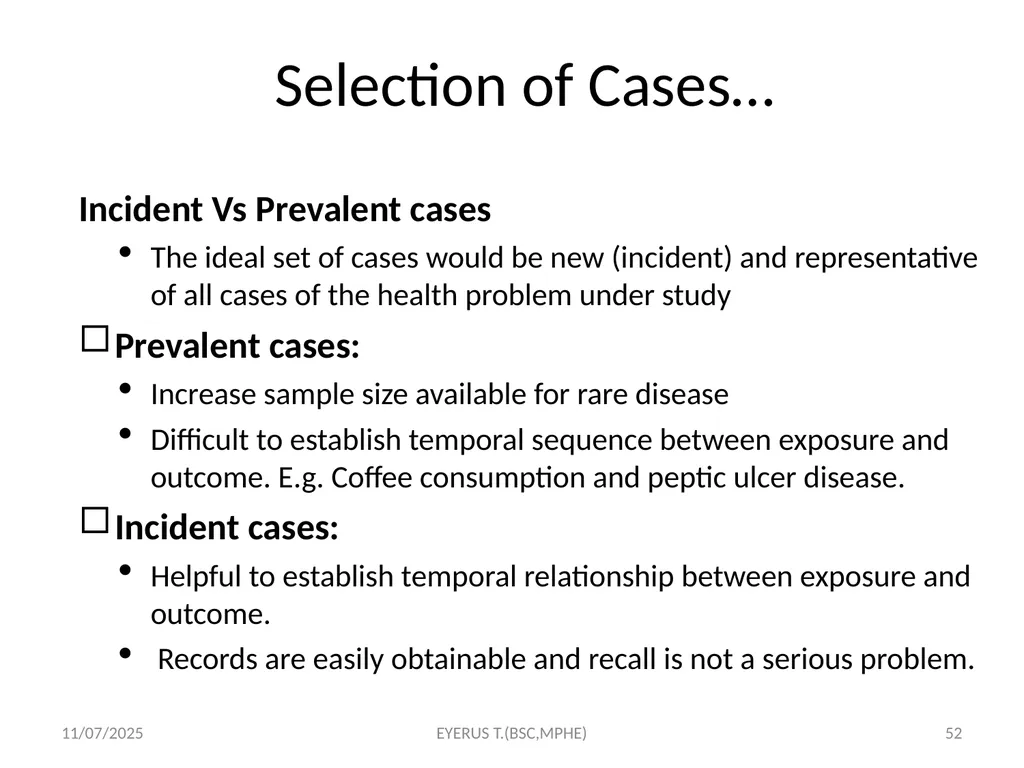
Selection of Cases… 52 Incident Vs Prevalent cases
The ideal set of cases would be new (incident) and representative of all cases of the health problem under study
Prevalent cases:
Increase sample size available for rare disease
Difficult to establish temporal sequence between exposure and outcome. E.g. Coffee consumption and peptic ulcer disease.
Incident cases:
Helpful to establish temporal relationship between exposure and outcome.
Records are easily obtainable and recall is not a serious problem. 5/17/2020 EYERUS T.(BSC,MPHE)<br>
The ideal set of cases would be new (incident) and representative of all cases of the health problem under study
Prevalent cases:
Increase sample size available for rare disease
Difficult to establish temporal sequence between exposure and outcome. E.g. Coffee consumption and peptic ulcer disease.
Incident cases:
Helpful to establish temporal relationship between exposure and outcome.
Records are easily obtainable and recall is not a serious problem. 5/17/2020 EYERUS T.(BSC,MPHE)<br>
53
Selection of Controls 53 Main challenge in case-control studies
Controls should come from the same population at risk for the disease as the cases
Should be similar to cases, except for disease status
E.g., hospital controls for hospital cases
Should be representative of all persons at risk for the disease in the population
E.g., population-based controls
Multiple controls can be used to help add statistical power when cases are unduly difficult to obtain
Using more than one control group lends credibility to the results
More than 3 controls for a case is usually not cost-efficient 5/17/2020 EYERUS T.(BSC,MPHE)<br>
Controls should come from the same population at risk for the disease as the cases
Should be similar to cases, except for disease status
E.g., hospital controls for hospital cases
Should be representative of all persons at risk for the disease in the population
E.g., population-based controls
Multiple controls can be used to help add statistical power when cases are unduly difficult to obtain
Using more than one control group lends credibility to the results
More than 3 controls for a case is usually not cost-efficient 5/17/2020 EYERUS T.(BSC,MPHE)<br>
54
Selection of Controls… Non-hospitalized Controls
Population-based (random sample)
Costly and difficult
School rosters, neighborhood, friends
Similar socioeconomic status (SES)
Hospitalized Controls
Captive source (compliant and economical)
Better recall of exposures
But hard to define reference population
Are a selected group
E.g., more smokers, drinkers and oral contraceptive users
Select specific “other diagnosis?” 54 5/17/2020 EYERUS T.(BSC,MPHE)<br>
Population-based (random sample)
Costly and difficult
School rosters, neighborhood, friends
Similar socioeconomic status (SES)
Hospitalized Controls
Captive source (compliant and economical)
Better recall of exposures
But hard to define reference population
Are a selected group
E.g., more smokers, drinkers and oral contraceptive users
Select specific “other diagnosis?” 54 5/17/2020 EYERUS T.(BSC,MPHE)<br>
55
How many cases and controls? Based on:
Availability of cases and controls
List the main risk factors
Review the prevalence of the risk factor in the controls
What would be the expected prevalence of the risk factor in controls 55 5/17/2020 EYERUS T.(BSC,MPHE)<br>
Availability of cases and controls
List the main risk factors
Review the prevalence of the risk factor in the controls
What would be the expected prevalence of the risk factor in controls 55 5/17/2020 EYERUS T.(BSC,MPHE)<br>
56
Case control: numbers and ratio A single control group is optimal in most studies
Add more control groups only
when you are not confident with the control group or
when you see a clear deficiency in your control group or
when there is a clear advantage by adding another control
Conditions for multiple controls:
when a single control group is considered to be not appropriate
when the selected group has a specific deficiency that could be avoided by inclusion of another control group
Control-case ratio
Efficiency of a study can be maximized up to control-case ratio of 4:1 5/17/2020 56 EYERUS T.(BSC,MPHE)<br>
Add more control groups only
when you are not confident with the control group or
when you see a clear deficiency in your control group or
when there is a clear advantage by adding another control
Conditions for multiple controls:
when a single control group is considered to be not appropriate
when the selected group has a specific deficiency that could be avoided by inclusion of another control group
Control-case ratio
Efficiency of a study can be maximized up to control-case ratio of 4:1 5/17/2020 56 EYERUS T.(BSC,MPHE)<br>
57
Selection of controls Considerations:
Avoiding selection bias
Avoiding information (‘recall’) bias 5/17/2020 57 EYERUS T.(BSC,MPHE)<br>
Avoiding selection bias
Avoiding information (‘recall’) bias 5/17/2020 57 EYERUS T.(BSC,MPHE)<br>
58
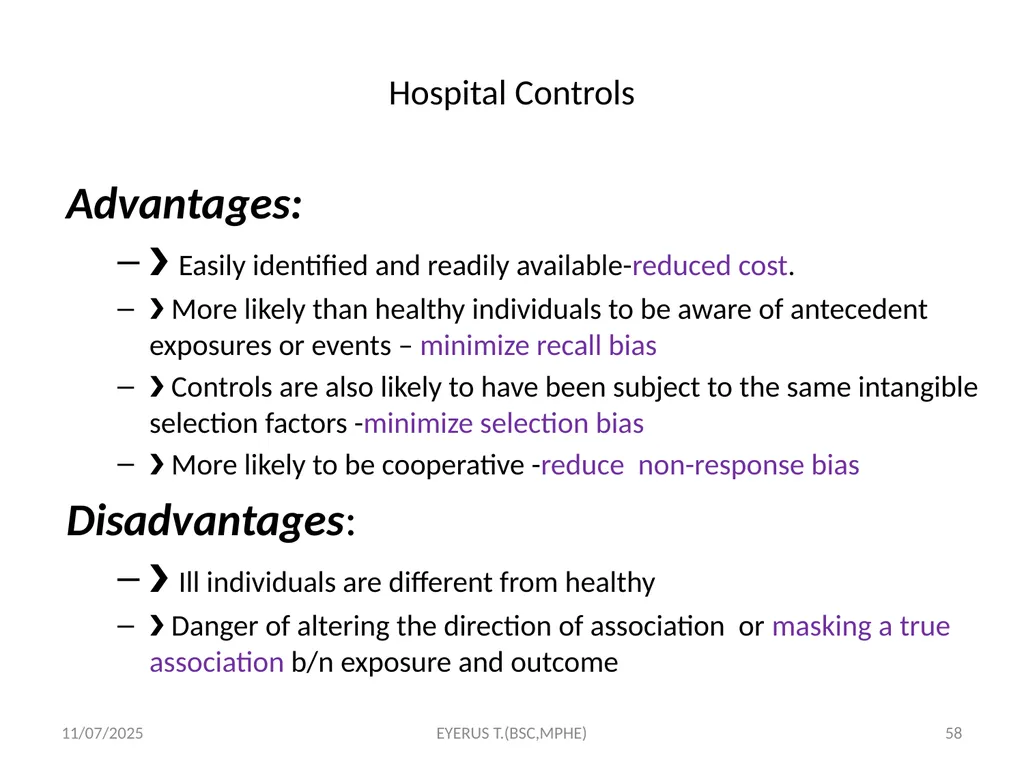
Hospital Controls Advantages:
Easily identified and readily available-reduced cost.
More likely than healthy individuals to be aware of antecedent exposures or events – minimize recall bias
Controls are also likely to have been subject to the same intangible selection factors -minimize selection bias
More likely to be cooperative -reduce non-response bias
Disadvantages:
Ill individuals are different from healthy
Danger of altering the direction of association or masking a true association b/n exposure and outcome 5/17/2020 58 EYERUS T.(BSC,MPHE)<br>
Easily identified and readily available-reduced cost.
More likely than healthy individuals to be aware of antecedent exposures or events – minimize recall bias
Controls are also likely to have been subject to the same intangible selection factors -minimize selection bias
More likely to be cooperative -reduce non-response bias
Disadvantages:
Ill individuals are different from healthy
Danger of altering the direction of association or masking a true association b/n exposure and outcome 5/17/2020 58 EYERUS T.(BSC,MPHE)<br>
59
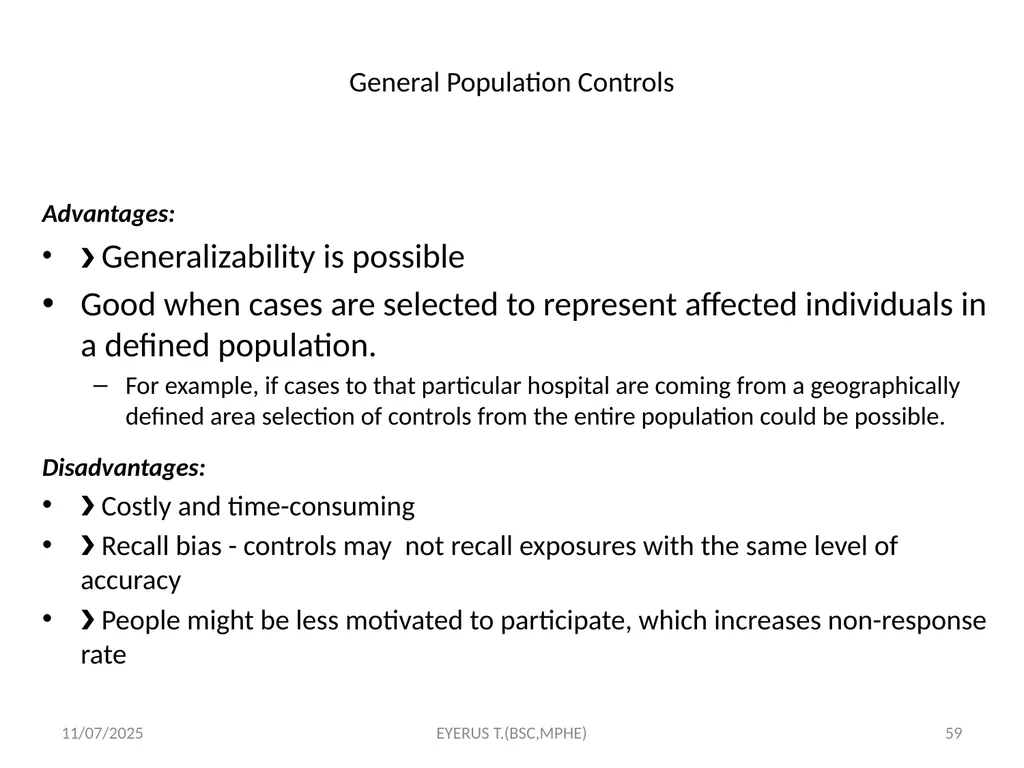
General Population Controls Advantages:
Generalizability is possible
Good when cases are selected to represent affected individuals in a defined population.
For example, if cases to that particular hospital are coming from a geographically defined area selection of controls from the entire population could be possible.
Disadvantages:
Costly and time-consuming
Recall bias - controls may not recall exposures with the same level of accuracy
People might be less motivated to participate, which increases non-response rate 5/17/2020 59 EYERUS T.(BSC,MPHE)<br>
Generalizability is possible
Good when cases are selected to represent affected individuals in a defined population.
For example, if cases to that particular hospital are coming from a geographically defined area selection of controls from the entire population could be possible.
Disadvantages:
Costly and time-consuming
Recall bias - controls may not recall exposures with the same level of accuracy
People might be less motivated to participate, which increases non-response rate 5/17/2020 59 EYERUS T.(BSC,MPHE)<br>
60
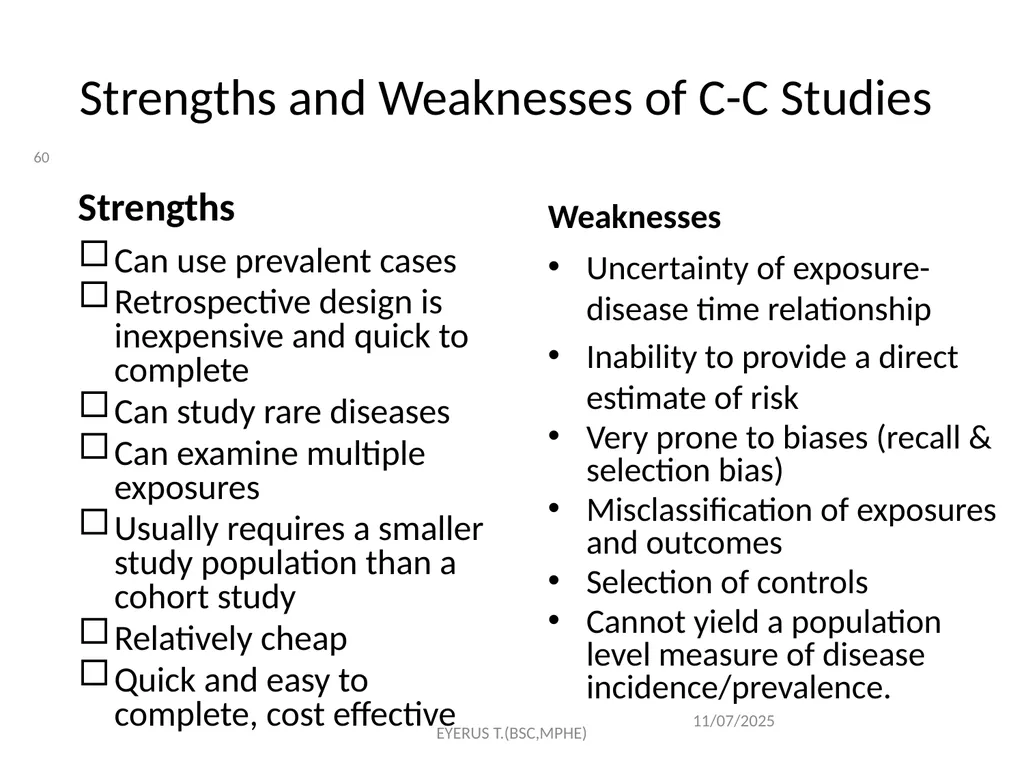
Strengths and Weaknesses of C-C Studies Can use prevalent cases
Retrospective design is inexpensive and quick to complete
Can study rare diseases
Can examine multiple exposures
Usually requires a smaller study population than a cohort study
Relatively cheap
Quick and easy to complete, cost effective Uncertainty of exposure-disease time relationship
Inability to provide a direct estimate of risk
Very prone to biases (recall & selection bias)
Misclassification of exposures and outcomes
Selection of controls
Cannot yield a population level measure of disease incidence/prevalence. 60 Strengths Weaknesses 5/17/2020 EYERUS T.(BSC,MPHE)<br>
Retrospective design is inexpensive and quick to complete
Can study rare diseases
Can examine multiple exposures
Usually requires a smaller study population than a cohort study
Relatively cheap
Quick and easy to complete, cost effective Uncertainty of exposure-disease time relationship
Inability to provide a direct estimate of risk
Very prone to biases (recall & selection bias)
Misclassification of exposures and outcomes
Selection of controls
Cannot yield a population level measure of disease incidence/prevalence. 60 Strengths Weaknesses 5/17/2020 EYERUS T.(BSC,MPHE)<br>
61
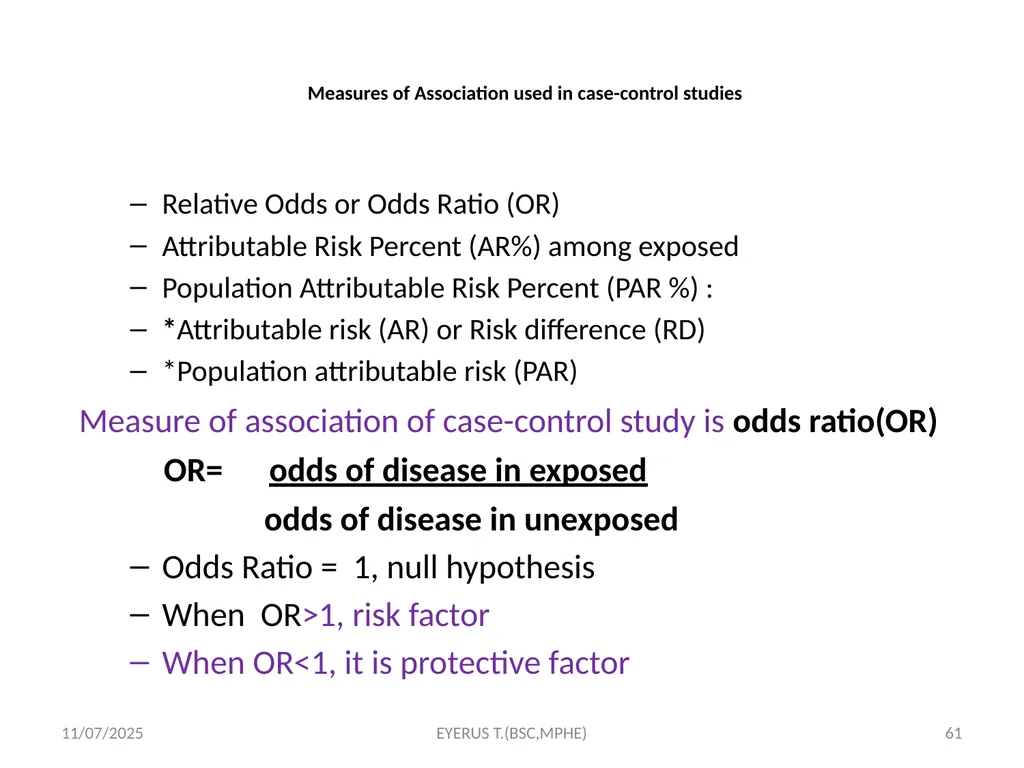
Measures of Association used in case-control studies 61 Relative Odds or Odds Ratio (OR)
Attributable Risk Percent (AR%) among exposed
Population Attributable Risk Percent (PAR %) :
*Attributable risk (AR) or Risk difference (RD)
*Population attributable risk (PAR)
Measure of association of case-control study is odds ratio(OR)
OR= odds of disease in exposed
odds of disease in unexposed
Odds Ratio = 1, null hypothesis
When OR>1, risk factor
When OR<1, it is protective factor 5/17/2020 EYERUS T.(BSC,MPHE)<br>
Attributable Risk Percent (AR%) among exposed
Population Attributable Risk Percent (PAR %) :
*Attributable risk (AR) or Risk difference (RD)
*Population attributable risk (PAR)
Measure of association of case-control study is odds ratio(OR)
OR= odds of disease in exposed
odds of disease in unexposed
Odds Ratio = 1, null hypothesis
When OR>1, risk factor
When OR<1, it is protective factor 5/17/2020 EYERUS T.(BSC,MPHE)<br>
62
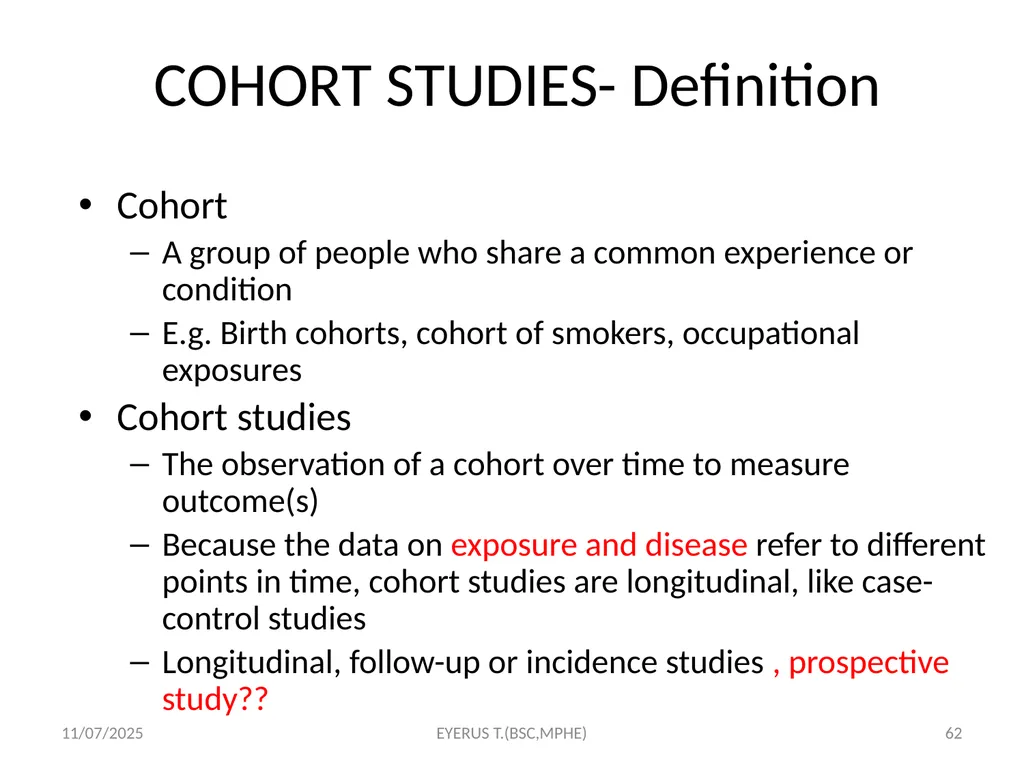
COHORT STUDIES- Definition 62 Cohort
A group of people who share a common experience or condition
E.g. Birth cohorts, cohort of smokers, occupational exposures
Cohort studies
The observation of a cohort over time to measure outcome(s)
Because the data on exposure and disease refer to different points in time, cohort studies are longitudinal, like case-control studies
Longitudinal, follow-up or incidence studies , prospective study?? 5/17/2020 EYERUS T.(BSC,MPHE)<br>
A group of people who share a common experience or condition
E.g. Birth cohorts, cohort of smokers, occupational exposures
Cohort studies
The observation of a cohort over time to measure outcome(s)
Because the data on exposure and disease refer to different points in time, cohort studies are longitudinal, like case-control studies
Longitudinal, follow-up or incidence studies , prospective study?? 5/17/2020 EYERUS T.(BSC,MPHE)<br>
63
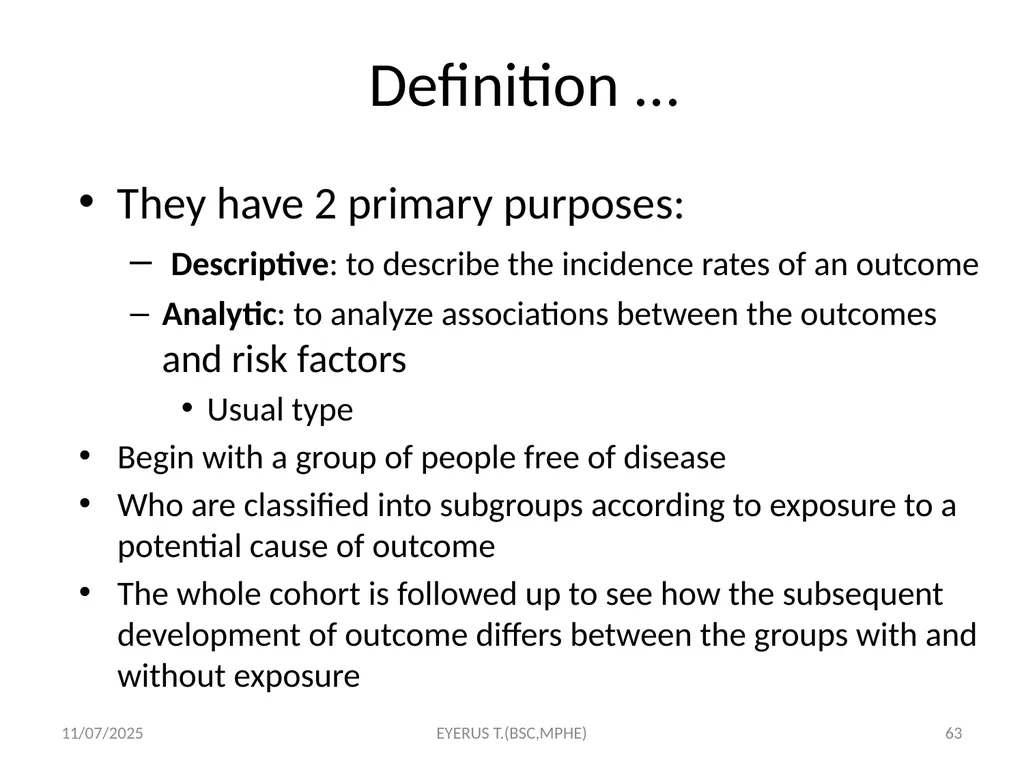
Definition ... 63 They have 2 primary purposes:
Descriptive: to describe the incidence rates of an outcome
Analytic: to analyze associations between the outcomes and risk factors
Usual type
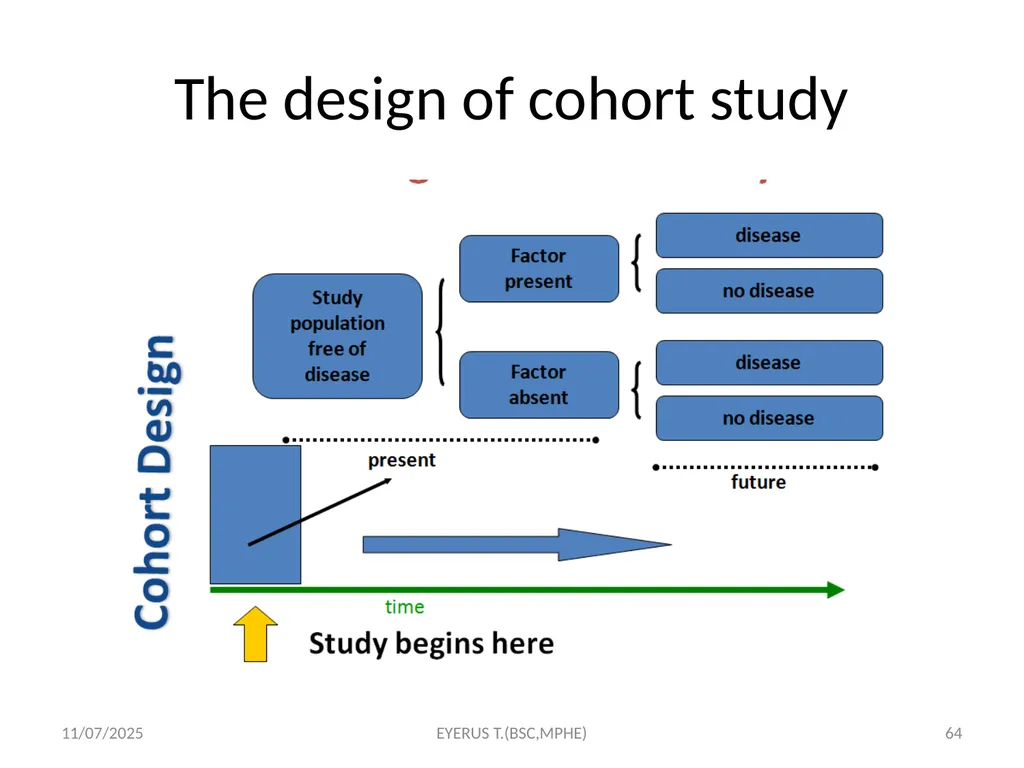
Begin with a group of people free of disease
Who are classified into subgroups according to exposure to a potential cause of outcome
The whole cohort is followed up to see how the subsequent development of outcome differs between the groups with and without exposure 5/17/2020 EYERUS T.(BSC,MPHE)<br>
Descriptive: to describe the incidence rates of an outcome
Analytic: to analyze associations between the outcomes and risk factors
Usual type
Begin with a group of people free of disease
Who are classified into subgroups according to exposure to a potential cause of outcome
The whole cohort is followed up to see how the subsequent development of outcome differs between the groups with and without exposure 5/17/2020 EYERUS T.(BSC,MPHE)<br>
64
The design of cohort study 5/17/2020 EYERUS T.(BSC,MPHE) 64<br>
65
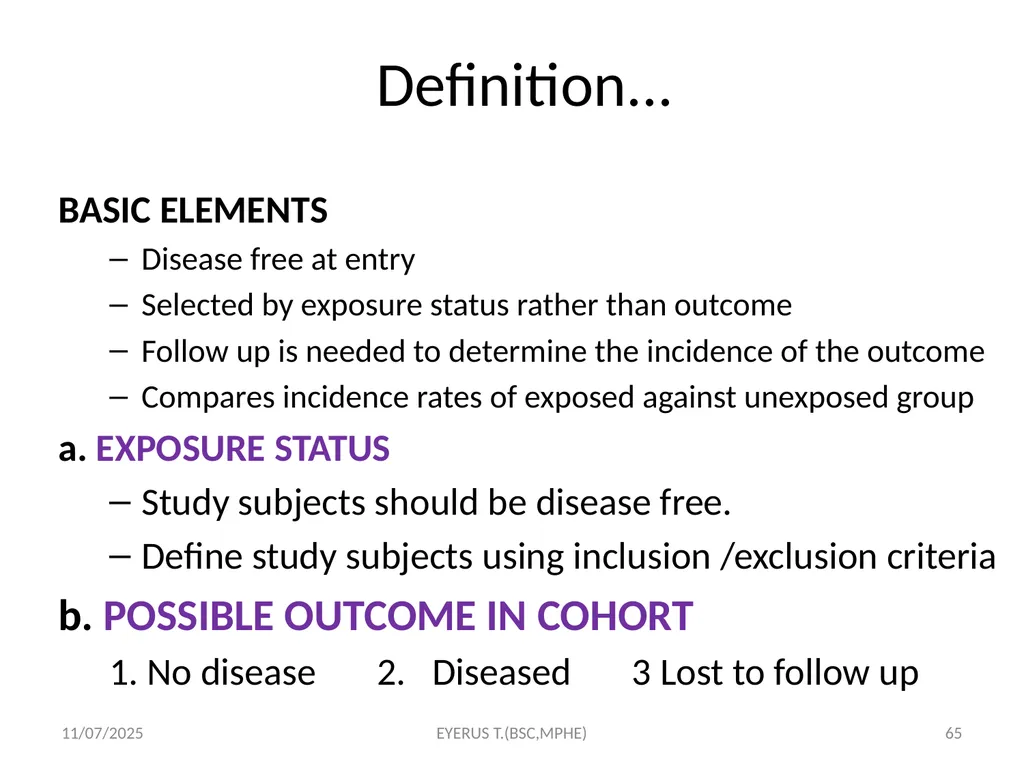
Definition... 65 BASIC ELEMENTS
Disease free at entry
Selected by exposure status rather than outcome
Follow up is needed to determine the incidence of the outcome
Compares incidence rates of exposed against unexposed group
a. EXPOSURE STATUS
Study subjects should be disease free.
Define study subjects using inclusion /exclusion criteria
b. POSSIBLE OUTCOME IN COHORT
1. No disease 2. Diseased 3 Lost to follow up 5/17/2020 EYERUS T.(BSC,MPHE)<br>
Disease free at entry
Selected by exposure status rather than outcome
Follow up is needed to determine the incidence of the outcome
Compares incidence rates of exposed against unexposed group
a. EXPOSURE STATUS
Study subjects should be disease free.
Define study subjects using inclusion /exclusion criteria
b. POSSIBLE OUTCOME IN COHORT
1. No disease 2. Diseased 3 Lost to follow up 5/17/2020 EYERUS T.(BSC,MPHE)<br>
66
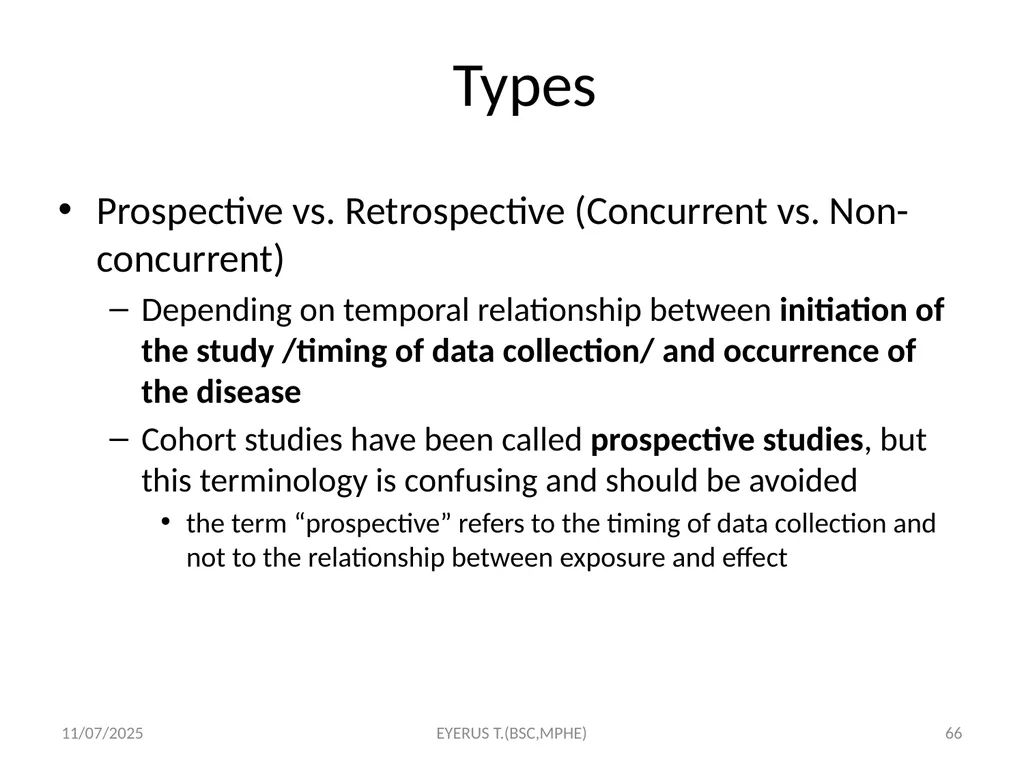
Types 66 Prospective vs. Retrospective (Concurrent vs. Non-concurrent)
Depending on temporal relationship between initiation of the study /timing of data collection/ and occurrence of the disease
Cohort studies have been called prospective studies, but this terminology is confusing and should be avoided
the term “prospective” refers to the timing of data collection and not to the relationship between exposure and effect 5/17/2020 EYERUS T.(BSC,MPHE)<br>
Depending on temporal relationship between initiation of the study /timing of data collection/ and occurrence of the disease
Cohort studies have been called prospective studies, but this terminology is confusing and should be avoided
the term “prospective” refers to the timing of data collection and not to the relationship between exposure and effect 5/17/2020 EYERUS T.(BSC,MPHE)<br>
67
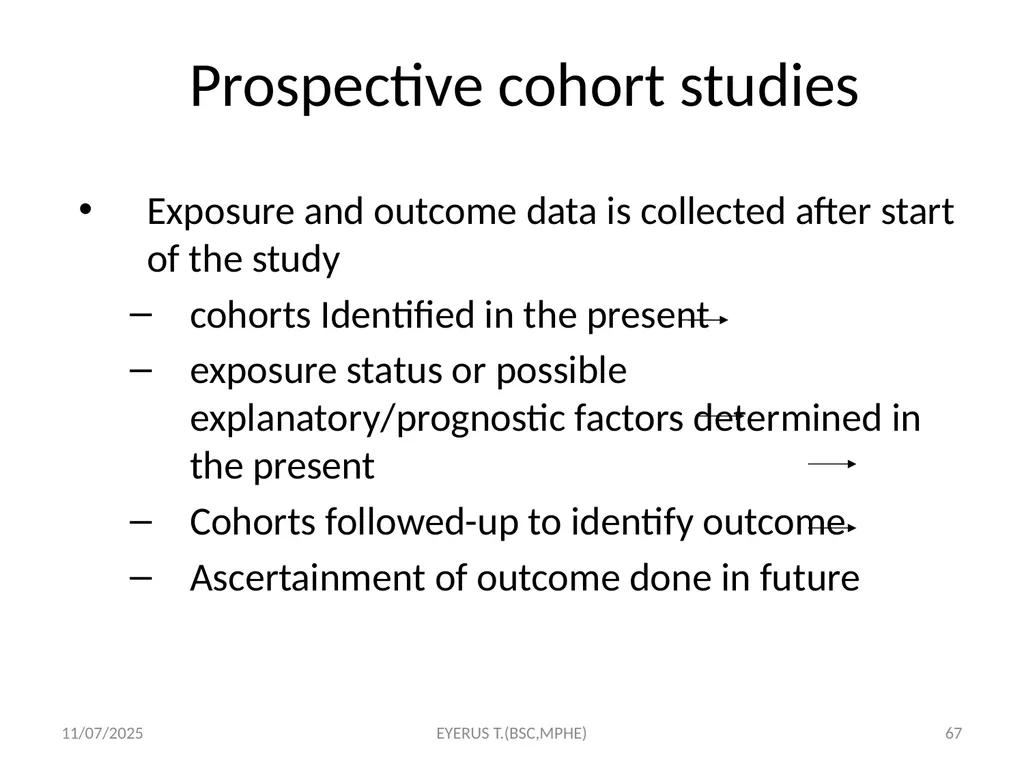
Prospective cohort studies 67 Exposure and outcome data is collected after start of the study
cohorts Identified in the present
exposure status or possible explanatory/prognostic factors determined in the present
Cohorts followed-up to identify outcome
Ascertainment of outcome done in future 5/17/2020 EYERUS T.(BSC,MPHE)<br>
cohorts Identified in the present
exposure status or possible explanatory/prognostic factors determined in the present
Cohorts followed-up to identify outcome
Ascertainment of outcome done in future 5/17/2020 EYERUS T.(BSC,MPHE)<br>
68
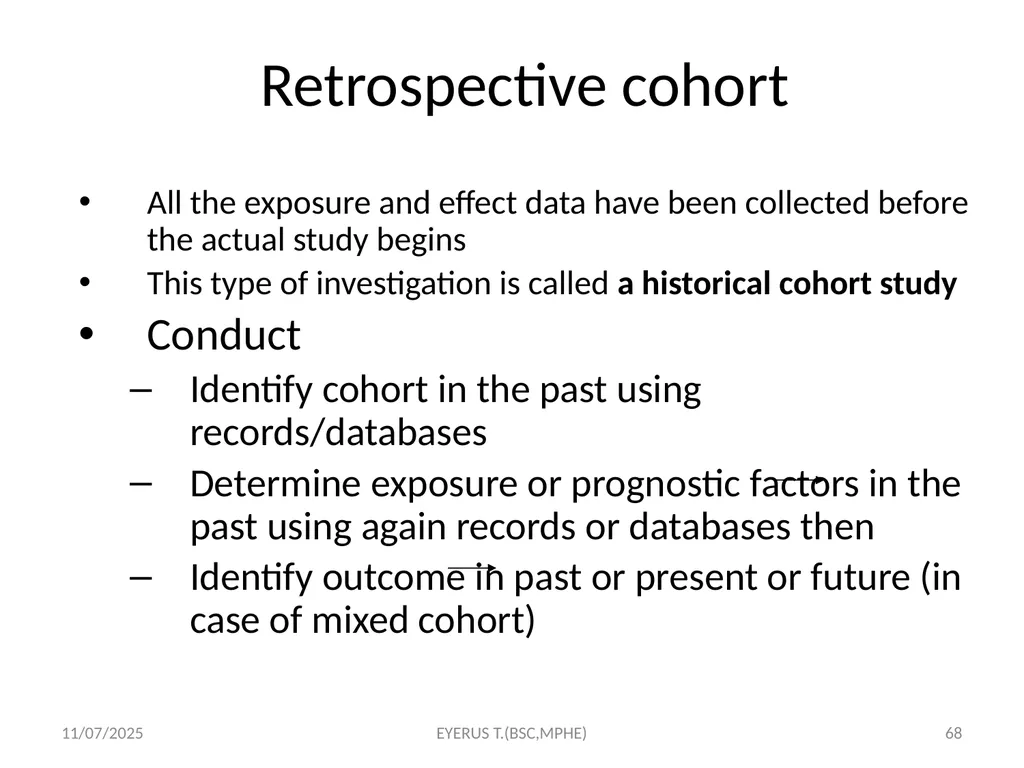
Retrospective cohort 68 All the exposure and effect data have been collected before the actual study begins
This type of investigation is called a historical cohort study
Conduct
Identify cohort in the past using records/databases
Determine exposure or prognostic factors in the past using again records or databases then
Identify outcome in past or present or future (in case of mixed cohort) 5/17/2020 EYERUS T.(BSC,MPHE)<br>
This type of investigation is called a historical cohort study
Conduct
Identify cohort in the past using records/databases
Determine exposure or prognostic factors in the past using again records or databases then
Identify outcome in past or present or future (in case of mixed cohort) 5/17/2020 EYERUS T.(BSC,MPHE)<br>
69
Retrospective cohort... 69 Costs can occasionally be reduced by using a historical cohort (identified on the basis of records of previous exposure)
This sort of design is relatively common for studies of cancer related to occupational exposures
For example, records of military personnel exposure to radioactive fall-out at nuclear bomb testing sites have been used to examine the possible causal role of fall-out in the development of cancer over the past 30 years 5/17/2020 EYERUS T.(BSC,MPHE)<br>
This sort of design is relatively common for studies of cancer related to occupational exposures
For example, records of military personnel exposure to radioactive fall-out at nuclear bomb testing sites have been used to examine the possible causal role of fall-out in the development of cancer over the past 30 years 5/17/2020 EYERUS T.(BSC,MPHE)<br>
70
Retrospective vs. Prospective 70 Can be conducted more quickly and cheaply
All relevant events have occurred
Efficient for disease with long latency periods
Depend on availability of routine data
Incompleteness
Lack of data on confounding variables 5/17/2020 EYERUS T.(BSC,MPHE)<br>
All relevant events have occurred
Efficient for disease with long latency periods
Depend on availability of routine data
Incompleteness
Lack of data on confounding variables 5/17/2020 EYERUS T.(BSC,MPHE)<br>
71
Design and data collection 71 1. Define and identify cohorts
1.1. Identify population at risk
Selection of Exposed Population
Depends on research question
Outcome must not be rare in exposed
Accessible and compliant subjects
E.g., Nurse’s Health Study, Physicians
Selection of Non-exposed Group
Similar to exposed
Control for confounding factors 5/17/2020 EYERUS T.(BSC,MPHE)<br>
1.1. Identify population at risk
Selection of Exposed Population
Depends on research question
Outcome must not be rare in exposed
Accessible and compliant subjects
E.g., Nurse’s Health Study, Physicians
Selection of Non-exposed Group
Similar to exposed
Control for confounding factors 5/17/2020 EYERUS T.(BSC,MPHE)<br>
72
Design and data collection... 72 1.2. Screen identified subjects for the disease and omit the prevalent cases
2. Define, assess, identify and classify exposure
3. Follow-up and ascertain outcome
Timing of outcome events-case definition 5/17/2020 EYERUS T.(BSC,MPHE)<br>
2. Define, assess, identify and classify exposure
3. Follow-up and ascertain outcome
Timing of outcome events-case definition 5/17/2020 EYERUS T.(BSC,MPHE)<br>
73
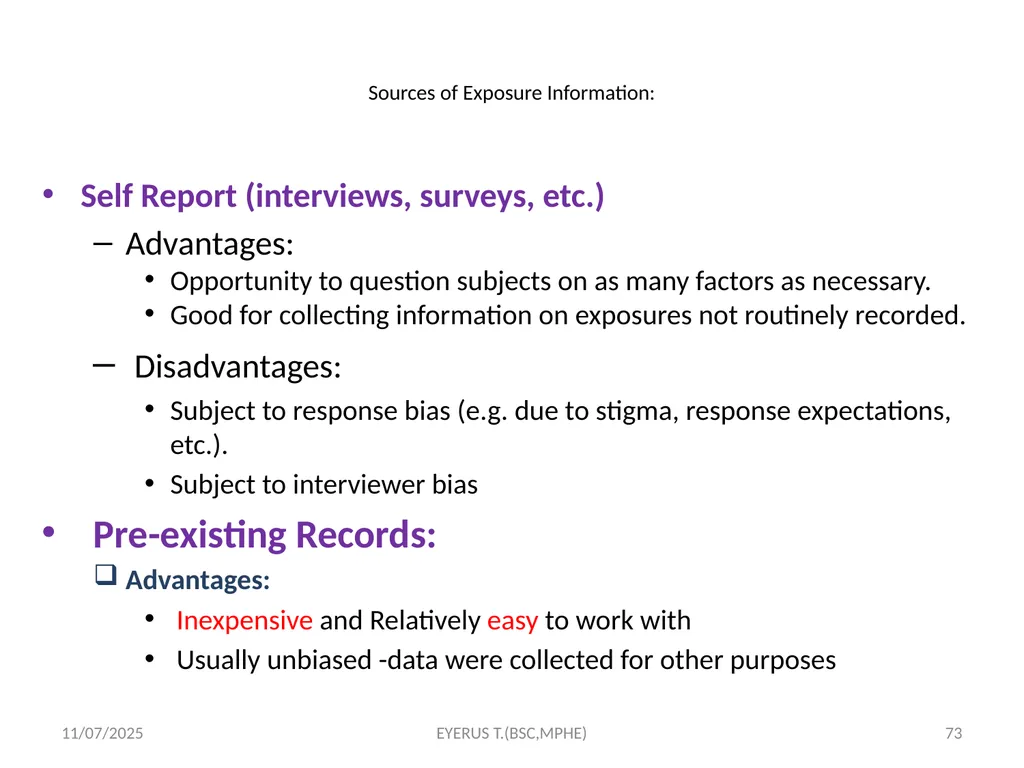
Sources of Exposure Information: Self Report (interviews, surveys, etc.)
Advantages:
Opportunity to question subjects on as many factors as necessary.
Good for collecting information on exposures not routinely recorded.
Disadvantages:
Subject to response bias (e.g. due to stigma, response expectations, etc.).
Subject to interviewer bias
Pre-existing Records:
Advantages:
Inexpensive and Relatively easy to work with
Usually unbiased -data were collected for other purposes 5/17/2020 73 EYERUS T.(BSC,MPHE)<br>
Advantages:
Opportunity to question subjects on as many factors as necessary.
Good for collecting information on exposures not routinely recorded.
Disadvantages:
Subject to response bias (e.g. due to stigma, response expectations, etc.).
Subject to interviewer bias
Pre-existing Records:
Advantages:
Inexpensive and Relatively easy to work with
Usually unbiased -data were collected for other purposes 5/17/2020 73 EYERUS T.(BSC,MPHE)<br>
74
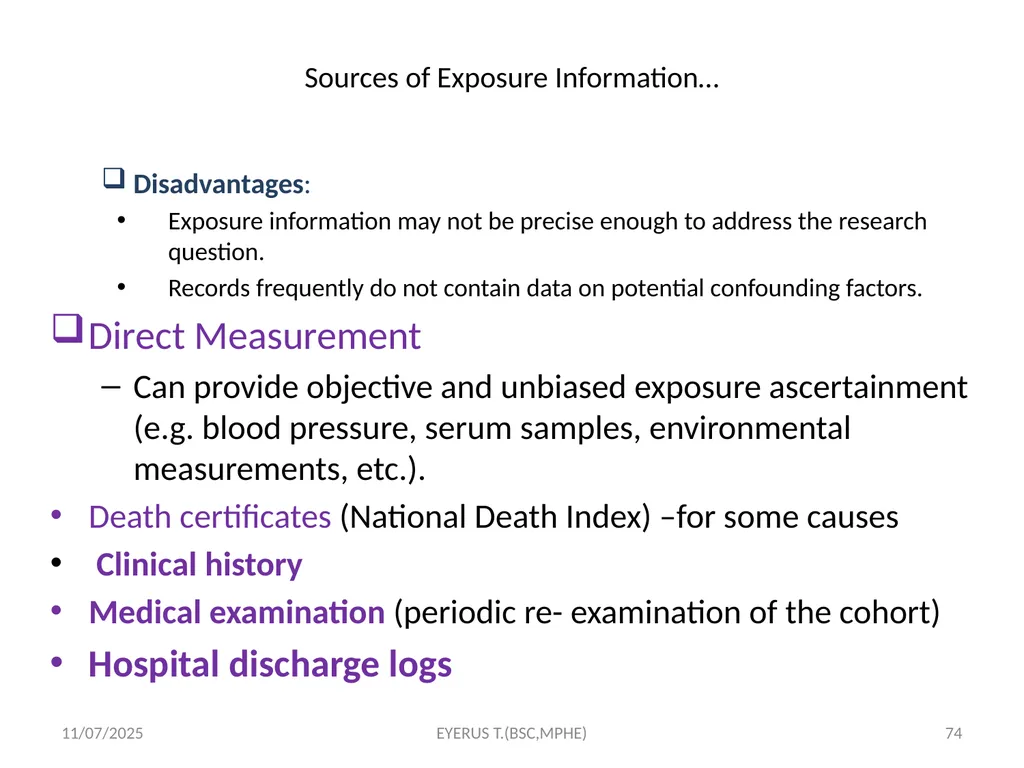
Sources of Exposure Information… Disadvantages:
Exposure information may not be precise enough to address the research question.
Records frequently do not contain data on potential confounding factors.
Direct Measurement
Can provide objective and unbiased exposure ascertainment (e.g. blood pressure, serum samples, environmental measurements, etc.).
Death certificates (National Death Index) –for some causes
Clinical history
Medical examination (periodic re- examination of the cohort)
Hospital discharge logs 5/17/2020 74 EYERUS T.(BSC,MPHE)<br>
Exposure information may not be precise enough to address the research question.
Records frequently do not contain data on potential confounding factors.
Direct Measurement
Can provide objective and unbiased exposure ascertainment (e.g. blood pressure, serum samples, environmental measurements, etc.).
Death certificates (National Death Index) –for some causes
Clinical history
Medical examination (periodic re- examination of the cohort)
Hospital discharge logs 5/17/2020 74 EYERUS T.(BSC,MPHE)<br>
75
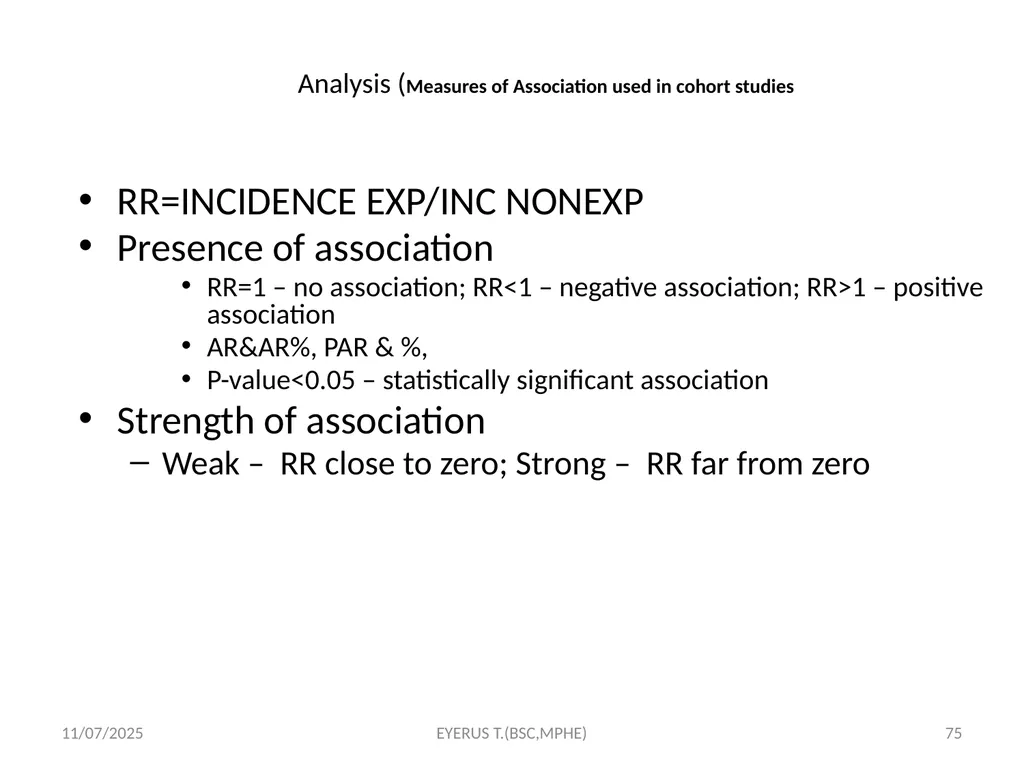
Analysis (Measures of Association used in cohort studies 75 RR=INCIDENCE EXP/INC NONEXP
Presence of association
RR=1 – no association; RR<1 – negative association; RR>1 – positive association
AR&AR%, PAR & %,
P-value<0.05 – statistically significant association
Strength of association
Weak – RR close to zero; Strong – RR far from zero 5/17/2020 EYERUS T.(BSC,MPHE)<br>
Presence of association
RR=1 – no association; RR<1 – negative association; RR>1 – positive association
AR&AR%, PAR & %,
P-value<0.05 – statistically significant association
Strength of association
Weak – RR close to zero; Strong – RR far from zero 5/17/2020 EYERUS T.(BSC,MPHE)<br>
76
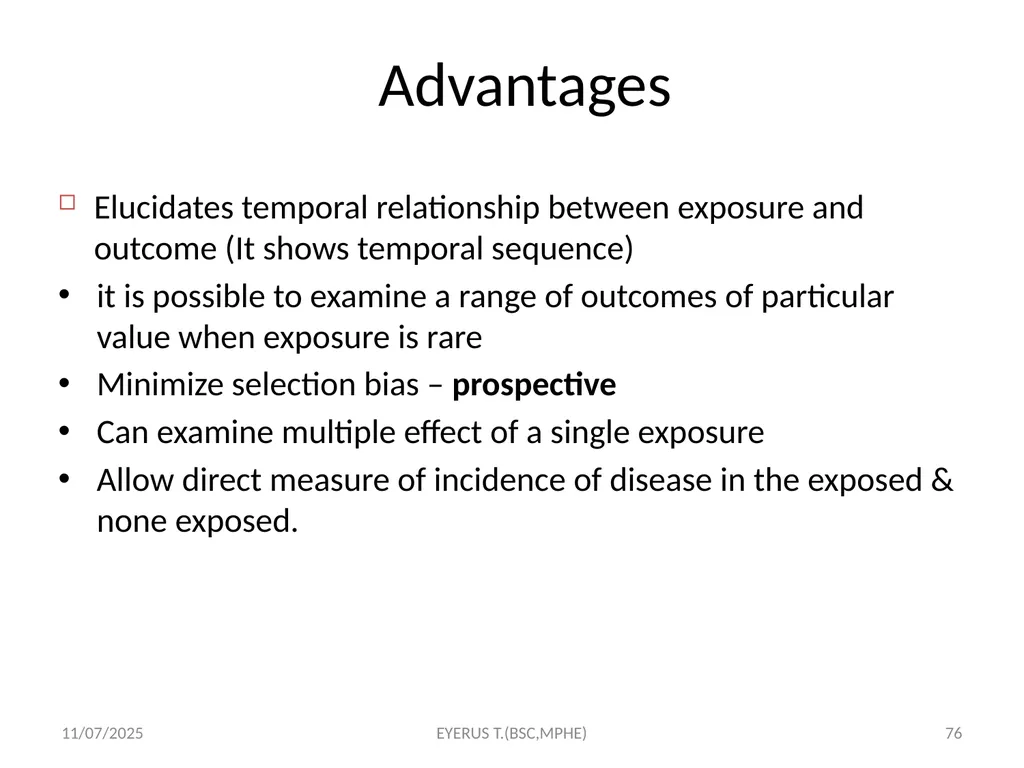
Advantages 76 Elucidates temporal relationship between exposure and outcome (It shows temporal sequence)
it is possible to examine a range of outcomes of particular value when exposure is rare
Minimize selection bias – prospective
Can examine multiple effect of a single exposure
Allow direct measure of incidence of disease in the exposed & none exposed. 5/17/2020 EYERUS T.(BSC,MPHE)<br>
it is possible to examine a range of outcomes of particular value when exposure is rare
Minimize selection bias – prospective
Can examine multiple effect of a single exposure
Allow direct measure of incidence of disease in the exposed & none exposed. 5/17/2020 EYERUS T.(BSC,MPHE)<br>
77
Disadvantages 77 Time-consuming - prospective
Require long periods of follow-up since disease may occur a long time after exposure
Many exposures investigated are long-term in nature and accurate information about them requires data collection over long periods
Expensive - prospective
Often involve following large number of individuals for many years
Incompleteness of records – retrospective
Require the availability of adequate records
Loss-to-follow-up – bias
Validity of results - seriously affected by losses to follow up
Inefficient for rare disease 5/17/2020 EYERUS T.(BSC,MPHE)<br>
Require long periods of follow-up since disease may occur a long time after exposure
Many exposures investigated are long-term in nature and accurate information about them requires data collection over long periods
Expensive - prospective
Often involve following large number of individuals for many years
Incompleteness of records – retrospective
Require the availability of adequate records
Loss-to-follow-up – bias
Validity of results - seriously affected by losses to follow up
Inefficient for rare disease 5/17/2020 EYERUS T.(BSC,MPHE)<br>
78
3. Experimental studies Individuals are allocated in to treatment and control groups by the investigator
If properly done, experimental studies can produce high quality data
They are the gold standard study design 5/17/2020 EYERUS T.(BSC,MPHE) 78<br>
If properly done, experimental studies can produce high quality data
They are the gold standard study design 5/17/2020 EYERUS T.(BSC,MPHE) 78<br>
79
Experimental… Experimental studies can be
Therapeutic trials
Conducted on patients
To determine the effect of treatment on disease
2. Preventive trials
Conducted on healthy people
To determine the effect of prevention on risk 5/17/2020 EYERUS T.(BSC,MPHE) 79<br>
Therapeutic trials
Conducted on patients
To determine the effect of treatment on disease
2. Preventive trials
Conducted on healthy people
To determine the effect of prevention on risk 5/17/2020 EYERUS T.(BSC,MPHE) 79<br>
80
Classification of experimental studies Based on the study subjects
Clinical trial-usually performed in the clinical settings and the study subjects are patients.
Field trial-used in testing medicines for preventive purpose and the study subjects are healthy people.
Community trial- a field trial in which the unit of the study is group of people/community. 5/17/2020 EYERUS T.(BSC,MPHE) 80<br>
Clinical trial-usually performed in the clinical settings and the study subjects are patients.
Field trial-used in testing medicines for preventive purpose and the study subjects are healthy people.
Community trial- a field trial in which the unit of the study is group of people/community. 5/17/2020 EYERUS T.(BSC,MPHE) 80<br>
81
Experimental… Based on the study design
Uncontrolled trial - no control group. Control will be past experience (history).
Non-randomized controlled trial - there is control group but allocation into either group is not randomized.
Randomized controlled trial - there is control group and allocation into either group is randomized. 5/17/2020 EYERUS T.(BSC,MPHE) 81<br>
Uncontrolled trial - no control group. Control will be past experience (history).
Non-randomized controlled trial - there is control group but allocation into either group is not randomized.
Randomized controlled trial - there is control group and allocation into either group is randomized. 5/17/2020 EYERUS T.(BSC,MPHE) 81<br>
82
Experimental… Based on Trial Objective
Phase I – clinical pharmacologic study - trial on small subjects to test a new drug with small dosage to determine the toxic effect, safe dose range. Scale: 20-80 healthy individuals.
( Treatment Mechanism & Dose Finding study)
Phase II–Safety and efficacy studies- trial on small group to determine the therapeutic effect. Scale: 100-200 patients. 5/17/2020 EYERUS T.(BSC,MPHE) 82<br>
Phase I – clinical pharmacologic study - trial on small subjects to test a new drug with small dosage to determine the toxic effect, safe dose range. Scale: 20-80 healthy individuals.
( Treatment Mechanism & Dose Finding study)
Phase II–Safety and efficacy studies- trial on small group to determine the therapeutic effect. Scale: 100-200 patients. 5/17/2020 EYERUS T.(BSC,MPHE) 82<br>
83
Experimental… 3. Based on Trial Objective
Phase III - study on large population to test effectiveness. Randomized Controlled Trial (RCT), often it is multi-centered and needs licensing.
Phase IV – Post marketing surveillance – Long term prospective assessment of effects & side- effects. 5/17/2020 EYERUS T.(BSC,MPHE) 83<br>
Phase III - study on large population to test effectiveness. Randomized Controlled Trial (RCT), often it is multi-centered and needs licensing.
Phase IV – Post marketing surveillance – Long term prospective assessment of effects & side- effects. 5/17/2020 EYERUS T.(BSC,MPHE) 83<br>
84
Purpose of experimental studies When to choose an experimental design? Experimental studies are generally reserved for relatively "mature" research questions.
A lot of ground work has to be done before embarking on a clinical trial. 5/17/2020 EYERUS T.(BSC,MPHE) 84<br>
A lot of ground work has to be done before embarking on a clinical trial. 5/17/2020 EYERUS T.(BSC,MPHE) 84<br>
85
Purpose.. Experimental designs are chosen when one or more of the following conditions are fulfilled.
The research question cannot be answered by observational studies
Earlier observational studies have not answered the research question
Existing knowledge is not sufficient to determine clinical or public health policy
An experiment is likely to provide an important extension of this knowledge. 5/17/2020 EYERUS T.(BSC,MPHE) 85<br>
The research question cannot be answered by observational studies
Earlier observational studies have not answered the research question
Existing knowledge is not sufficient to determine clinical or public health policy
An experiment is likely to provide an important extension of this knowledge. 5/17/2020 EYERUS T.(BSC,MPHE) 85<br>
86
Experimental.. Interventions that can be evaluated are:-
New drugs and new treatment of diseases,
New medical and health care technology,
New methods of primary prevention,
New programs for screening,
New ways of organizing & delivering health services,
New community health programs and
New behavioral intervention programs. 5/17/2020 EYERUS T.(BSC,MPHE) 86<br>
New drugs and new treatment of diseases,
New medical and health care technology,
New methods of primary prevention,
New programs for screening,
New ways of organizing & delivering health services,
New community health programs and
New behavioral intervention programs. 5/17/2020 EYERUS T.(BSC,MPHE) 86<br>
87
Experimental… Generally, a good experimental design serves three purposes.
Causation: It allows the experimenter to make causal inferences about the relationship between independent variables and a dependent variable.
Control: It allows the experimenter to rule out alternative explanations due to the confounding effects of extraneous variables (i.e., variables other than the independent variables).
Variability: It reduces variability within treatment conditions, which makes it easier to detect differences in treatment outcomes. 5/17/2020 EYERUS T.(BSC,MPHE) 87<br>
Causation: It allows the experimenter to make causal inferences about the relationship between independent variables and a dependent variable.
Control: It allows the experimenter to rule out alternative explanations due to the confounding effects of extraneous variables (i.e., variables other than the independent variables).
Variability: It reduces variability within treatment conditions, which makes it easier to detect differences in treatment outcomes. 5/17/2020 EYERUS T.(BSC,MPHE) 87<br>
88
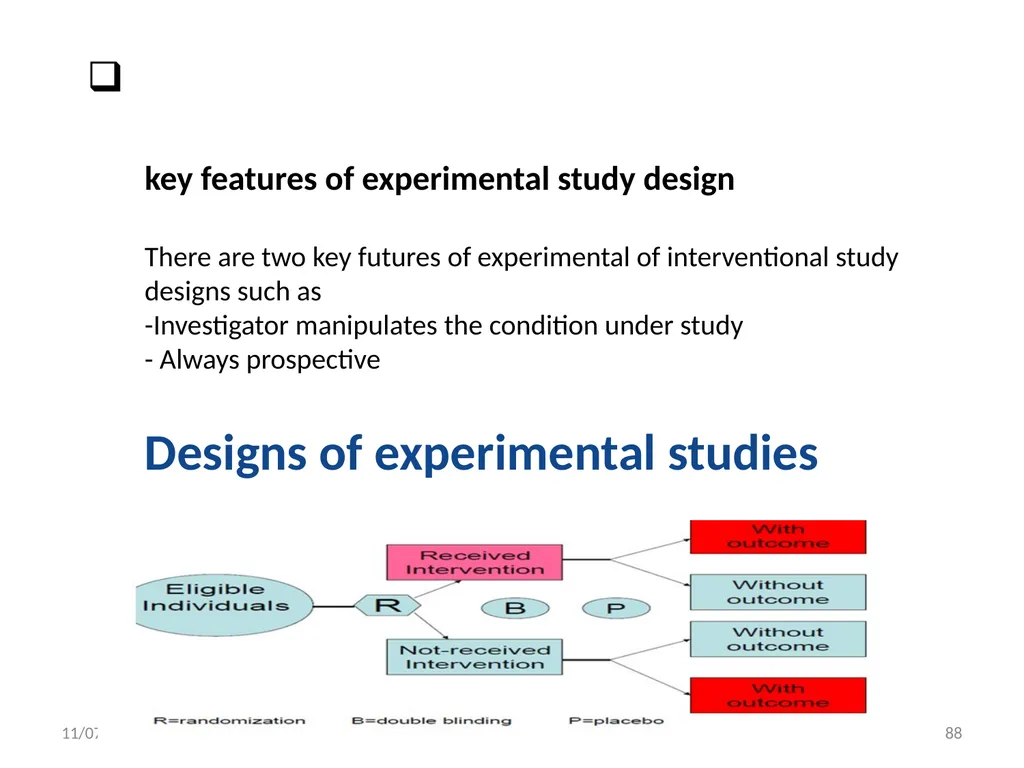
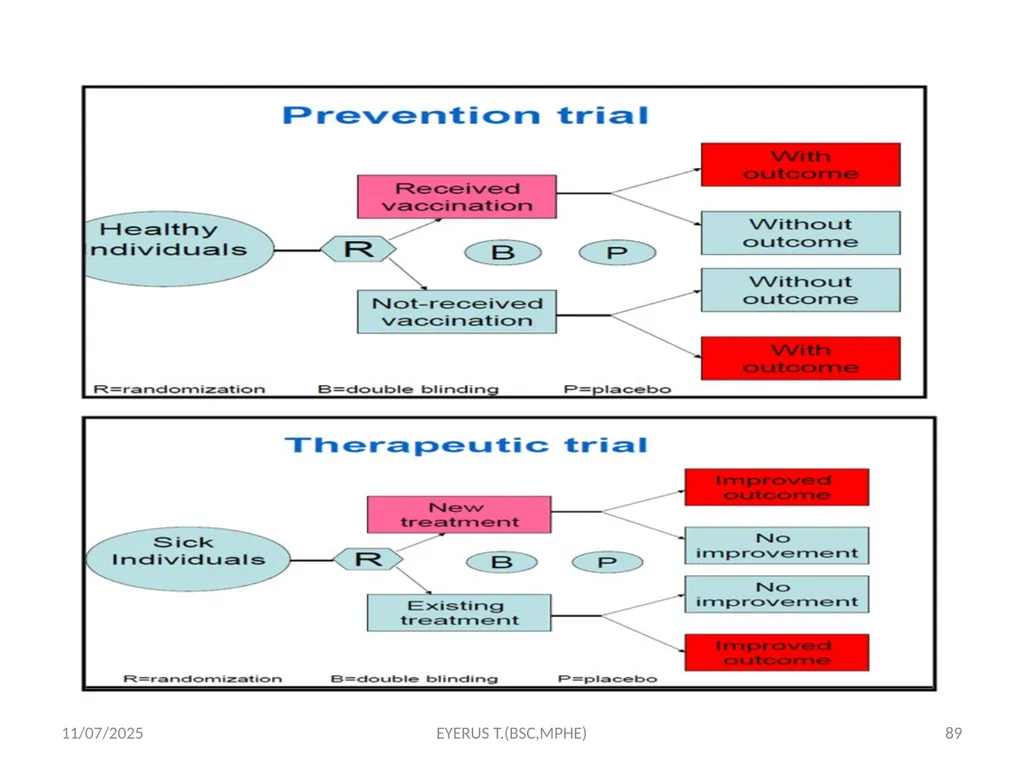
key features of experimental study design
There are two key futures of experimental of interventional study designs such as
-Investigator manipulates the condition under study
- Always prospective
Designs of experimental studies 5/17/2020 EYERUS T.(BSC,MPHE) 88<br>
89
5/17/2020 EYERUS T.(BSC,MPHE) 89<br>
90
Experimental.. Challenges in intervention studies
Ethical issues
Harmful treatment shouldn’t be given
Useful treatment shouldn’t be denied
Feasibility issues
Getting adequate subjects
Achieving satisfactory compliance
Cost issues
Experimental studies are expensive 5/17/2020 EYERUS T.(BSC,MPHE) 90<br>
Ethical issues
Harmful treatment shouldn’t be given
Useful treatment shouldn’t be denied
Feasibility issues
Getting adequate subjects
Achieving satisfactory compliance
Cost issues
Experimental studies are expensive 5/17/2020 EYERUS T.(BSC,MPHE) 90<br>
91
Experimental… The quality of “Gold standard” in experimental studies can be achieved through
Randomization
Blinding
Placebo
Randomization: random allocation of study subjects in to treatment & control groups
Advantage: Avoids bias & confounding
Increases confidence on results
Blinding: Denying information on treatment/ control 5/17/2020 EYERUS T.(BSC,MPHE) 91<br>
Randomization
Blinding
Placebo
Randomization: random allocation of study subjects in to treatment & control groups
Advantage: Avoids bias & confounding
Increases confidence on results
Blinding: Denying information on treatment/ control 5/17/2020 EYERUS T.(BSC,MPHE) 91<br>
92
Experimental… Single blinding: study subjects don’t know to which group they belong
Double blinding: Care givers also don’t know to which group study subjects belong
Triple blinding: data collectors also don’t know allocation status
Advantage: Avoids observation bias 5/17/2020 EYERUS T.(BSC,MPHE) 92<br>
Double blinding: Care givers also don’t know to which group study subjects belong
Triple blinding: data collectors also don’t know allocation status
Advantage: Avoids observation bias 5/17/2020 EYERUS T.(BSC,MPHE) 92<br>
93
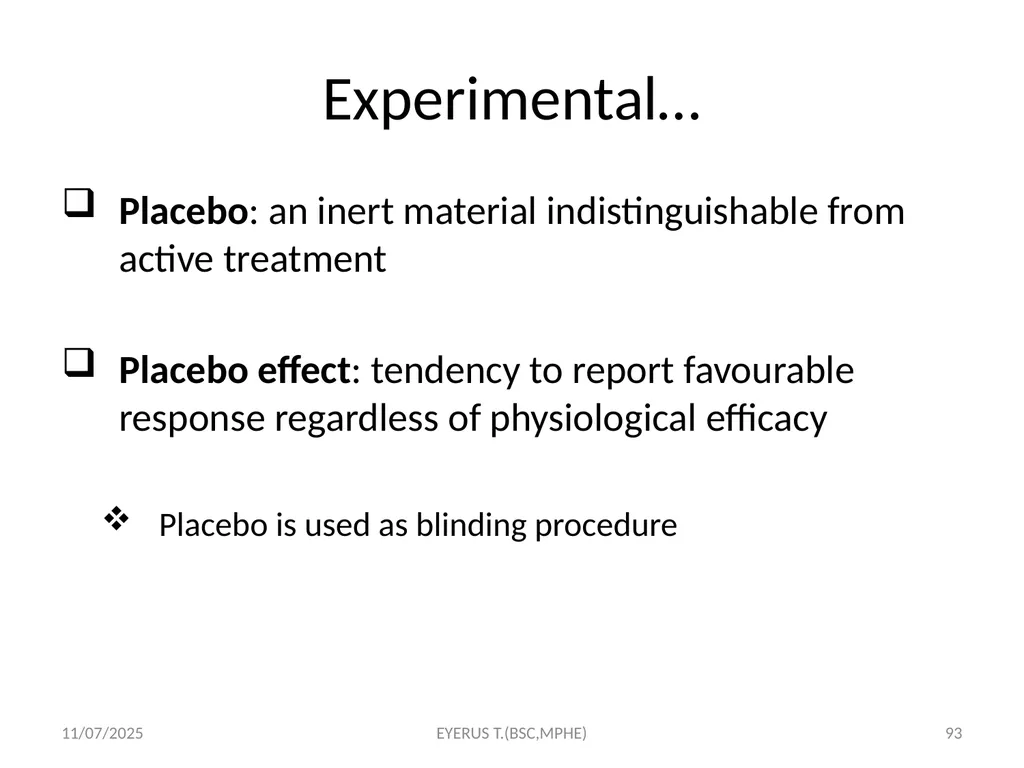
Experimental… Placebo: an inert material indistinguishable from active treatment
Placebo effect: tendency to report favourable response regardless of physiological efficacy
Placebo is used as blinding procedure 5/17/2020 EYERUS T.(BSC,MPHE) 93<br>
Placebo effect: tendency to report favourable response regardless of physiological efficacy
Placebo is used as blinding procedure 5/17/2020 EYERUS T.(BSC,MPHE) 93<br>
94
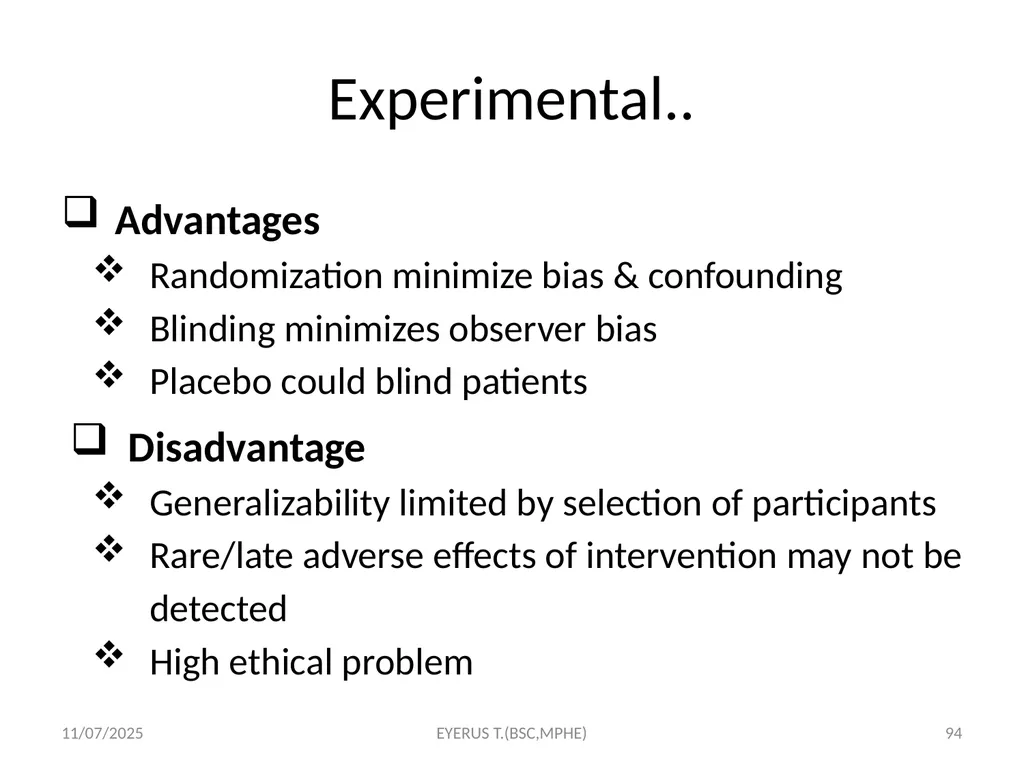
Experimental.. Advantages
Randomization minimize bias & confounding
Blinding minimizes observer bias
Placebo could blind patients
Disadvantage
Generalizability limited by selection of participants
Rare/late adverse effects of intervention may not be detected
High ethical problem 5/17/2020 EYERUS T.(BSC,MPHE) 94<br>
Randomization minimize bias & confounding
Blinding minimizes observer bias
Placebo could blind patients
Disadvantage
Generalizability limited by selection of participants
Rare/late adverse effects of intervention may not be detected
High ethical problem 5/17/2020 EYERUS T.(BSC,MPHE) 94<br>
95
Evaluation of evidence/judgment of causality Objectives
At the end of this chapter students will be able:
To look at validity of studies
To describe role of chance, bias and confounding factors
To evaluate the overall evidence for a cause-effect relationship 5/17/2020 95 EYERUS T.(BSC,MPHE)<br>
At the end of this chapter students will be able:
To look at validity of studies
To describe role of chance, bias and confounding factors
To evaluate the overall evidence for a cause-effect relationship 5/17/2020 95 EYERUS T.(BSC,MPHE)<br>
96
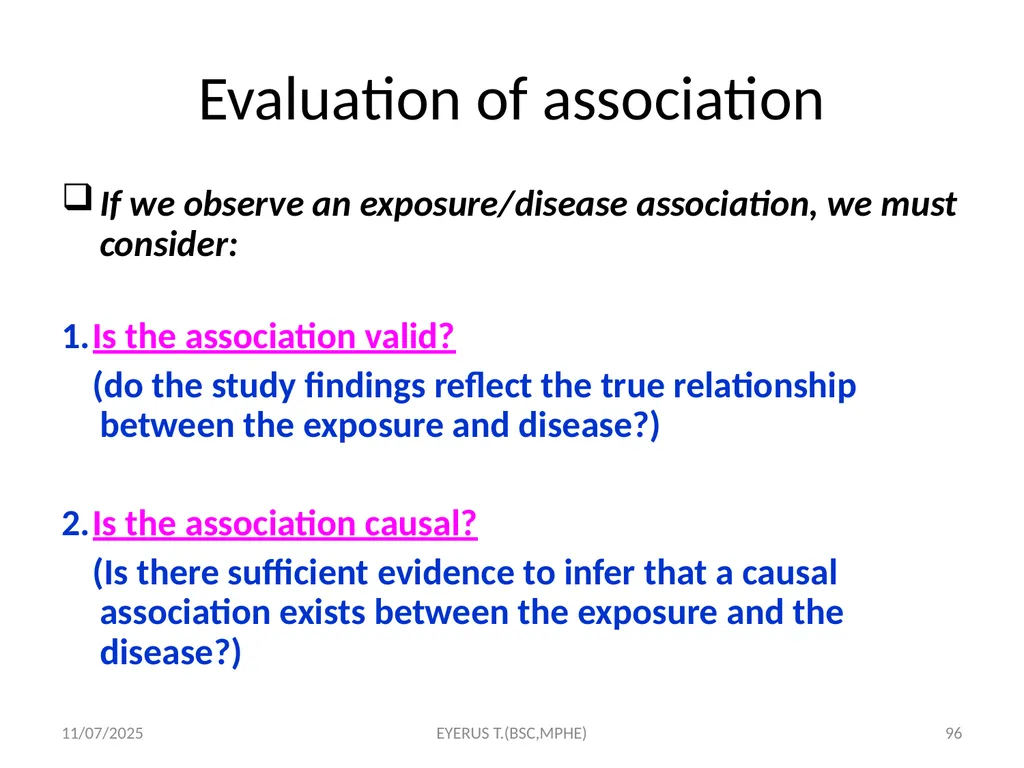
Evaluation of association If we observe an exposure/disease association, we must consider:
1. Is the association valid?
(do the study findings reflect the true relationship between the exposure and disease?)
2. Is the association causal?
(Is there sufficient evidence to infer that a causal association exists between the exposure and the disease?) 5/17/2020 96 EYERUS T.(BSC,MPHE)<br>
1. Is the association valid?
(do the study findings reflect the true relationship between the exposure and disease?)
2. Is the association causal?
(Is there sufficient evidence to infer that a causal association exists between the exposure and the disease?) 5/17/2020 96 EYERUS T.(BSC,MPHE)<br>
97
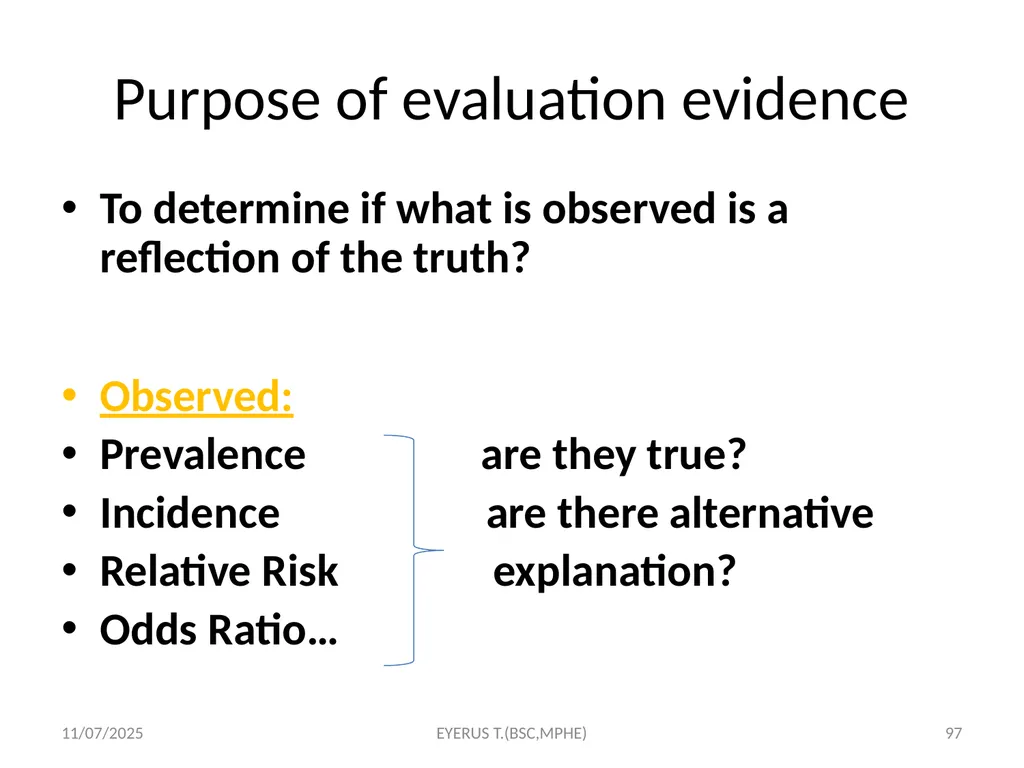
Purpose of evaluation evidence To determine if what is observed is a reflection of the truth?
Observed:
Prevalence are they true?
Incidence are there alternative
Relative Risk explanation?
Odds Ratio… 5/17/2020 97 EYERUS T.(BSC,MPHE)<br>
Observed:
Prevalence are they true?
Incidence are there alternative
Relative Risk explanation?
Odds Ratio… 5/17/2020 97 EYERUS T.(BSC,MPHE)<br>
98
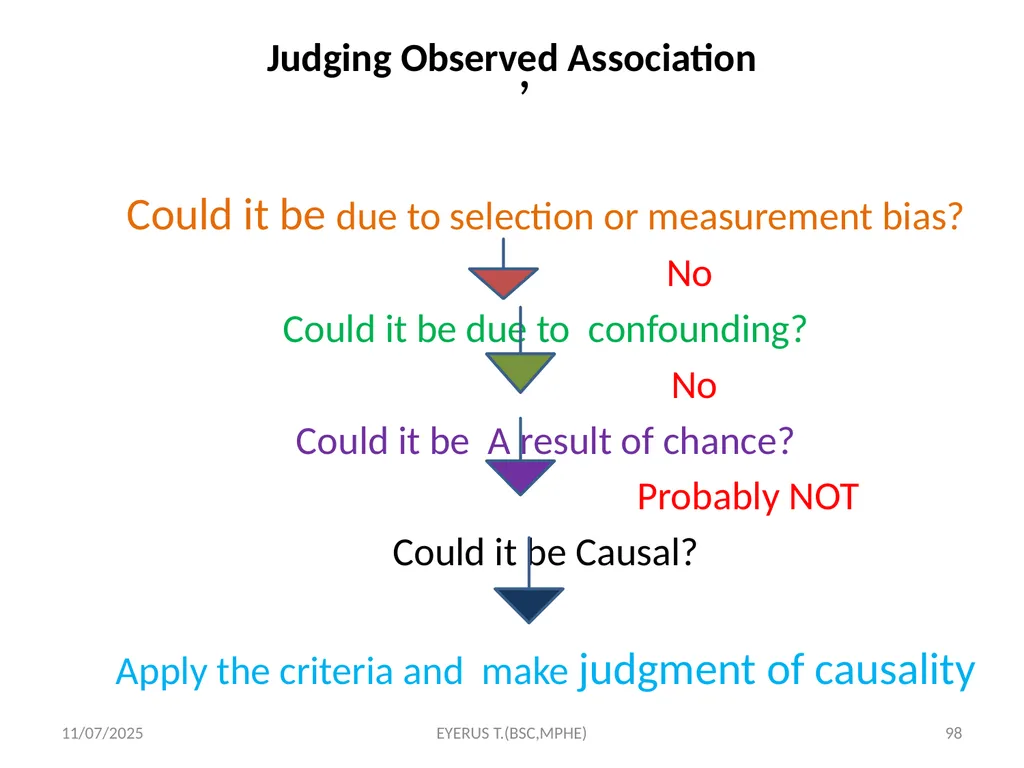
, Judging Observed Association Could it be due to selection or measurement bias?
No
Could it be due to confounding?
No
Could it be A result of chance?
Probably NOT
Could it be Causal?
Apply the criteria and make judgment of causality 98 5/17/2020 EYERUS T.(BSC,MPHE)<br>
No
Could it be due to confounding?
No
Could it be A result of chance?
Probably NOT
Could it be Causal?
Apply the criteria and make judgment of causality 98 5/17/2020 EYERUS T.(BSC,MPHE)<br>
99
Common problems in observed finding Inadequacy of the observed sample
Inappropriate selection of study subjects
Inappropriate/unfair data collection methods 5/17/2020 99 EYERUS T.(BSC,MPHE)<br>
Inappropriate selection of study subjects
Inappropriate/unfair data collection methods 5/17/2020 99 EYERUS T.(BSC,MPHE)<br>
100
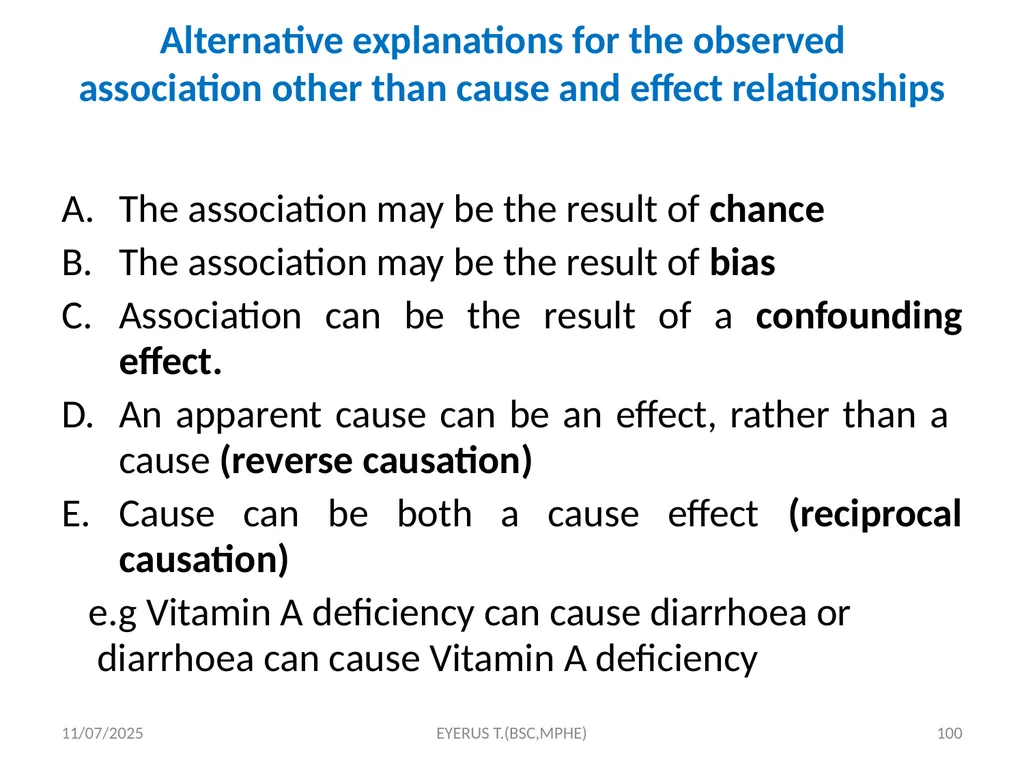
Alternative explanations for the observed
association other than cause and effect relationships The association may be the result of chance
The association may be the result of bias
Association can be the result of a confounding effect.
An apparent cause can be an effect, rather than a cause (reverse causation)
Cause can be both a cause effect (reciprocal causation)
e.g Vitamin A deficiency can cause diarrhoea or diarrhoea can cause Vitamin A deficiency 5/17/2020 100 EYERUS T.(BSC,MPHE)<br>
The association may be the result of bias
Association can be the result of a confounding effect.
An apparent cause can be an effect, rather than a cause (reverse causation)
Cause can be both a cause effect (reciprocal causation)
e.g Vitamin A deficiency can cause diarrhoea or diarrhoea can cause Vitamin A deficiency 5/17/2020 100 EYERUS T.(BSC,MPHE)<br>
101
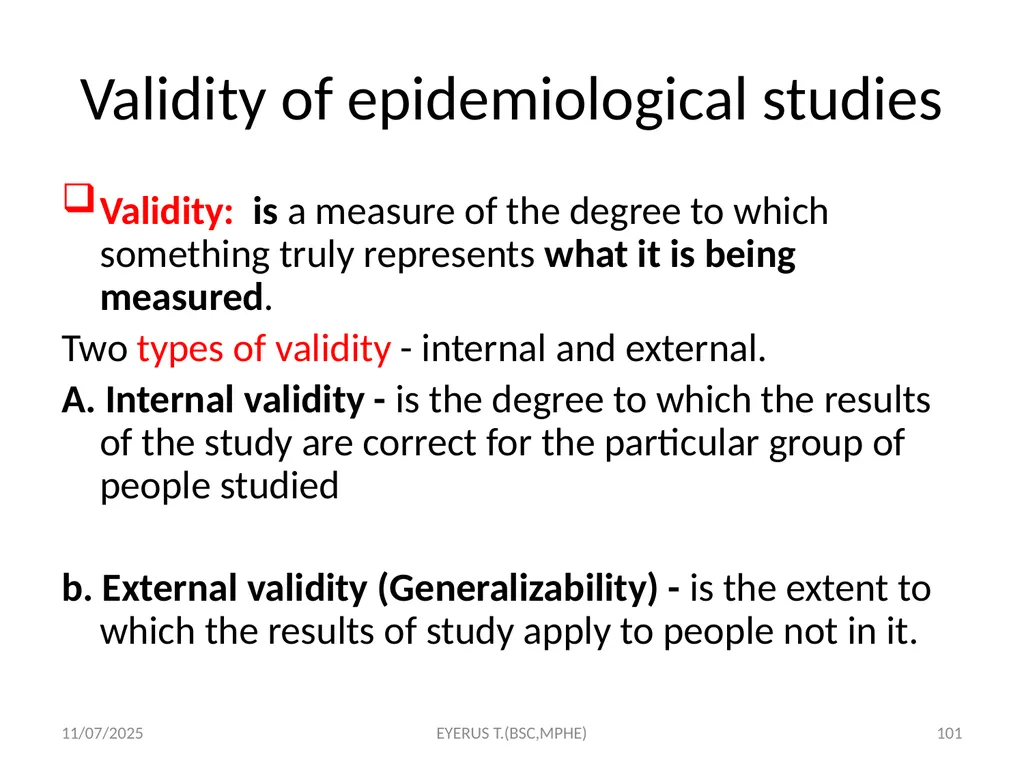
Validity of epidemiological studies Validity: is a measure of the degree to which something truly represents what it is being measured.
Two types of validity - internal and external.
A. Internal validity - is the degree to which the results of the study are correct for the particular group of people studied
b. External validity (Generalizability) - is the extent to which the results of study apply to people not in it. 5/17/2020 101 EYERUS T.(BSC,MPHE)<br>
Two types of validity - internal and external.
A. Internal validity - is the degree to which the results of the study are correct for the particular group of people studied
b. External validity (Generalizability) - is the extent to which the results of study apply to people not in it. 5/17/2020 101 EYERUS T.(BSC,MPHE)<br>
102
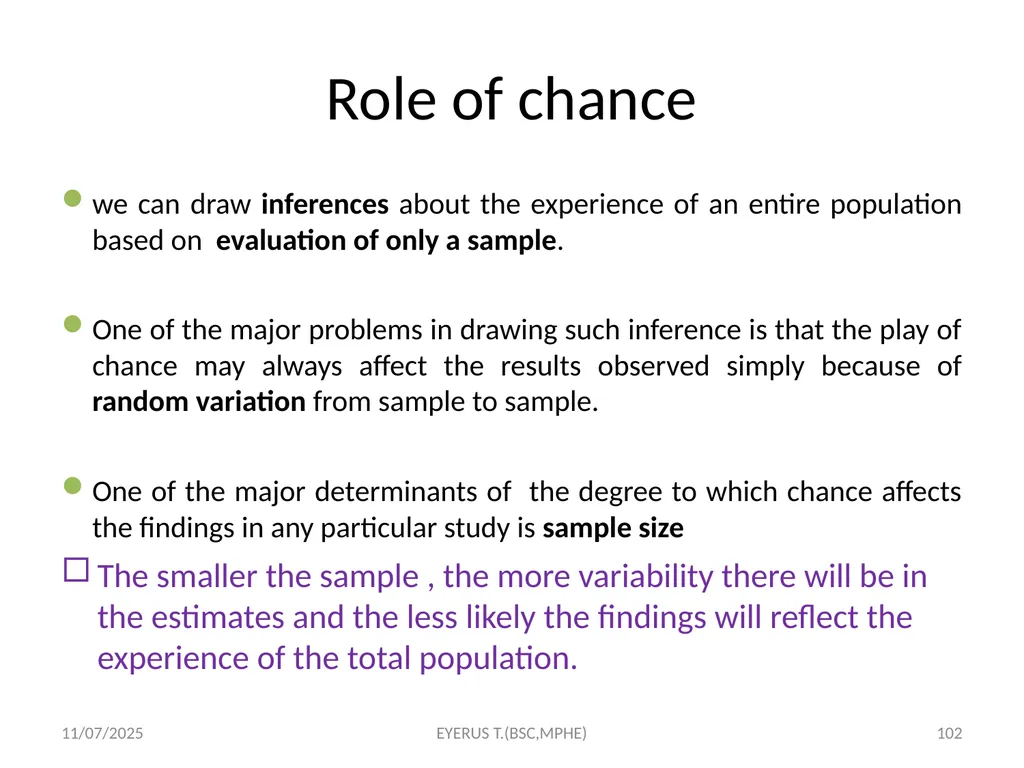
Role of chance we can draw inferences about the experience of an entire population based on evaluation of only a sample.
One of the major problems in drawing such inference is that the play of chance may always affect the results observed simply because of random variation from sample to sample.
One of the major determinants of the degree to which chance affects the findings in any particular study is sample size
The smaller the sample , the more variability there will be in the estimates and the less likely the findings will reflect the experience of the total population. 5/17/2020 102 EYERUS T.(BSC,MPHE)<br>
One of the major problems in drawing such inference is that the play of chance may always affect the results observed simply because of random variation from sample to sample.
One of the major determinants of the degree to which chance affects the findings in any particular study is sample size
The smaller the sample , the more variability there will be in the estimates and the less likely the findings will reflect the experience of the total population. 5/17/2020 102 EYERUS T.(BSC,MPHE)<br>
103
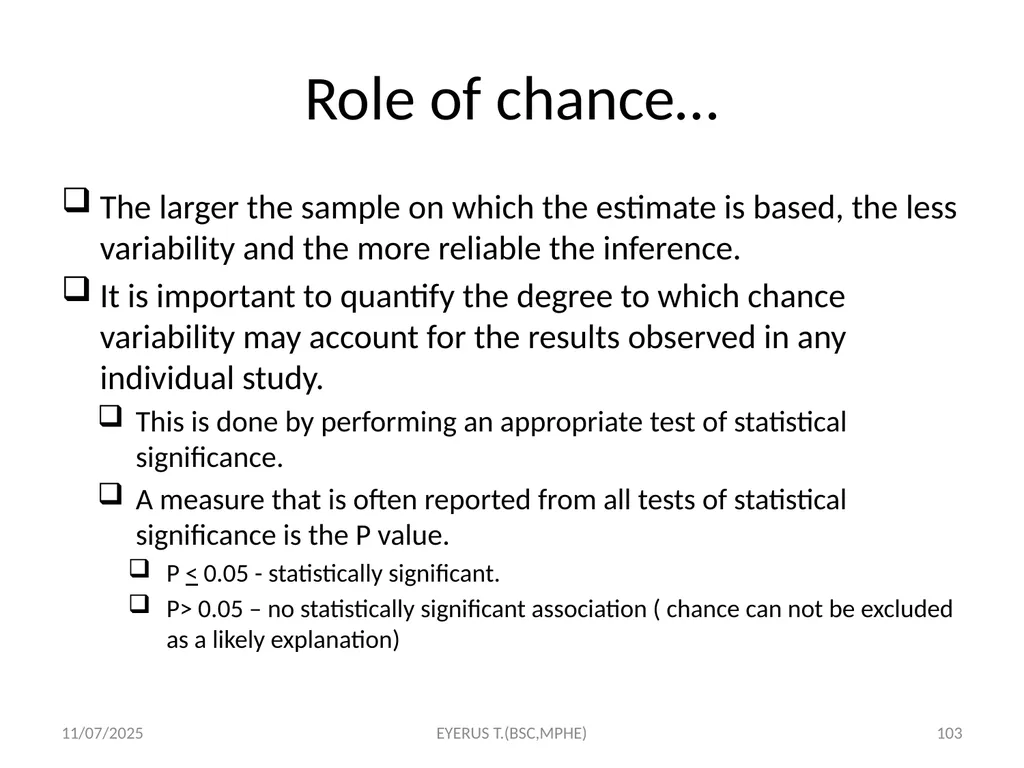
Role of chance… The larger the sample on which the estimate is based, the less variability and the more reliable the inference.
It is important to quantify the degree to which chance variability may account for the results observed in any individual study.
This is done by performing an appropriate test of statistical significance.
A measure that is often reported from all tests of statistical significance is the P value.
P < 0.05 - statistically significant.
P> 0.05 – no statistically significant association ( chance can not be excluded as a likely explanation) 5/17/2020 103 EYERUS T.(BSC,MPHE)<br>
It is important to quantify the degree to which chance variability may account for the results observed in any individual study.
This is done by performing an appropriate test of statistical significance.
A measure that is often reported from all tests of statistical significance is the P value.
P < 0.05 - statistically significant.
P> 0.05 – no statistically significant association ( chance can not be excluded as a likely explanation) 5/17/2020 103 EYERUS T.(BSC,MPHE)<br>
104
Hypothesis testing (test of statistical significance) Make explicit statement of hypothesis
Null Hypothesis
H0: P1 = P2 (p= proportion developed outcome of interest)
H0: RR = 1
Alternate Hypothesis
H1: P1 P2
H1: RR 1 5/17/2020 104 EYERUS T.(BSC,MPHE)<br>
Null Hypothesis
H0: P1 = P2 (p= proportion developed outcome of interest)
H0: RR = 1
Alternate Hypothesis
H1: P1 P2
H1: RR 1 5/17/2020 104 EYERUS T.(BSC,MPHE)<br>
105
Hypothesis testing Perform Test of Significance
Use appropriate test
P-value 0.05 Chance is unlikely explanation
Reject the null hypothesis
There is Statistically significant difference
It is always advisable to report the actual P value rather than merely that the results did or did not achieve statistical significance.
confidence interval (CI) is far more informative measure than P value to evaluate the role of chance 5/17/2020 105 EYERUS T.(BSC,MPHE)<br>
Use appropriate test
P-value 0.05 Chance is unlikely explanation
Reject the null hypothesis
There is Statistically significant difference
It is always advisable to report the actual P value rather than merely that the results did or did not achieve statistical significance.
confidence interval (CI) is far more informative measure than P value to evaluate the role of chance 5/17/2020 105 EYERUS T.(BSC,MPHE)<br>
106
Confidence interval Provide information that p-value gives.
If null value is included in a 95% CI, by definition the corresponding P-value is >0.05.
Indicate the amount of variability (effect of sample size) by the width of the CI
This information can not be obtained from p-value. 5/17/2020 106 EYERUS T.(BSC,MPHE)<br>
If null value is included in a 95% CI, by definition the corresponding P-value is >0.05.
Indicate the amount of variability (effect of sample size) by the width of the CI
This information can not be obtained from p-value. 5/17/2020 106 EYERUS T.(BSC,MPHE)<br>
107
Interpretation of CI Wide CI
indicate greater variability
suggest inadequacy of the sample size
Particularly important in interpreting non-significant results
Narrow CI suggest that truly there is no association
Wide CI suggest inadequacy of sample size to have adequate statistical power 5/17/2020 107 EYERUS T.(BSC,MPHE)<br>
indicate greater variability
suggest inadequacy of the sample size
Particularly important in interpreting non-significant results
Narrow CI suggest that truly there is no association
Wide CI suggest inadequacy of sample size to have adequate statistical power 5/17/2020 107 EYERUS T.(BSC,MPHE)<br>
108
Role of bias Bias - is any systematic error in the design, conduct, or analysis of a study that results in a distorted estimate measurement
The key word in the understanding of the concept of bias is “different”.
Two main types of bias:
A. Selection bias
B. Information (Observation) bias 5/17/2020 108 EYERUS T.(BSC,MPHE)<br>
The key word in the understanding of the concept of bias is “different”.
Two main types of bias:
A. Selection bias
B. Information (Observation) bias 5/17/2020 108 EYERUS T.(BSC,MPHE)<br>
109
Selection bias (example) Invitational (who gets invited into the study?)
Acceptance (who accepted the invitation?)
Loss to follow-up
Volunteer/Compliance bias
Non-response bias
Selection bias is a particular problem in case control and retrospective cohort studies 5/17/2020 109 EYERUS T.(BSC,MPHE)<br>
Acceptance (who accepted the invitation?)
Loss to follow-up
Volunteer/Compliance bias
Non-response bias
Selection bias is a particular problem in case control and retrospective cohort studies 5/17/2020 109 EYERUS T.(BSC,MPHE)<br>
110
Selection bias 1. Diagnostic bias
Diagnostic bias occurs when a disease is more likely to be diagnosed in some one with exposure to a suspected risk factor.
For example women who take oral contraceptives (OCs) may be screened more often for breast cancer than women who do not take OCs because of the suspected link between OCs and breast cancer.
This would result in breast cancer being diagnosed more readily in those who are exposed to Ocs.
2.Self selection/ Volunteer bias/ Compliance bias
People who accept to participate in a study, or people who refuse to participate are often quite different from the general population. 5/17/2020 110 EYERUS T.(BSC,MPHE)<br>
Diagnostic bias occurs when a disease is more likely to be diagnosed in some one with exposure to a suspected risk factor.
For example women who take oral contraceptives (OCs) may be screened more often for breast cancer than women who do not take OCs because of the suspected link between OCs and breast cancer.
This would result in breast cancer being diagnosed more readily in those who are exposed to Ocs.
2.Self selection/ Volunteer bias/ Compliance bias
People who accept to participate in a study, or people who refuse to participate are often quite different from the general population. 5/17/2020 110 EYERUS T.(BSC,MPHE)<br>
111
Selection bias… 3. Non-response bias
It reduces the effective sample size, resulting in loss of precision of the survey estimates.
4. Loss to follow up
It is major source of bias in cohort &intervention studies
it is also a problem in intervention studies before outcome of interest occurs
5. Healthy worker bias
Bias in occupational health studies which tend to underestimate the risk associated with an occupation due to the fact that employed people tend to be healthier than the general population 5/17/2020 111 EYERUS T.(BSC,MPHE)<br>
It reduces the effective sample size, resulting in loss of precision of the survey estimates.
4. Loss to follow up
It is major source of bias in cohort &intervention studies
it is also a problem in intervention studies before outcome of interest occurs
5. Healthy worker bias
Bias in occupational health studies which tend to underestimate the risk associated with an occupation due to the fact that employed people tend to be healthier than the general population 5/17/2020 111 EYERUS T.(BSC,MPHE)<br>
112
Ways of minimizing selection bias Population-based studies are preferable
Avoid the inclusions as study subjects of people who have volunteered on their own
In case-control , select several different control groups.
In hospital-based case control study, controls are usually selected among patients with disease other than the disease studied.
keep losses to follow-up to an absolute minimum.
For those who are lost, an assessment of as much outcome data as possible. 5/17/2020 112 EYERUS T.(BSC,MPHE)<br>
Avoid the inclusions as study subjects of people who have volunteered on their own
In case-control , select several different control groups.
In hospital-based case control study, controls are usually selected among patients with disease other than the disease studied.
keep losses to follow-up to an absolute minimum.
For those who are lost, an assessment of as much outcome data as possible. 5/17/2020 112 EYERUS T.(BSC,MPHE)<br>
113
Ways of minimizing… will lie.
Loss to follow up
Calculate estimates of the exposure-disease association assuming the most extreme situations.
Assumptions:
all those who were lost to follow up developed the outcome of interest
none developed the outcome of interest.
The results of these calculations provide a range within which the true association 5/17/2020 113 EYERUS T.(BSC,MPHE)<br>
Loss to follow up
Calculate estimates of the exposure-disease association assuming the most extreme situations.
Assumptions:
all those who were lost to follow up developed the outcome of interest
none developed the outcome of interest.
The results of these calculations provide a range within which the true association 5/17/2020 113 EYERUS T.(BSC,MPHE)<br>
114
2. Observation bias/information bias Refers to bias which arises during the data collection process
It occurs b/c of mistakes in categorizing study subjects with respect to their exposure or disease status
1. Investigator bias/ Interviewer bias/ Observer bias
Occurs when investigators collect information differently in different comparison groups
2. Response bias/ Recall bias
Occurs as a result of difficulty to recall prior exposures 5/17/2020 114 EYERUS T.(BSC,MPHE)<br>
It occurs b/c of mistakes in categorizing study subjects with respect to their exposure or disease status
1. Investigator bias/ Interviewer bias/ Observer bias
Occurs when investigators collect information differently in different comparison groups
2. Response bias/ Recall bias
Occurs as a result of difficulty to recall prior exposures 5/17/2020 114 EYERUS T.(BSC,MPHE)<br>
115
Information bias … 3. Social desirability bias
Occurs because subjects are systematically more likely to provide a socially acceptable response.
4. Placebo effect
In experimental studies which are not placebo controlled, observed changes may be ascribed to the positive effect of the subjects belief that the intervention will be beneficial.
5. Hawthorn effect
Refers to the change in the dependent variable which may be due to the process of measurement or observation itself 5/17/2020 115 EYERUS T.(BSC,MPHE)<br>
Occurs because subjects are systematically more likely to provide a socially acceptable response.
4. Placebo effect
In experimental studies which are not placebo controlled, observed changes may be ascribed to the positive effect of the subjects belief that the intervention will be beneficial.
5. Hawthorn effect
Refers to the change in the dependent variable which may be due to the process of measurement or observation itself 5/17/2020 115 EYERUS T.(BSC,MPHE)<br>
116
Ways of minimizing information bias Blinding: Three types of blinding
Single blind
Double blind
Triple blind 5/17/2020 116 EYERUS T.(BSC,MPHE)<br>
Single blind
Double blind
Triple blind 5/17/2020 116 EYERUS T.(BSC,MPHE)<br>
117
Ways of minimizing… 2. Use of Placebo
Placebos are inert treatments intended to have no effect other than the psychological benefit of offering treatment.
Can only be used if there is no accepted treatment for the condition under study.
Use of placebo minimizes the bias in the ascertainment of both subjective disease outcomes and side effects.
It facilitates that both groups in the study gain equal attention.
Placebo effect: tendency for individuals to report favourable response to any therapy regardless of the physiologic efficacy of what they received. 5/17/2020 117 EYERUS T.(BSC,MPHE)<br>
Placebos are inert treatments intended to have no effect other than the psychological benefit of offering treatment.
Can only be used if there is no accepted treatment for the condition under study.
Use of placebo minimizes the bias in the ascertainment of both subjective disease outcomes and side effects.
It facilitates that both groups in the study gain equal attention.
Placebo effect: tendency for individuals to report favourable response to any therapy regardless of the physiologic efficacy of what they received. 5/17/2020 117 EYERUS T.(BSC,MPHE)<br>
118
Ways of minimizing… same standard procedures, instruments, questionnaires, interviewing techniques should be used for data collection in both comparison groups
3. Classification of study subjects according to their outcome & exposure status should be based on the most objective & accurate methods available
4. when exposure status is determined by interview, it should be assessed in several different ways for both groups 5/17/2020 118 EYERUS T.(BSC,MPHE)<br>
3. Classification of study subjects according to their outcome & exposure status should be based on the most objective & accurate methods available
4. when exposure status is determined by interview, it should be assessed in several different ways for both groups 5/17/2020 118 EYERUS T.(BSC,MPHE)<br>
119
Roles of confounding Confounding is distortion of the estimated effect of an exposure on an outcome, caused by the presence of an extraneous factor associated both with the exposure and the outcome,
Confounding variable, confounder is a variable that can cause or prevent the outcome of interest, is not an intermediate variable, and is associated with the factor under investigation. 5/17/2020 119 EYERUS T.(BSC,MPHE)<br>
Confounding variable, confounder is a variable that can cause or prevent the outcome of interest, is not an intermediate variable, and is associated with the factor under investigation. 5/17/2020 119 EYERUS T.(BSC,MPHE)<br>
120
, 120 CONFOUNDING E D CF Confounding IS
present E ?CF D Confounding NOT
present 5/17/2020 EYERUS T.(BSC,MPHE)<br>
present E ?CF D Confounding NOT
present 5/17/2020 EYERUS T.(BSC,MPHE)<br>
121
Role of confounding… Example of confounding effect.
An observed association between consumption of coffee and increased risk of MI could be due, at least in part, to the effect of cigarette smoking, since coffee drinking is associated with smoking and, independent of coffee consumption, smoking is a risk factor for MI. 5/17/2020 121 EYERUS T.(BSC,MPHE)<br>
An observed association between consumption of coffee and increased risk of MI could be due, at least in part, to the effect of cigarette smoking, since coffee drinking is associated with smoking and, independent of coffee consumption, smoking is a risk factor for MI. 5/17/2020 121 EYERUS T.(BSC,MPHE)<br>
122
Effect of confounding Totally or partially accounts for the apparent effect
Mask an underlying true association
Reverse the actual direction of the association
Confounding must be dealt as quantitative problem; the amount of confounding rather than mere presence or absence that is important to evaluate. 5/17/2020 122 EYERUS T.(BSC,MPHE)<br>
Mask an underlying true association
Reverse the actual direction of the association
Confounding must be dealt as quantitative problem; the amount of confounding rather than mere presence or absence that is important to evaluate. 5/17/2020 122 EYERUS T.(BSC,MPHE)<br>
123
Control for confounding variable In the design:
Randomization
Restriction
Matching (at design and analysis stage)
During analysis:
Standardization
Stratification
Multivariate analysis 5/17/2020 123 EYERUS T.(BSC,MPHE)<br>
Randomization
Restriction
Matching (at design and analysis stage)
During analysis:
Standardization
Stratification
Multivariate analysis 5/17/2020 123 EYERUS T.(BSC,MPHE)<br>
124
Epidemiological criteria (guidelines) for causality An association rarely reflects a causal relationship but it may.
Criteria for causality provide a way of reaching judgements on the likelihood of an association being causal. 5/17/2020 124 EYERUS T.(BSC,MPHE)<br>
Criteria for causality provide a way of reaching judgements on the likelihood of an association being causal. 5/17/2020 124 EYERUS T.(BSC,MPHE)<br>
125
Hill’s Criteria for Causal Relation or JUDGMENT OF CAUSALITY /Brand – hill Criteria/ 1. Strength of the association
Refers to RR: the larger the RR, the greater the likelihood that the factor is causally related to the outcome
2. Dose-response relationship
risk of disease increases with increasing exposure with the causal agent
3. Consistency of the relationship
This criterion requires that an association uncovered in one study persist on testing under other circumstances, with other study population, and with different study methods
4. Temporal relationship
exposure to the suspected factor must antedate the onset of disease 5/17/2020 125 EYERUS T.(BSC,MPHE)<br>
Refers to RR: the larger the RR, the greater the likelihood that the factor is causally related to the outcome
2. Dose-response relationship
risk of disease increases with increasing exposure with the causal agent
3. Consistency of the relationship
This criterion requires that an association uncovered in one study persist on testing under other circumstances, with other study population, and with different study methods
4. Temporal relationship
exposure to the suspected factor must antedate the onset of disease 5/17/2020 125 EYERUS T.(BSC,MPHE)<br>
126
hill`s criteria for causal relation 5. Specificity of the association
the association is more likely causal if a single exposure is linked to a single disease
6. Biological plausibility (coherence with existing information)
Additional support for the causal nature of an association exists if a causal interpretation is plausible in terms of current knowledge about the factor & dx
7. Prevention
If the exposure is a cause of the disease, then eliminating the exposure (or modifying host response to the exposure, for example through immunization ) should be followed by a decrease in the incidence rate of the disease 5/17/2020 126 EYERUS T.(BSC,MPHE)<br>
the association is more likely causal if a single exposure is linked to a single disease
6. Biological plausibility (coherence with existing information)
Additional support for the causal nature of an association exists if a causal interpretation is plausible in terms of current knowledge about the factor & dx
7. Prevention
If the exposure is a cause of the disease, then eliminating the exposure (or modifying host response to the exposure, for example through immunization ) should be followed by a decrease in the incidence rate of the disease 5/17/2020 126 EYERUS T.(BSC,MPHE)<br>
127
Judging the causal basis of the association No single study is sufficient for causal inference
It is always necessary to consider multiple alternate explanations before making conclusions about the causal relationship between any two items under investigation.
Causal inference is not a simple process
consider weight of evidence
requires judgment and interpretation 5/17/2020 127 EYERUS T.(BSC,MPHE)<br>
It is always necessary to consider multiple alternate explanations before making conclusions about the causal relationship between any two items under investigation.
Causal inference is not a simple process
consider weight of evidence
requires judgment and interpretation 5/17/2020 127 EYERUS T.(BSC,MPHE)<br>
128
Screening 128 5/17/2020 EYERUS T.(BSC,MPHE)<br>
129
screening At the end of this section students will be able to;
Define Disease Screening
Identify types of screening
calculate and differentiate between sensitivity, specificity, positive and negative predictive values of a diagnostic test
Recognize considerations in the Establishment of Screening Recommendations and Programs
Recognize how to evaluate a screening program 129 5/17/2020 EYERUS T.(BSC,MPHE)<br>
Define Disease Screening
Identify types of screening
calculate and differentiate between sensitivity, specificity, positive and negative predictive values of a diagnostic test
Recognize considerations in the Establishment of Screening Recommendations and Programs
Recognize how to evaluate a screening program 129 5/17/2020 EYERUS T.(BSC,MPHE)<br>
130
screening Definition:
Screening refers to the presumptive identification of a disease/defect by application of tests, examinations or other procedures in apparently healthy people.
Screening is an initial examination
Screening is not intended to be diagnostic 130 5/17/2020 EYERUS T.(BSC,MPHE)<br>
Screening refers to the presumptive identification of a disease/defect by application of tests, examinations or other procedures in apparently healthy people.
Screening is an initial examination
Screening is not intended to be diagnostic 130 5/17/2020 EYERUS T.(BSC,MPHE)<br>
131
Aims of screening program Changing disease progression efficiently
Altering natural course of disease
Protecting society from contagious disease
Allocating resources rationally
Selection of healthy people for job
Studying the natural history of disease 131 5/17/2020 EYERUS T.(BSC,MPHE)<br>
Altering natural course of disease
Protecting society from contagious disease
Allocating resources rationally
Selection of healthy people for job
Studying the natural history of disease 131 5/17/2020 EYERUS T.(BSC,MPHE)<br>
132
Types of screening 132 5/17/2020 EYERUS T.(BSC,MPHE)<br>
133
Population approach(mass) 133 5/17/2020 EYERUS T.(BSC,MPHE)<br>
134
High risk strategy 134 5/17/2020 EYERUS T.(BSC,MPHE)<br>
135
Multiphasic approach The application of two or more screening tests in combination to large number of people at one time than to carry out screening tests for single individual.
The procedure may also include health questionnaire, clinical examination and a range of measurements and investigation. 135 5/17/2020 EYERUS T.(BSC,MPHE)<br>
The procedure may also include health questionnaire, clinical examination and a range of measurements and investigation. 135 5/17/2020 EYERUS T.(BSC,MPHE)<br>
136
Criteria selecting disease for screening Severity- The disease should be serious
Treatment- Early treatment should be more beneficial
Prevalence- Pre-clinical Prevalence should be high 136 5/17/2020 EYERUS T.(BSC,MPHE)<br>
Treatment- Early treatment should be more beneficial
Prevalence- Pre-clinical Prevalence should be high 136 5/17/2020 EYERUS T.(BSC,MPHE)<br>
137
Criteria For Successful Screening Test:
If a test is available, should it be used? 137 5/17/2020 EYERUS T.(BSC,MPHE)<br>
138
Criteria For Successful Screening Test: Criteria for Disease:
Present in population screened.
High burden &of high public health concern.
Screening +Intervention must improve outcome.
Known natural history of the disease. 138 5/17/2020 EYERUS T.(BSC,MPHE)<br>
Present in population screened.
High burden &of high public health concern.
Screening +Intervention must improve outcome.
Known natural history of the disease. 138 5/17/2020 EYERUS T.(BSC,MPHE)<br>
139
Criteria For Successful Screening Test: Criteria for Test:
Reliable.
Valid.
Simple and inexpensive.
Very safe.
Acceptable to subjects and providers.
Cost-effective.
Exit strategy. 139 5/17/2020 EYERUS T.(BSC,MPHE)<br>
Reliable.
Valid.
Simple and inexpensive.
Very safe.
Acceptable to subjects and providers.
Cost-effective.
Exit strategy. 139 5/17/2020 EYERUS T.(BSC,MPHE)<br>
140
Criteria For Successful Screening Test: Exit strategy:
Facilities for diagnosis and appropriate treatments should be available for positive subjects.
Ethically not acceptable to offer screening without available management. 140 5/17/2020 EYERUS T.(BSC,MPHE)<br>
Facilities for diagnosis and appropriate treatments should be available for positive subjects.
Ethically not acceptable to offer screening without available management. 140 5/17/2020 EYERUS T.(BSC,MPHE)<br>
141
Criteria For Successful Screening Test: RELIABILTY: What Is The Definition Of Reliability ? What Are The Causes Of Unreliability ? 141 5/17/2020 EYERUS T.(BSC,MPHE)<br>
142
Criteria For Successful Screening Test: Definition of Reliability:
Repeatability, Reducibility, Precision.
Getting the same results, when the test repeated in same target individuals in the same settings. 142 5/17/2020 EYERUS T.(BSC,MPHE)<br>
Repeatability, Reducibility, Precision.
Getting the same results, when the test repeated in same target individuals in the same settings. 142 5/17/2020 EYERUS T.(BSC,MPHE)<br>
143
Criteria For Successful Screening Test: Causes of unreliability:
Observer variation.
Subject variation – Biological.
Technical method error variation. 143 5/17/2020 EYERUS T.(BSC,MPHE)<br>
Observer variation.
Subject variation – Biological.
Technical method error variation. 143 5/17/2020 EYERUS T.(BSC,MPHE)<br>
144
Criteria For Successful Screening Test: ACCEPTABILITY:
The test should not be:
Painful.
Unsafe.
Discomforting /Embarrassing.
Socially/ believes not accepted. 144 5/17/2020 EYERUS T.(BSC,MPHE)<br>
The test should not be:
Painful.
Unsafe.
Discomforting /Embarrassing.
Socially/ believes not accepted. 144 5/17/2020 EYERUS T.(BSC,MPHE)<br>
145
Criteria For Successful Screening Test: VALIDITY:
Ability of the test to distinguish between who has the diseases and who does not. 145 5/17/2020 EYERUS T.(BSC,MPHE)<br>
Ability of the test to distinguish between who has the diseases and who does not. 145 5/17/2020 EYERUS T.(BSC,MPHE)<br>
146
146 5/17/2020 EYERUS T.(BSC,MPHE)<br>
147
147 5/17/2020 EYERUS T.(BSC,MPHE)<br>
148
Sensitivity 148 5/17/2020 EYERUS T.(BSC,MPHE)<br>
149
Sensitivity [[A 90% Sensitivity means that 90% of the diseased people screened by the test will give a “true positive” and the remaining 10% a “false negative results”]] 149 Positive test and have the disease. Negative test and have the disease. 5/17/2020 EYERUS T.(BSC,MPHE)<br>
150
Specificity 150 5/17/2020 EYERUS T.(BSC,MPHE)<br>
151
Specificity [[A 90% Specificity means that 90% of the non diseased people screened by the test will give a “true negative” result, and the remaining 10% a “false positive results”]] 151 Negative test and do not have the disease. Positive test and do not have the disease. 5/17/2020 EYERUS T.(BSC,MPHE)<br>
152
Assume a population of 1,000 people 100 have a disease 900 do not have the disease A screening test is used to identify the 100 people with the disease 152 Sensitivity = 80/ 100 X 100= 80%
Specificity = 800/ 900 X 100 = 88% 5/17/2020 EYERUS T.(BSC,MPHE)<br>
Specificity = 800/ 900 X 100 = 88% 5/17/2020 EYERUS T.(BSC,MPHE)<br>
153
Practical Example 153 Sensitivity = 36/40 X 100 = 90%
Specificity = 306,000/360,000 X 100 = 85% 5/17/2020 EYERUS T.(BSC,MPHE)<br>
Specificity = 306,000/360,000 X 100 = 85% 5/17/2020 EYERUS T.(BSC,MPHE)<br>
154
154 5/17/2020 EYERUS T.(BSC,MPHE)<br>
155
Predictive value 155 5/17/2020 EYERUS T.(BSC,MPHE)<br>
156
Practical Example 156 Sensitivity = 40/140 X100 = 28.57%
Specificity = 9840/9860 X100 =99.79%
Positive predictive value = 40/60X100 = 66.66%
Negative predictive value = 9840/9940X100 = 98.9% 5/17/2020 EYERUS T.(BSC,MPHE)<br>
Specificity = 9840/9860 X100 =99.79%
Positive predictive value = 40/60X100 = 66.66%
Negative predictive value = 9840/9940X100 = 98.9% 5/17/2020 EYERUS T.(BSC,MPHE)<br>
157
Effects on Predictive Value 157 5/17/2020 EYERUS T.(BSC,MPHE)<br>
158
Prevalence of a disease The proportion of individuals with a disease
Prior/pre-test probability of a disease
Prevalence = P (D+)
= (a+c)/n 158 5/17/2020 EYERUS T.(BSC,MPHE)<br>
Prior/pre-test probability of a disease
Prevalence = P (D+)
= (a+c)/n 158 5/17/2020 EYERUS T.(BSC,MPHE)<br>
159
yield Yield –the amount of previously unrecognized disease that is diagnosed and brought to treatment as a result of the screening program.
Proportion of cases detected by the screening program
Yield = a/n 159 5/17/2020 EYERUS T.(BSC,MPHE)<br>
Proportion of cases detected by the screening program
Yield = a/n 159 5/17/2020 EYERUS T.(BSC,MPHE)<br>
160
Relation Between Sensitivity & Specificity 160 5/17/2020 EYERUS T.(BSC,MPHE)<br>
161
Relation Between Sensitivity & Specificity 161 5/17/2020 EYERUS T.(BSC,MPHE)<br>
162
Relation Between Sensitivity & Specificity 162 5/17/2020 EYERUS T.(BSC,MPHE)<br>
163
Risk of Screening 163 5/17/2020 EYERUS T.(BSC,MPHE)<br>
164
Multiple testing Parallel testing:
Tests are given concurrently
At least one positive indicates disease
Results in
Greater sensitivity
Increased PVN
Decreased specificity 164 5/17/2020 EYERUS T.(BSC,MPHE)<br>
Tests are given concurrently
At least one positive indicates disease
Results in
Greater sensitivity
Increased PVN
Decreased specificity 164 5/17/2020 EYERUS T.(BSC,MPHE)<br>
165
Multiple testing Serial testing:
Tests are administered sequentially
All positive indicates disease
Results in
Lower sensitivity
Increased specificity
Increased PVP 165 5/17/2020 EYERUS T.(BSC,MPHE)<br>
Tests are administered sequentially
All positive indicates disease
Results in
Lower sensitivity
Increased specificity
Increased PVP 165 5/17/2020 EYERUS T.(BSC,MPHE)<br>
166
Evaluation of screening program Evaluation of a screening program involves consideration of two issues
Feasibility: Determined by acceptability of the screening program
2. Effectiveness: Determined by the outcome of the screening program 166 5/17/2020 EYERUS T.(BSC,MPHE)<br>
Feasibility: Determined by acceptability of the screening program
2. Effectiveness: Determined by the outcome of the screening program 166 5/17/2020 EYERUS T.(BSC,MPHE)<br>
167
generally In general, a screening test should be
Reliable & valid
Sensitive & specific
Simple & acceptable
Effective & efficient 167 5/17/2020 EYERUS T.(BSC,MPHE)<br>
Reliable & valid
Sensitive & specific
Simple & acceptable
Effective & efficient 167 5/17/2020 EYERUS T.(BSC,MPHE)<br>
168
example 168 5/17/2020 EYERUS T.(BSC,MPHE)<br>
169
Epidemiological Surveillance 5/17/2020 169 EYERUS T.(BSC,MPHE)<br>
170
Learning objectives At the end of this lesson you will be able to
Define and differentiate surveillance Vs Survey
Understand and use case definition
State at least 5 uses of disease surveillance information.
Identify types of surveillance.
Describe steps in conducting surveillance. 5/17/2020 170 EYERUS T.(BSC,MPHE)<br>
Define and differentiate surveillance Vs Survey
Understand and use case definition
State at least 5 uses of disease surveillance information.
Identify types of surveillance.
Describe steps in conducting surveillance. 5/17/2020 170 EYERUS T.(BSC,MPHE)<br>
171
Epidemiological surveillance Surveillance is the continuous monitoring of disease and other health-related events relevant to the prevention and control of disease within the population.
The ongoing systematic collection, analysis, and interpretation of data essential to the planning, implementation, and evaluation of public health practice, closely integrated with the timely dissemination of these data to those responsible for prevention and control.(CDC) 5/17/2020 171 EYERUS T.(BSC,MPHE)<br>
The ongoing systematic collection, analysis, and interpretation of data essential to the planning, implementation, and evaluation of public health practice, closely integrated with the timely dissemination of these data to those responsible for prevention and control.(CDC) 5/17/2020 171 EYERUS T.(BSC,MPHE)<br>
172
Surveillance.. surveillance It is relatively cheap (for health department). Can often use existing system and personnel
Allow monitoring of trends of diseases over time
Ongoing collection allows to use enough cases for study
Quality control may be the major problem
May not provide representative data survey It is costly, needs to use by hiring trained once
Represents only single point in time and informs little of anything about change in time
More in-depth data could be collected
More accurate assessment of true incidence and prevalence
Can identify those which don’t warrant medical care 5/17/2020 172 EYERUS T.(BSC,MPHE)<br>
Allow monitoring of trends of diseases over time
Ongoing collection allows to use enough cases for study
Quality control may be the major problem
May not provide representative data survey It is costly, needs to use by hiring trained once
Represents only single point in time and informs little of anything about change in time
More in-depth data could be collected
More accurate assessment of true incidence and prevalence
Can identify those which don’t warrant medical care 5/17/2020 172 EYERUS T.(BSC,MPHE)<br>
173
Purpose of surveillance The main purposes of surveillance are:
To enable the early recognition, investigation, and control of outbreaks.
To provide baseline information for priority setting, planning and evaluating disease control programs.
To provide information for understanding the distribution of disease by time, place, and person, so as to provide clues for the investigation of disease etiology, again for the purpose of more effective control. 5/17/2020 173 EYERUS T.(BSC,MPHE)<br>
To enable the early recognition, investigation, and control of outbreaks.
To provide baseline information for priority setting, planning and evaluating disease control programs.
To provide information for understanding the distribution of disease by time, place, and person, so as to provide clues for the investigation of disease etiology, again for the purpose of more effective control. 5/17/2020 173 EYERUS T.(BSC,MPHE)<br>
174
Uses of surveillance Disease surveillance information is useful for:
Estimating the magnitude of a problem
Determining the geographic distribution of illness
Portraying the natural history of a disease
Detecting epidemics or defining a problem
Generating hypotheses, stimulating research
Evaluating control measures
To identify changes in infectious agents, host and environmental factors
Detecting changes in health practices
Facilitating planning 5/17/2020 174 EYERUS T.(BSC,MPHE)<br>
Estimating the magnitude of a problem
Determining the geographic distribution of illness
Portraying the natural history of a disease
Detecting epidemics or defining a problem
Generating hypotheses, stimulating research
Evaluating control measures
To identify changes in infectious agents, host and environmental factors
Detecting changes in health practices
Facilitating planning 5/17/2020 174 EYERUS T.(BSC,MPHE)<br>
175
Types of surveillance Surveillance is based on two mechanisms for the detection of the disease
Passive case detection- this involves cases detected in the course of the normal operation of the health service, through the self-reporting of patients to the health institutions.
Active case detection- this involves an active search for cases, by special surveys or other methods outside of the routine health service activities. 5/17/2020 175 EYERUS T.(BSC,MPHE)<br>
Passive case detection- this involves cases detected in the course of the normal operation of the health service, through the self-reporting of patients to the health institutions.
Active case detection- this involves an active search for cases, by special surveys or other methods outside of the routine health service activities. 5/17/2020 175 EYERUS T.(BSC,MPHE)<br>
176
Types of surveillance… Based on these two mechanisms for the detection of diseases, we have three forms of surveillances:
1.Passive surveillance- this is the mechanism for routine surveillance, based on passive case detection, and on the routine recording and reporting system.
Surveillance where reports are awaited and no attempts are made to seek reports actively from the participants in the system. (Provider-initiated, based on a known set of rules and regulations) 5/17/2020 176 EYERUS T.(BSC,MPHE)<br>
1.Passive surveillance- this is the mechanism for routine surveillance, based on passive case detection, and on the routine recording and reporting system.
Surveillance where reports are awaited and no attempts are made to seek reports actively from the participants in the system. (Provider-initiated, based on a known set of rules and regulations) 5/17/2020 176 EYERUS T.(BSC,MPHE)<br>
177
Advantages of passive surveillance Covers a wide range of problems
Does not require special arrangement
It is relatively cheap
Covers a wider area 5/17/2020 177 EYERUS T.(BSC,MPHE)<br>
Does not require special arrangement
It is relatively cheap
Covers a wider area 5/17/2020 177 EYERUS T.(BSC,MPHE)<br>
178
Disadvantages of passive surveillance The information generated is to a large extent unreliable, incomplete and inaccurate
Most of the time, data from passive surveillance is not available on time
Most of the time, you may not get the kind of information you desire
It lacks representativeness of the whole population since passive surveillance is mainly based on health institution reports 5/17/2020 178 EYERUS T.(BSC,MPHE)<br>
Most of the time, data from passive surveillance is not available on time
Most of the time, you may not get the kind of information you desire
It lacks representativeness of the whole population since passive surveillance is mainly based on health institution reports 5/17/2020 178 EYERUS T.(BSC,MPHE)<br>
179
Types of surveillance.. 2.Active surveillance- this refers to any surveillance activity outside of the routine system, undertaken for the further investigation of diseases outbreaks and other occurrences of public health importance.
Surveillance where public health officers seek reports from participants in the surveillance system on a regular basis, rather than waiting for the reports. e.g. by telephoning/contacting each participant twice a week, monthly... (Health Department-initiated) 5/17/2020 179 EYERUS T.(BSC,MPHE)<br>
Surveillance where public health officers seek reports from participants in the surveillance system on a regular basis, rather than waiting for the reports. e.g. by telephoning/contacting each participant twice a week, monthly... (Health Department-initiated) 5/17/2020 179 EYERUS T.(BSC,MPHE)<br>
180
Active surveillance In contrast to passive surveillance:
usually limited to specific diseases over a limited period of time, such as after a community exposure or during an epidemic.
Can not be used for routine purposes
relatively expensive
Usually complete/accurate 5/17/2020 180 EYERUS T.(BSC,MPHE)<br>
usually limited to specific diseases over a limited period of time, such as after a community exposure or during an epidemic.
Can not be used for routine purposes
relatively expensive
Usually complete/accurate 5/17/2020 180 EYERUS T.(BSC,MPHE)<br>
181
Active surveillance Indications of Active surveillance:
For periodic evaluation of ongoing programs
E.g. HIV/AIDS, EPI...
For programs which have time limit of operation
E.g. Small pox
With the occurrence of unusual situations:
when a new disease/event discovered
when investigating a new mode of transmission
when a high-risk period is recognized
when a disease appears in a new geographic area or found to affect a new subgroup of the population
when previously eradicated disease reappear or low incidence disease occur at a higher level of endemicity 5/17/2020 181 EYERUS T.(BSC,MPHE)<br>
For periodic evaluation of ongoing programs
E.g. HIV/AIDS, EPI...
For programs which have time limit of operation
E.g. Small pox
With the occurrence of unusual situations:
when a new disease/event discovered
when investigating a new mode of transmission
when a high-risk period is recognized
when a disease appears in a new geographic area or found to affect a new subgroup of the population
when previously eradicated disease reappear or low incidence disease occur at a higher level of endemicity 5/17/2020 181 EYERUS T.(BSC,MPHE)<br>
182
Active surveillance The advantages of active surveillance
The collected data is complete and accurate
Information collected is timely.
The disadvantages of active surveillance
It requires good organization
It is expensive
It requires skilled human power
It is for short period of time(not a continuous process)
It is directed towards specific disease conditions 5/17/2020 182 EYERUS T.(BSC,MPHE)<br>
The collected data is complete and accurate
Information collected is timely.
The disadvantages of active surveillance
It requires good organization
It is expensive
It requires skilled human power
It is for short period of time(not a continuous process)
It is directed towards specific disease conditions 5/17/2020 182 EYERUS T.(BSC,MPHE)<br>
183
3. Sentinel Surveillance System Uses a pre-arranged sample of reporting sources to report all cases of one or more conditions.
Means of monitoring trends of health events in chosen population groups and chosen sites in a regular and consistent (Uniform) way.
Need not be representative:
However it is very important to keep sites, facilities, procedures and populations remain similar
Selection of study population must be with minimal bias
Sufficient demographic data must be collected to detect changes in population composition 5/17/2020 183 EYERUS T.(BSC,MPHE)<br>
Means of monitoring trends of health events in chosen population groups and chosen sites in a regular and consistent (Uniform) way.
Need not be representative:
However it is very important to keep sites, facilities, procedures and populations remain similar
Selection of study population must be with minimal bias
Sufficient demographic data must be collected to detect changes in population composition 5/17/2020 183 EYERUS T.(BSC,MPHE)<br>
184
Main purpose of sentinel surveillance To detect changes
To direct and focus control efforts
To develop intervention strategies
To promote further investigations
Provide the basis for evaluating preventive strategies and activities 5/17/2020 184 EYERUS T.(BSC,MPHE)<br>
To direct and focus control efforts
To develop intervention strategies
To promote further investigations
Provide the basis for evaluating preventive strategies and activities 5/17/2020 184 EYERUS T.(BSC,MPHE)<br>
185
Features of good surveillance system Uses a combination of passive and active mechanisms
Collects the minimum data in a simplest possible way
Collects data in a manner useful for the workers who collect the data (To assure quality and enhance compliance)
Timely reporting
Provide timely and comprehensive response/action (Action targeted to case detection and treatment and as well as to the control of the disease)
Incorporate strong laboratory services for accurate
diagnosis 5/17/2020 185 EYERUS T.(BSC,MPHE)<br>
Collects the minimum data in a simplest possible way
Collects data in a manner useful for the workers who collect the data (To assure quality and enhance compliance)
Timely reporting
Provide timely and comprehensive response/action (Action targeted to case detection and treatment and as well as to the control of the disease)
Incorporate strong laboratory services for accurate
diagnosis 5/17/2020 185 EYERUS T.(BSC,MPHE)<br>
186
Critical information in surveillance Person: Age, sex
Time: onset of disease, reporting period
Place: woreda, region
Risk factors
Number of cases (magnitude)
Treatment outcome: deaths, recovery (seriousness)
Mode of treatment: inpatient/outpatient 5/17/2020 186 EYERUS T.(BSC,MPHE)<br>
Time: onset of disease, reporting period
Place: woreda, region
Risk factors
Number of cases (magnitude)
Treatment outcome: deaths, recovery (seriousness)
Mode of treatment: inpatient/outpatient 5/17/2020 186 EYERUS T.(BSC,MPHE)<br>
187
Most common limitation in surveillance system Under reporting
Lack of representativeness of reported cases
Lack of timeliness
Inconsistency of case-definitions
Lack and shortage of qualified staff
Lack of motivation 5/17/2020 187 EYERUS T.(BSC,MPHE)<br>
Lack of representativeness of reported cases
Lack of timeliness
Inconsistency of case-definitions
Lack and shortage of qualified staff
Lack of motivation 5/17/2020 187 EYERUS T.(BSC,MPHE)<br>
188
The Most Common Means of Strengthening Surveillance System Improving awareness of practitioners
Simplification of the process of reporting
Frequent feedback to those reporting
Widening the "net"
(e.g. obtaining reports from laboratories or schools, rather than relying on physicians)
Using active (rather than passive) surveillance.
Remember to "share the data, share the responsibility, and share the credit" 5/17/2020 188 EYERUS T.(BSC,MPHE)<br>
Simplification of the process of reporting
Frequent feedback to those reporting
Widening the "net"
(e.g. obtaining reports from laboratories or schools, rather than relying on physicians)
Using active (rather than passive) surveillance.
Remember to "share the data, share the responsibility, and share the credit" 5/17/2020 188 EYERUS T.(BSC,MPHE)<br>
189
Selection of disease for surveillance All diseases may not be included in surveillances:
The importance of a health event to be included in surveillance system, it should be assessed through certain criteria 5/17/2020 189 EYERUS T.(BSC,MPHE)<br>
The importance of a health event to be included in surveillance system, it should be assessed through certain criteria 5/17/2020 189 EYERUS T.(BSC,MPHE)<br>
190
Criteria of inclusion in surveillance The current impact of the health event
Having high incidence/ prevalence
Mortality(overall and age-specific)
Morbidity (hospitalization, disability, top morbidity)
Severity (case fatality)
Health care cost
Eg. Malaria, pneumonia, TB, HIV/AIDS 5/17/2020 190 EYERUS T.(BSC,MPHE)<br>
Having high incidence/ prevalence
Mortality(overall and age-specific)
Morbidity (hospitalization, disability, top morbidity)
Severity (case fatality)
Health care cost
Eg. Malaria, pneumonia, TB, HIV/AIDS 5/17/2020 190 EYERUS T.(BSC,MPHE)<br>
191
Criteria inclusion in surveillance Having Epidemic Potential
(Eg. measles, cholera, meningitis)
Surveillance internationally required
(Eg. plague, yellow fever, cholera)
Having available and effective control and prevention intervention
(Eg. Schistosomiasis, onchocerciais, trypanosomiasis)
Can easily be identified using simple case definitions
Having intervention program already found in the country (Eg. IMCI, EPI) 5/17/2020 191 EYERUS T.(BSC,MPHE)<br>
(Eg. measles, cholera, meningitis)
Surveillance internationally required
(Eg. plague, yellow fever, cholera)
Having available and effective control and prevention intervention
(Eg. Schistosomiasis, onchocerciais, trypanosomiasis)
Can easily be identified using simple case definitions
Having intervention program already found in the country (Eg. IMCI, EPI) 5/17/2020 191 EYERUS T.(BSC,MPHE)<br>
192
List of priority disease in Ethiopia Epidemic Prone diseases
Cholera
Bloody diarrhea
Measles
Meningitis
Plague
Viral hemorrhagic fever
Yellow fever
Typhoid fever
Relapsing fever
Endemic typhus
Malaria Diseases eradication targeted
Polio (AFP)
Dracunculosis (Guinea worm)
Leprosy
Neonatal tetanus
Public health important diseases
Child pneumonia
Diarrhea in children
New AIDS cases
Oncocerciasis
STDs
TB
Rabies 5/17/2020 192 EYERUS T.(BSC,MPHE)<br>
Cholera
Bloody diarrhea
Measles
Meningitis
Plague
Viral hemorrhagic fever
Yellow fever
Typhoid fever
Relapsing fever
Endemic typhus
Malaria Diseases eradication targeted
Polio (AFP)
Dracunculosis (Guinea worm)
Leprosy
Neonatal tetanus
Public health important diseases
Child pneumonia
Diarrhea in children
New AIDS cases
Oncocerciasis
STDs
TB
Rabies 5/17/2020 192 EYERUS T.(BSC,MPHE)<br>
193
Once diseases for surveillance are selected we should do the following items Case definition of diseases included in the surveillance
Determine the population under surveillance
Determine time period of data collection
(immediately, weekly, monthly)
Determine source of data, who should report
Determine how data are handled (confidentiality) 5/17/2020 193 EYERUS T.(BSC,MPHE)<br>
Determine the population under surveillance
Determine time period of data collection
(immediately, weekly, monthly)
Determine source of data, who should report
Determine how data are handled (confidentiality) 5/17/2020 193 EYERUS T.(BSC,MPHE)<br>
194
Once diseases for surveillance are selected we should do the following items Epidemiologists ask,
Who gets the disease?
In what frequency is?
Is the frequency changing over time?
How does the frequency compare between population?”
Answering such questions requires:
a case definition and
estimating comparable disease frequency measures 5/17/2020 194 EYERUS T.(BSC,MPHE)<br>
Who gets the disease?
In what frequency is?
Is the frequency changing over time?
How does the frequency compare between population?”
Answering such questions requires:
a case definition and
estimating comparable disease frequency measures 5/17/2020 194 EYERUS T.(BSC,MPHE)<br>
195
Case definition Case definition
Standard set of criteria for deciding whether an individual should be classified as having the health condition of interest
It includes
– Criteria: Signs and symptoms with or without a laboratory test
– Restriction by time, place and person can be done depending on the nature of the disease
• Classification of case definition
1. Confirmed: a case definition by appropriate lab. Test
2. Probable: a case with typical clinical features of the disease without laboratory confirmation
3. Possible/ Suspect: a case with few of the typical clinical features.
Use case definition consistently!! 5/17/2020 195 EYERUS T.(BSC,MPHE)<br>
Standard set of criteria for deciding whether an individual should be classified as having the health condition of interest
It includes
– Criteria: Signs and symptoms with or without a laboratory test
– Restriction by time, place and person can be done depending on the nature of the disease
• Classification of case definition
1. Confirmed: a case definition by appropriate lab. Test
2. Probable: a case with typical clinical features of the disease without laboratory confirmation
3. Possible/ Suspect: a case with few of the typical clinical features.
Use case definition consistently!! 5/17/2020 195 EYERUS T.(BSC,MPHE)<br>
196
Case definitions… A case considered epidemiologically linked
to a laboratory-confirmed case;
“ if at least one case
….in the chain of transmission
…..is laboratory confirmed. 5/17/2020 196 EYERUS T.(BSC,MPHE)<br>
to a laboratory-confirmed case;
“ if at least one case
….in the chain of transmission
…..is laboratory confirmed. 5/17/2020 196 EYERUS T.(BSC,MPHE)<br>
197
Case definition Example1: Measles (Rubella) case definition
The CDC has established case definitions for public health reporting purposes.
The CDC clinical case definition requires at least 3 characteristics to be present in a clinical case,
…rash, fever and cough, coryza or conjunctivitis
A patient characterized clinically without any laboratory testing 5/17/2020 197 EYERUS T.(BSC,MPHE)<br>
The CDC has established case definitions for public health reporting purposes.
The CDC clinical case definition requires at least 3 characteristics to be present in a clinical case,
…rash, fever and cough, coryza or conjunctivitis
A patient characterized clinically without any laboratory testing 5/17/2020 197 EYERUS T.(BSC,MPHE)<br>
198
Case definition Example1: Measles (Rubella) case definition
With laboratory results, if any of these four criteria met, the case of measles is laboratory confirmed.
positive serological test,
a rise in the measles antibody level,
detection of measles-virus-specific nucleic acid
isolation of the virus from the actual specimen 5/17/2020 198 EYERUS T.(BSC,MPHE)<br>
With laboratory results, if any of these four criteria met, the case of measles is laboratory confirmed.
positive serological test,
a rise in the measles antibody level,
detection of measles-virus-specific nucleic acid
isolation of the virus from the actual specimen 5/17/2020 198 EYERUS T.(BSC,MPHE)<br>
199
2.Determain population under surveillance A surveillance system remains effective when it is continuously assessed
Periodically updating information about the catchment population is necessary
Important target groups usually include:
Under-5 years children
Women of child bearing age
People living in refuge etc..
(prepare detailed demographic data) 5/17/2020 199 EYERUS T.(BSC,MPHE)<br>
Periodically updating information about the catchment population is necessary
Important target groups usually include:
Under-5 years children
Women of child bearing age
People living in refuge etc..
(prepare detailed demographic data) 5/17/2020 199 EYERUS T.(BSC,MPHE)<br>
200
3. Time period of data collection It is useful to identify problems and solve timely
There are three periods of reporting
Immediate reporting:
For disease that are not considered as endemic and are considered epidemic
Eg, covid 19, cholera, plague, viral hemorrhagic fever, polio, yellow fever
Suspected epidemic when a threshold is crossed 5/17/2020 200 EYERUS T.(BSC,MPHE)<br>
There are three periods of reporting
Immediate reporting:
For disease that are not considered as endemic and are considered epidemic
Eg, covid 19, cholera, plague, viral hemorrhagic fever, polio, yellow fever
Suspected epidemic when a threshold is crossed 5/17/2020 200 EYERUS T.(BSC,MPHE)<br>
201
3. Time period of data collection Weekly reporting:
For epidemic-prone diseases
Eg, malaria, meningitis, dysentery, relapsing fever, typhoid fever, typhus
On monthly bases
For routine surveillance
Eg, TB, leprosy, AIDS cases 5/17/2020 201 EYERUS T.(BSC,MPHE)<br>
For epidemic-prone diseases
Eg, malaria, meningitis, dysentery, relapsing fever, typhoid fever, typhus
On monthly bases
For routine surveillance
Eg, TB, leprosy, AIDS cases 5/17/2020 201 EYERUS T.(BSC,MPHE)<br>
202
Steps in surveillance Data collection:
Sources include
Mortality Report ( vital statistics)
Morbidity Report ( notify able diseases report, Hospital report, Lab report etc)
Epidemic Report
Reports of lab utilization
Reports of individual case investigation
Special surveys
Information on animal reservoir and vectors
Demographic data
Environmental data 5/17/2020 202 EYERUS T.(BSC,MPHE)<br>
Sources include
Mortality Report ( vital statistics)
Morbidity Report ( notify able diseases report, Hospital report, Lab report etc)
Epidemic Report
Reports of lab utilization
Reports of individual case investigation
Special surveys
Information on animal reservoir and vectors
Demographic data
Environmental data 5/17/2020 202 EYERUS T.(BSC,MPHE)<br>
203
Steps in surveillance Analysis:
include
Analyzing by time
Analyzing by place
Analyzing by person
Interpretation
Dissemination of surveillance data
Link to public health action 5/17/2020 203 EYERUS T.(BSC,MPHE)<br>
include
Analyzing by time
Analyzing by place
Analyzing by person
Interpretation
Dissemination of surveillance data
Link to public health action 5/17/2020 203 EYERUS T.(BSC,MPHE)<br>
204
OUTBREAK INVESTIGATION
AND
MANAGEMENT 5/17/2020 204 EYERUS T.(BSC,MPHE)<br>
205
Objectives At the end of this lesson you will be able to
use common terms in outbreak investigation appropriately
develop an outbreak investigation plan
describe a potential outbreak with regard to person, place and time.
construct and interpret an epi-curve to describe the course of an outbreak
practically use an outbreak management principles 5/17/2020 205 EYERUS T.(BSC,MPHE)<br>
use common terms in outbreak investigation appropriately
develop an outbreak investigation plan
describe a potential outbreak with regard to person, place and time.
construct and interpret an epi-curve to describe the course of an outbreak
practically use an outbreak management principles 5/17/2020 205 EYERUS T.(BSC,MPHE)<br>
206
Patterns of disease Endemic-usual level of morbidity
An endemic disease is a disease that occurs in a population with predictable regularity and with only minor deviations from its expected frequency of occurrence
E.g. - Tb, Malaria, Typhoid, dysentery, HIV, Malnutrition, Meningitis, leshmaniasis, Trachoma, Scabies, Schistosomiasis, Onchocerciasis in Ethiopia
Patterns of endemicity
Additional terms can be used to describe endemic diseases according to their frequency of occurrence:
E.g. – Malaria – Holoendemic, Hyperendemic, Mesoendemic, Hypoendemic 5/17/2020 206 EYERUS T.(BSC,MPHE)<br>
An endemic disease is a disease that occurs in a population with predictable regularity and with only minor deviations from its expected frequency of occurrence
E.g. - Tb, Malaria, Typhoid, dysentery, HIV, Malnutrition, Meningitis, leshmaniasis, Trachoma, Scabies, Schistosomiasis, Onchocerciasis in Ethiopia
Patterns of endemicity
Additional terms can be used to describe endemic diseases according to their frequency of occurrence:
E.g. – Malaria – Holoendemic, Hyperendemic, Mesoendemic, Hypoendemic 5/17/2020 206 EYERUS T.(BSC,MPHE)<br>
207
Endemic Hyperendemic is an endemic disease that affects a high proportion of the population at risk
Holoendemic-situation in which there is high level of infection among child population beginning early in life and adults show less incidence e.g. malaria
Mesoendemic is an endemic disease that affects a moderate proportion of the population at risk.
Hypoendemic is an endemic disease that affects a small proportion of the population at risk. 5/17/2020 207 EYERUS T.(BSC,MPHE)<br>
Holoendemic-situation in which there is high level of infection among child population beginning early in life and adults show less incidence e.g. malaria
Mesoendemic is an endemic disease that affects a moderate proportion of the population at risk.
Hypoendemic is an endemic disease that affects a small proportion of the population at risk. 5/17/2020 207 EYERUS T.(BSC,MPHE)<br>
208
Epidemic Definition - occurrence of health related condition in excess of its expected frequency in a given population
Health related condition-infectious and non-infectious conditions
Expected frequency-magnitude for the given period, place and population from previous data
E.g. - Malaria, Measles, Meningitis, Cholera , Shigelloses, Diarrhea with dehydration, Plague, Typhoid fever, Relapsing fever, Epidemic typhus
Pandemic- global epidemic
E.g. - HIV/AIDS, covid 19 5/17/2020 208 EYERUS T.(BSC,MPHE)<br>
Health related condition-infectious and non-infectious conditions
Expected frequency-magnitude for the given period, place and population from previous data
E.g. - Malaria, Measles, Meningitis, Cholera , Shigelloses, Diarrhea with dehydration, Plague, Typhoid fever, Relapsing fever, Epidemic typhus
Pandemic- global epidemic
E.g. - HIV/AIDS, covid 19 5/17/2020 208 EYERUS T.(BSC,MPHE)<br>
209
Epidemic have the following patterns Sporadic-irregular intervals E.g. – Plague
Periodic/Cyclic-regular intervals E.g. –measles, diarrhea,
Secular-slow changes over time E.g. – lung ca
Epidemic lasting long may remain endemic
Endemic disease can turn out to be epidemic
Due to increase in susceptible, ecological changes, increase in carries, new strains 5/17/2020 209 EYERUS T.(BSC,MPHE)<br>
Periodic/Cyclic-regular intervals E.g. –measles, diarrhea,
Secular-slow changes over time E.g. – lung ca
Epidemic lasting long may remain endemic
Endemic disease can turn out to be epidemic
Due to increase in susceptible, ecological changes, increase in carries, new strains 5/17/2020 209 EYERUS T.(BSC,MPHE)<br>
210
Epidemics… Outbreak: is an epidemic of shorter duration covering a limited area.
It is usually used interchangeably with Epidemic.
E.g. Outbreak of gastroenteritis after sharing a common meal at an event
Cluster: is an unusual aggregation of health events in a given area over a particular period.
The emphasis in case of a cluster is aggregation in a certain locality than the actual number of cases. 5/17/2020 210 EYERUS T.(BSC,MPHE)<br>
It is usually used interchangeably with Epidemic.
E.g. Outbreak of gastroenteritis after sharing a common meal at an event
Cluster: is an unusual aggregation of health events in a given area over a particular period.
The emphasis in case of a cluster is aggregation in a certain locality than the actual number of cases. 5/17/2020 210 EYERUS T.(BSC,MPHE)<br>
211
Types of epidemics Two principal types are well known; these are the common source and propagated/progressive
The two types can be distinguished by plotting an epidemic curve/time curve/
An epidemic, which shows the features of both types, is referred as mixed 5/17/2020 211 EYERUS T.(BSC,MPHE)<br>
The two types can be distinguished by plotting an epidemic curve/time curve/
An epidemic, which shows the features of both types, is referred as mixed 5/17/2020 211 EYERUS T.(BSC,MPHE)<br>
212
Types of epidemics 1 . Common source epidemics
Caused by exposure of a group of people to a common noxious influence, such as an infectious agent or a toxin.
Depending on duration of exposure:
Point source Vs Common source with continued exposure
If the exposure to agent and simultaneous all with develop the disease within one incubation period referred as point source epidemic.
Rapid rise and fall of an epidemic curve suggests a point source epidemic called long normal distribution. 5/17/2020 212 EYERUS T.(BSC,MPHE)<br>
Caused by exposure of a group of people to a common noxious influence, such as an infectious agent or a toxin.
Depending on duration of exposure:
Point source Vs Common source with continued exposure
If the exposure to agent and simultaneous all with develop the disease within one incubation period referred as point source epidemic.
Rapid rise and fall of an epidemic curve suggests a point source epidemic called long normal distribution. 5/17/2020 212 EYERUS T.(BSC,MPHE)<br>
213
Types of epidemics… Point source epidemics
Exposure is brief and simultaneous
Cases develop within one incubation period
E.g. - food-borne outbreak
Epidemic curve-rapid rise and fall of number of cases 5/17/2020 213 EYERUS T.(BSC,MPHE)<br>
Exposure is brief and simultaneous
Cases develop within one incubation period
E.g. - food-borne outbreak
Epidemic curve-rapid rise and fall of number of cases 5/17/2020 213 EYERUS T.(BSC,MPHE)<br>
214
Types of epidemics… Continuous common source epidemic mainly wide peak in the epidemic curve, because of the range of exposures and range of incubation periods.
Intermittent common source-results in particular patterns of the epidemic curve that reflects the intermittent nature of the epidemic. 5/17/2020 214 EYERUS T.(BSC,MPHE)<br>
Intermittent common source-results in particular patterns of the epidemic curve that reflects the intermittent nature of the epidemic. 5/17/2020 214 EYERUS T.(BSC,MPHE)<br>
215
Types of epidemics… Common source epidemic with continuous or intermittent exposure
Exposure continues over a period of time
Lasts for more than one incubation period
E.g. – Outbreak of hepatitis A from exposure to food handler intermittently or continuously
Epidemic curve-extended and irregular 5/17/2020 215 EYERUS T.(BSC,MPHE)<br>
Exposure continues over a period of time
Lasts for more than one incubation period
E.g. – Outbreak of hepatitis A from exposure to food handler intermittently or continuously
Epidemic curve-extended and irregular 5/17/2020 215 EYERUS T.(BSC,MPHE)<br>
216
Types of epidemics… 2. Propagated /progressive epidemics
Outbreak of this type can occur through direct person-to-person transmission
or the transmission could pass through a vector from infected to healthy person.
The epidemic curve would have a successive series of peaks reflecting increasing numbers of cases in each generation. 5/17/2020 216 EYERUS T.(BSC,MPHE)<br>
Outbreak of this type can occur through direct person-to-person transmission
or the transmission could pass through a vector from infected to healthy person.
The epidemic curve would have a successive series of peaks reflecting increasing numbers of cases in each generation. 5/17/2020 216 EYERUS T.(BSC,MPHE)<br>
217
Types of epidemics… Propagated/Progressive epidemics
Occur as a result of transmission from person to person
Lasts for more than one incubation period
E.g. – Measles, Malaria, Shigellosis
Epidemic curve-initial slow rise, succession of several peaks and usually sharp fall 5/17/2020 217 EYERUS T.(BSC,MPHE)<br>
Occur as a result of transmission from person to person
Lasts for more than one incubation period
E.g. – Measles, Malaria, Shigellosis
Epidemic curve-initial slow rise, succession of several peaks and usually sharp fall 5/17/2020 217 EYERUS T.(BSC,MPHE)<br>
218
The epidemic curve for a propagative epidemic. 5/17/2020 218 EYERUS T.(BSC,MPHE)<br>
219
Types of epidemics.. Mixed
Point source epidemic may be followed by propagated epidemic
E.g. – Shigelloses epidemic following exposure to common contaminated food supply followed by person-to-person spread 5/17/2020 219 EYERUS T.(BSC,MPHE)<br>
Point source epidemic may be followed by propagated epidemic
E.g. – Shigelloses epidemic following exposure to common contaminated food supply followed by person-to-person spread 5/17/2020 219 EYERUS T.(BSC,MPHE)<br>
220
Mixed epidemics Time
Intermittent common
Source- no clear pattern, may be a mixture of the two( e.g. common source=>second day=>person to person spread 5/17/2020 220 EYERUS T.(BSC,MPHE)<br>
Intermittent common
Source- no clear pattern, may be a mixture of the two( e.g. common source=>second day=>person to person spread 5/17/2020 220 EYERUS T.(BSC,MPHE)<br>
221
Investigation and control of outbreak Why do we investigate outbreaks?
Control and prevention measures
Evaluation of control programs e.g. EPI
Opportunity for research
Training opportunity
Public, political or legal concern 5/17/2020 221 EYERUS T.(BSC,MPHE)<br>
Control and prevention measures
Evaluation of control programs e.g. EPI
Opportunity for research
Training opportunity
Public, political or legal concern 5/17/2020 221 EYERUS T.(BSC,MPHE)<br>
222
Epidemic investigation Epidemic investigations: study of outbreaks, in local populations, to identify agent(s), transmission mode(s), and possible control measure(s)
Investigation-determining the causes so as to control the epidemic
Causes:
Agent
Source
Mode of transmission
Contributing factors 5/17/2020 222 EYERUS T.(BSC,MPHE)<br>
Investigation-determining the causes so as to control the epidemic
Causes:
Agent
Source
Mode of transmission
Contributing factors 5/17/2020 222 EYERUS T.(BSC,MPHE)<br>
223
Steps in epidemic investigation 1. Prepare for fieldwork
A. Investigation related preparation
Specific knowledge
Supplies and equipment
Literature review
B. Administration related
Observe all administrative procedures such as transportation and personal.
C. Consultation
Clarify your and your team role in the field.
Identify local contacts at the site. 5/17/2020 223 EYERUS T.(BSC,MPHE)<br>
A. Investigation related preparation
Specific knowledge
Supplies and equipment
Literature review
B. Administration related
Observe all administrative procedures such as transportation and personal.
C. Consultation
Clarify your and your team role in the field.
Identify local contacts at the site. 5/17/2020 223 EYERUS T.(BSC,MPHE)<br>
224
Steps… 2. Verify the existence of an epidemic
Verify the diagnosis
Case definition
Is a standard set of criteria for deciding whether an individual should be classified as having the health condition of the interest.
Types of the case definition:-
Confirmed/definite-a case with lab. Verification.
Probable –a case with typical clinical features of the disease without lab. Confirmation.
Possible-a case presented with fewer of the typical clinical features 5/17/2020 224 EYERUS T.(BSC,MPHE)<br>
Verify the diagnosis
Case definition
Is a standard set of criteria for deciding whether an individual should be classified as having the health condition of the interest.
Types of the case definition:-
Confirmed/definite-a case with lab. Verification.
Probable –a case with typical clinical features of the disease without lab. Confirmation.
Possible-a case presented with fewer of the typical clinical features 5/17/2020 224 EYERUS T.(BSC,MPHE)<br>
225
Steps 2… Compare expected cases vs. observed
Excess cases may be actual/real or artifactual
Actual:
Change in incidence
Change in age composition
Catastrophes
Duration of illness
Artifactual:
Change in diagnostic methods
Change in case detection
Change in reporting
Change in disease classification/ death
Change in population count 5/17/2020 225 EYERUS T.(BSC,MPHE)<br>
Excess cases may be actual/real or artifactual
Actual:
Change in incidence
Change in age composition
Catastrophes
Duration of illness
Artifactual:
Change in diagnostic methods
Change in case detection
Change in reporting
Change in disease classification/ death
Change in population count 5/17/2020 225 EYERUS T.(BSC,MPHE)<br>
226
Steps… 3. Describe the epidemic with respect to time, place and person.
Epidemic curve-plots the cases by the time of onset and provides a time frame for the outbreak investigation.
Spot map-plots cases by location and shows the geographic spreads of cases.
Attack rates-calculate rates of illness in population at risk. 5/17/2020 226 EYERUS T.(BSC,MPHE)<br>
Epidemic curve-plots the cases by the time of onset and provides a time frame for the outbreak investigation.
Spot map-plots cases by location and shows the geographic spreads of cases.
Attack rates-calculate rates of illness in population at risk. 5/17/2020 226 EYERUS T.(BSC,MPHE)<br>
227
Steps… 4. Formulate and test hypothesis
Formulate hypothesis based on your characterization of the epidemic by time, place and person
The hypothesis should address:-
The source of the agent
The mode of transmission
The exposure that cause the disease
Determine the type of epidemic
Define the population at risk 5/17/2020 227 EYERUS T.(BSC,MPHE)<br>
Formulate hypothesis based on your characterization of the epidemic by time, place and person
The hypothesis should address:-
The source of the agent
The mode of transmission
The exposure that cause the disease
Determine the type of epidemic
Define the population at risk 5/17/2020 227 EYERUS T.(BSC,MPHE)<br>
228
Steps.. 5/17/2020 228 5. Search for additional case.
Epidemiological – case control (healthy individuals from same population)
Laboratory analysis
Medical examination
6. Do descriptive epidemiology and describe the epidemic by PPT and do data analysis
7. Make a decision on the hypothesis tested
8. Intervention and follow up.
9. Report of the investigation/communicating finding EYERUS T.(BSC,MPHE)<br>
Epidemiological – case control (healthy individuals from same population)
Laboratory analysis
Medical examination
6. Do descriptive epidemiology and describe the epidemic by PPT and do data analysis
7. Make a decision on the hypothesis tested
8. Intervention and follow up.
9. Report of the investigation/communicating finding EYERUS T.(BSC,MPHE)<br>
229
Managing outbreak/epidemics Measures directed against the reservoir
Domestic animals
Immunization
Distraction of infected animals
Wild animals
Post-exposure prophylaxis
Humans
Removal of the focus of infection.
Isolation of infected person
Treatment
Disinfection of contaminated object
Quarantine –is the limitation of freedom of movement of apparently healthy persons or animals who have been exposing to a case of infectious diseases 5/17/2020 229 EYERUS T.(BSC,MPHE)<br>
Domestic animals
Immunization
Distraction of infected animals
Wild animals
Post-exposure prophylaxis
Humans
Removal of the focus of infection.
Isolation of infected person
Treatment
Disinfection of contaminated object
Quarantine –is the limitation of freedom of movement of apparently healthy persons or animals who have been exposing to a case of infectious diseases 5/17/2020 229 EYERUS T.(BSC,MPHE)<br>
230
Managing outbreak/epidemics Measures that interrupt the transmission of organisms.
Purification of water.
Pasteurilization of milk.
Inspection procedures designed to ensure safe food supply
Improve housing condition
Measures that reduce host susceptibility.
Active immunization
Passive immunization
Chemoprophylaxis 5/17/2020 230 EYERUS T.(BSC,MPHE)<br>
Purification of water.
Pasteurilization of milk.
Inspection procedures designed to ensure safe food supply
Improve housing condition
Measures that reduce host susceptibility.
Active immunization
Passive immunization
Chemoprophylaxis 5/17/2020 230 EYERUS T.(BSC,MPHE)<br>
231
Activity
Describe management of covid 19? 5/17/2020 EYERUS T.(BSC,MPHE) 231<br>
Describe management of covid 19? 5/17/2020 EYERUS T.(BSC,MPHE) 231<br>
232
Thank you!!! 5/17/2020 232 EYERUS T.(BSC,MPHE)<br>