
Executive Summary Embargo: Contents not for

Description: Executive Summary Embargo: Contents not for communication in any form before 2:00pm on Thursday 15 May 2014. Managing a Growing Economy Hon Bill English, Minister of Finance 15 May 2014 ISBN: 978-0-478-42175-0 (Online)
Related Topics
Download Presentation
"Executive Summary Embargo: Contents not for" is the property of its rightful owner. Permission is granted to download and print the materials on this website for personal, non-commercial use only, and to display it on your personal computer provided you do not modify the materials and that you retain all copyright notices contained in the materials. By downloading content from our website, you accept the terms of this agreement.
Presentation Transcript
slide1. Executive Summary Embargo: Contents not for communication in any form before 2:00pm on Thursday 15 May 2014. Managing a Growing Economy
Hon Bill English, Minister of Finance
15 May 2014 ISBN: 978-0-478-42175-0 (Online) 978-0-478-42174-3 (Print), PURL: http://purl.oclc.org/nzt/b-1656, Treasury URL: www.treasury.govt.nz/budget/2014/execsumm<br>
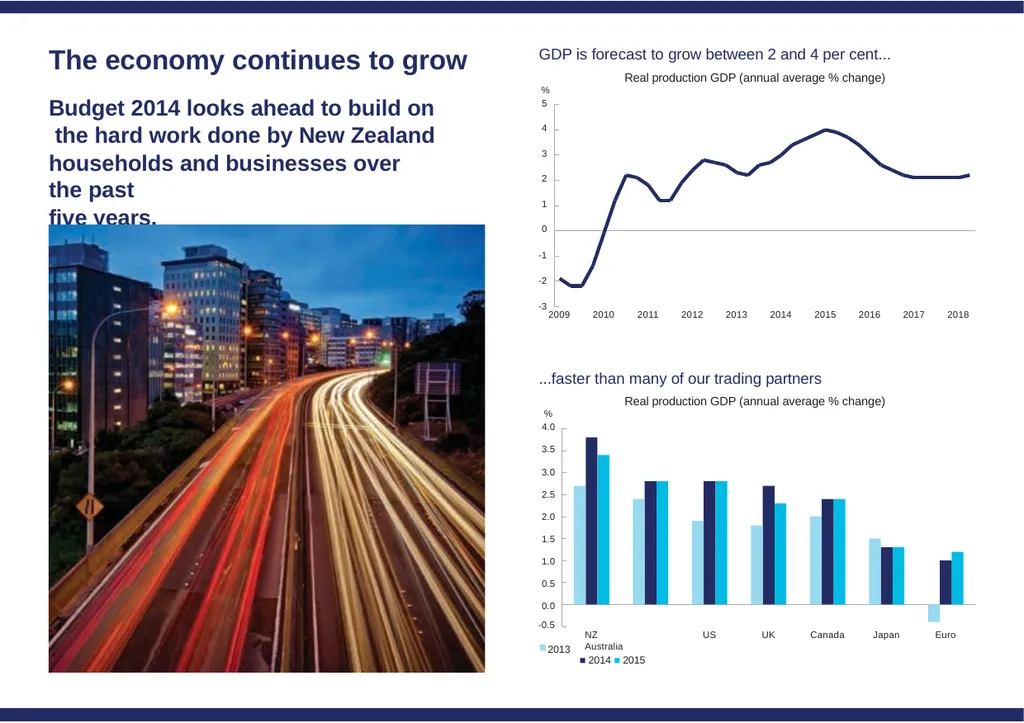
slide2. The economy continues to grow Budget 2014 looks ahead to build on the hard work done by New Zealand
households and businesses over the past
five years. GDP is forecast to grow between 2 and 4 per cent...
Real production GDP (annual average % change)
% 0
-1
-2
-3 1 2 3 4 5 2018 2017 2016 2015 2014 2013 2012 2011 2010 2009 2013 -0.5 ...faster than many of our trading partners
Real production GDP (annual average % change)
%
4.0
3.5
3.0
2.5
2.0
1.5
1.0
0.5
0.0 Euro Japan Canada UK US NZ Australia
■ 2014 ■ 2015<br>
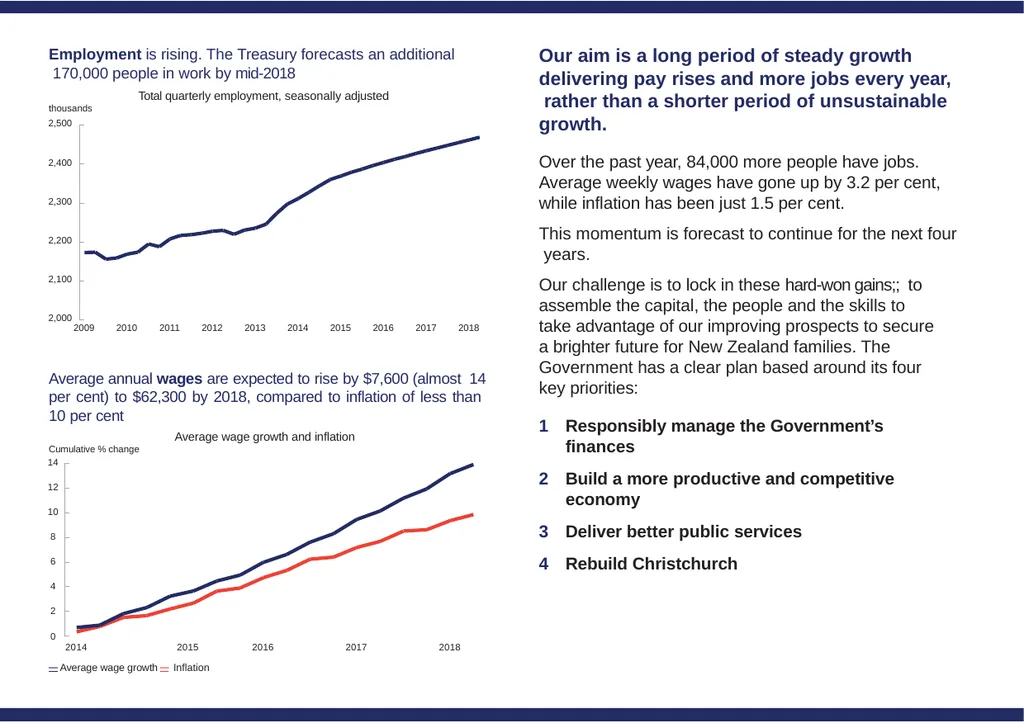
slide3. Average annual wages are expected to rise by $7,600 (almost 14 per cent) to $62,300 by 2018, compared to inflation of less than 10 per cent
Average wage growth and inflation
Cumulative % change Employment is rising. The Treasury forecasts an additional 170,000 people in work by mid-2018
Total quarterly employment, seasonally adjusted
thousands 2,000 2,100 2,200 2,300 2,400 2,500 2018 2017 2016 2015 2014 2013 2012 2011 2010 2009 Our aim is a long period of steady growth delivering pay rises and more jobs every year, rather than a shorter period of unsustainable growth.
Over the past year, 84,000 more people have jobs. Average weekly wages have gone up by 3.2 per cent, while inflation has been just 1.5 per cent.
This momentum is forecast to continue for the next four years.
Our challenge is to lock in these hard-won gains;; to assemble the capital, the people and the skills to
take advantage of our improving prospects to secure a brighter future for New Zealand families. The Government has a clear plan based around its four key priorities: Responsibly manage the Government’s
finances
Build a more productive and competitive economy
Deliver better public services
Rebuild Christchurch 4
2
0 6 8 10 12 14 2018 2017 2016 2014 2015
— Average wage growth — Inflation<br>
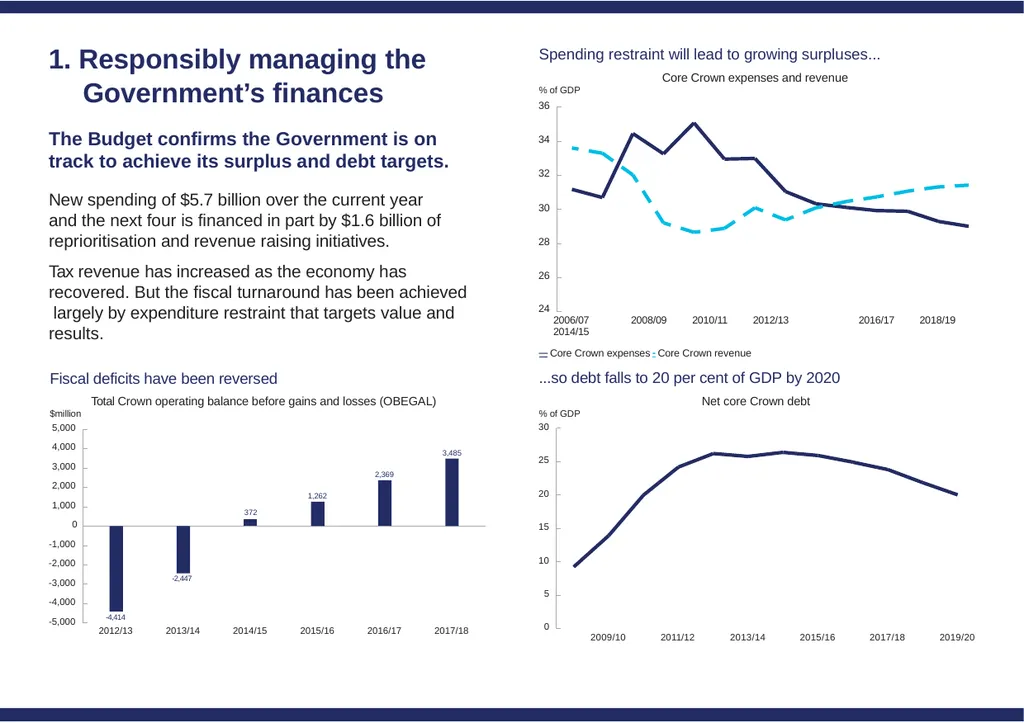
slide4. Fiscal deficits have been reversed
Total Crown operating balance before gains and losses (OBEGAL)
$million ...so debt falls to 20 per cent of GDP by 2020
Net core Crown debt
% of GDP Spending restraint will lead to growing surpluses...
Core Crown expenses and revenue
% of GDP 26 28 30 32 34 36 2018/19 2016/17 24
2006/07 2008/09 2010/11 2012/13 2014/15
— Core Crown expenses - - Core Crown revenue 1. Responsibly managing the Government’s finances The Budget confirms the Government is on track to achieve its surplus and debt targets.
New spending of $5.7 billion over the current year and the next four is financed in part by $1.6 billion of reprioritisation and revenue raising initiatives.
Tax revenue has increased as the economy has recovered. But the fiscal turnaround has been achieved largely by expenditure restraint that targets value and results. 0 5 10 15 20 25 30 2019/20 2017/18 2015/16 2013/14 2011/12 2009/10 5,000
4,000
3,000
2,000
1,000
0
-1,000
-2,000
-3,000
-4,000
-5,000 2017/18 2016/17 2015/16 2014/15 2013/14 -4,414
2012/13 -2,447 372 1,262 2,369 3,485<br>
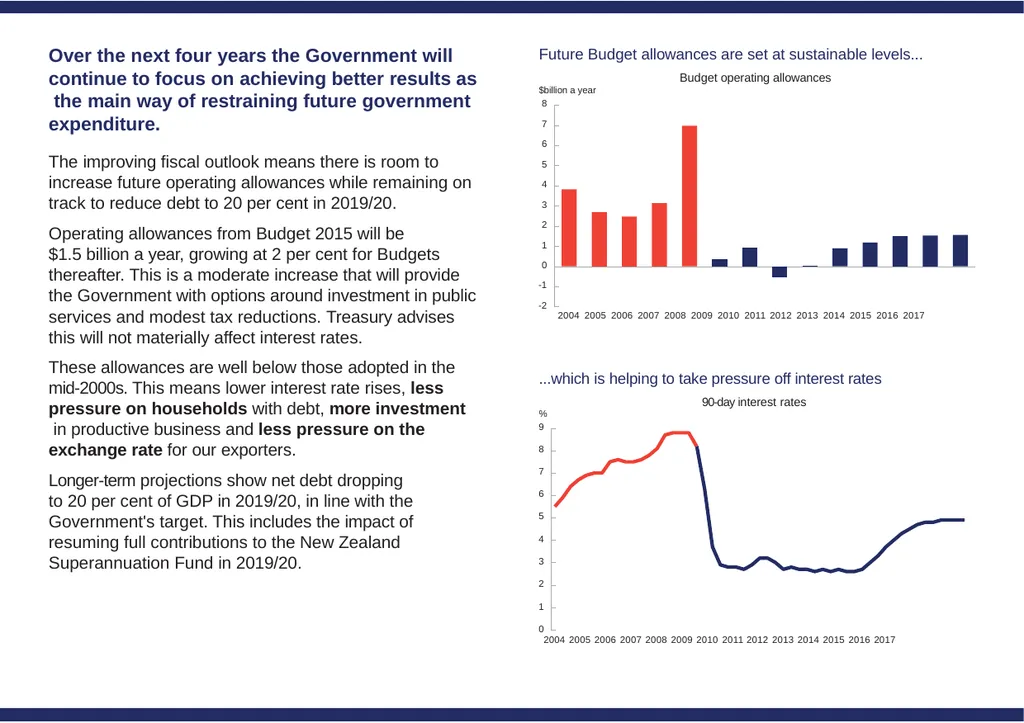
slide5. ...which is helping to take pressure off interest rates
90-day interest rates 2
1
0
2004 2005 2006 2007 2008 2009 2010 2011 2012 2013 2014 2015 2016 2017 3 4 5 6 7 8 %
9 Over the next four years the Government will continue to focus on achieving better results as the main way of restraining future government expenditure.
The improving fiscal outlook means there is room to increase future operating allowances while remaining on track to reduce debt to 20 per cent in 2019/20.
Operating allowances from Budget 2015 will be
$1.5 billion a year, growing at 2 per cent for Budgets thereafter. This is a moderate increase that will provide the Government with options around investment in public services and modest tax reductions. Treasury advises this will not materially affect interest rates.
These allowances are well below those adopted in the mid-2000s. This means lower interest rate rises, less pressure on households with debt, more investment in productive business and less pressure on the exchange rate for our exporters.
Longer-term projections show net debt dropping to 20 per cent of GDP in 2019/20, in line with the Government's target. This includes the impact of resuming full contributions to the New Zealand Superannuation Fund in 2019/20. Future Budget allowances are set at sustainable levels...
Budget operating allowances
$billion a year 8
7
6
5
4
3
2
1
0
-1
-2 2004 2005 2006 2007 2008 2009 2010 2011 2012 2013 2014 2015 2016 2017<br>
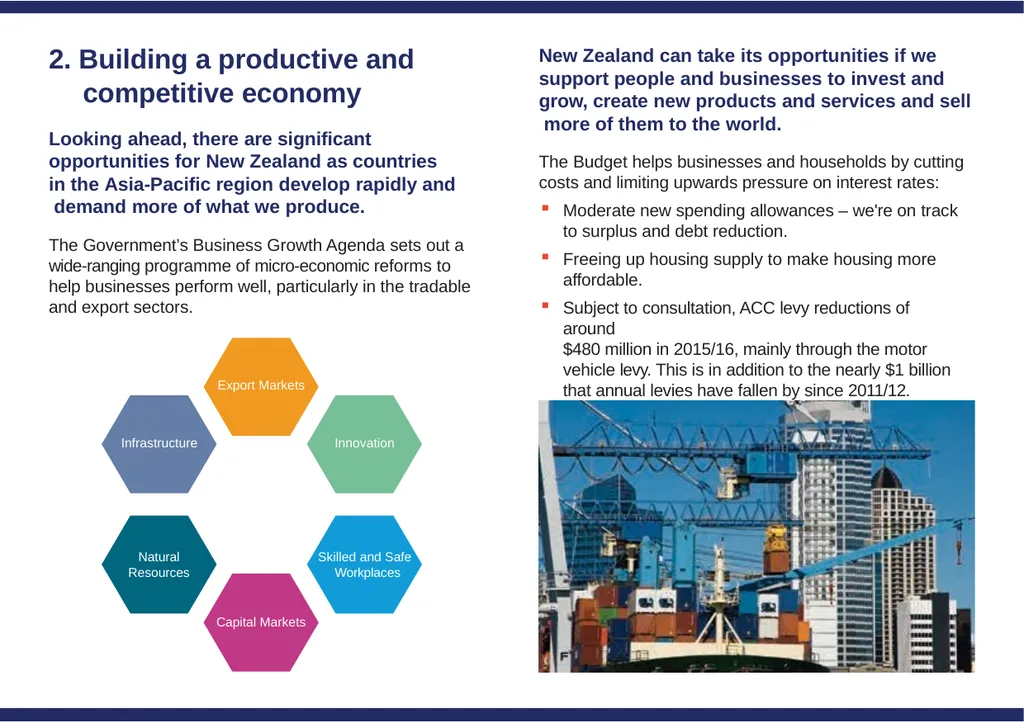
slide6. 2. Building a productive and
competitive economy Looking ahead, there are significant opportunities for New Zealand as countries in the Asia-Pacific region develop rapidly and demand more of what we produce.
The Government’s Business Growth Agenda sets out a wide-ranging programme of micro-economic reforms to help businesses perform well, particularly in the tradable and export sectors. New Zealand can take its opportunities if we support people and businesses to invest and grow, create new products and services and sell more of them to the world.
The Budget helps businesses and households by cutting costs and limiting upwards pressure on interest rates: Moderate new spending allowances – we're on track to surplus and debt reduction.
Freeing up housing supply to make housing more affordable.
Subject to consultation, ACC levy reductions of around
$480 million in 2015/16, mainly through the motor vehicle levy. This is in addition to the nearly $1 billion that annual levies have fallen by since 2011/12. Export Markets Innovation Skilled and Safe Workplaces Capital Markets Natural Resources Infrastructure<br>
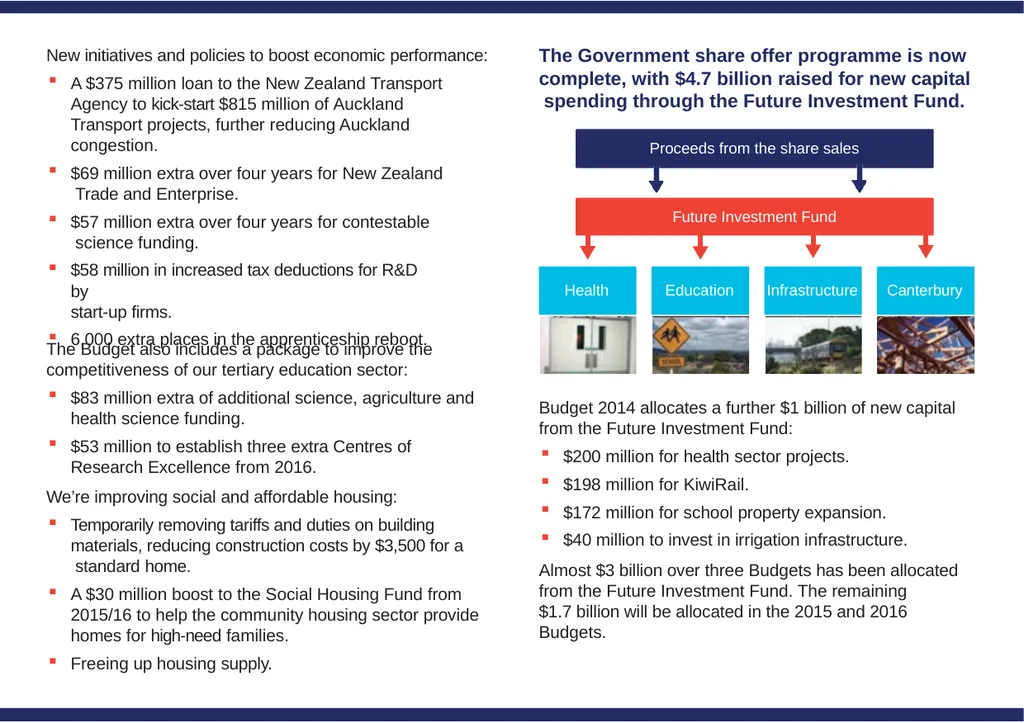
slide7. The Government share offer programme is now complete, with $4.7 billion raised for new capital spending through the Future Investment Fund. Budget 2014 allocates a further $1 billion of new capital from the Future Investment Fund: $200 million for health sector projects.
$198 million for KiwiRail.
$172 million for school property expansion.
$40 million to invest in irrigation infrastructure. Almost $3 billion over three Budgets has been allocated from the Future Investment Fund. The remaining
$1.7 billion will be allocated in the 2015 and 2016 Budgets. Proceeds from the share sales Future Investment Fund Education Health Infrastructure Canterbury New initiatives and policies to boost economic performance: A $375 million loan to the New Zealand Transport Agency to kick-start $815 million of Auckland Transport projects, further reducing Auckland congestion.
$69 million extra over four years for New Zealand Trade and Enterprise.
$57 million extra over four years for contestable science funding.
$58 million in increased tax deductions for R&D by
start-up firms.
6,000 extra places in the apprenticeship reboot. The Budget also includes a package to improve the competitiveness of our tertiary education sector: $83 million extra of additional science, agriculture and health science funding.
$53 million to establish three extra Centres of Research Excellence from 2016.
We’re improving social and affordable housing:
Temporarily removing tariffs and duties on building materials, reducing construction costs by $3,500 for a standard home.
A $30 million boost to the Social Housing Fund from 2015/16 to help the community housing sector provide homes for high-need families.
Freeing up housing supply.<br>
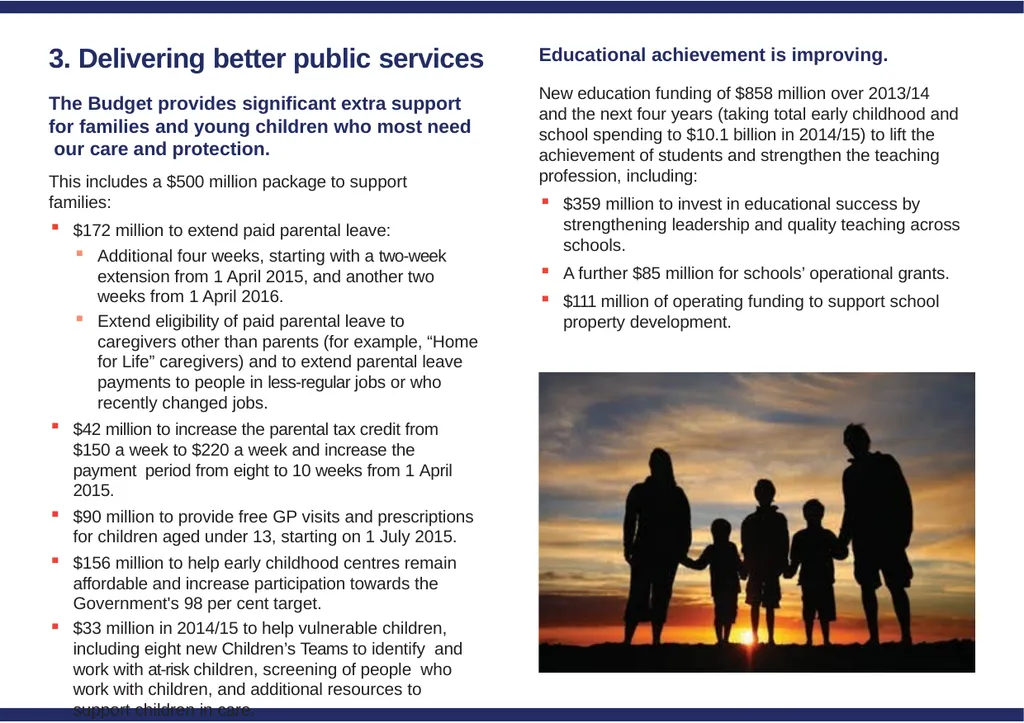
slide8. 3. Delivering better public services The Budget provides significant extra support for families and young children who most need our care and protection.
This includes a $500 million package to support families:
$172 million to extend paid parental leave:
Additional four weeks, starting with a two-week extension from 1 April 2015, and another two weeks from 1 April 2016.
Extend eligibility of paid parental leave to caregivers other than parents (for example, “Home for Life” caregivers) and to extend parental leave payments to people in less-regular jobs or who recently changed jobs.
$42 million to increase the parental tax credit from
$150 a week to $220 a week and increase the payment period from eight to 10 weeks from 1 April 2015.
$90 million to provide free GP visits and prescriptions for children aged under 13, starting on 1 July 2015.
$156 million to help early childhood centres remain affordable and increase participation towards the Government's 98 per cent target.
$33 million in 2014/15 to help vulnerable children, including eight new Children’s Teams to identify and work with at-risk children, screening of people who work with children, and additional resources to support children in care. Educational achievement is improving.
New education funding of $858 million over 2013/14 and the next four years (taking total early childhood and school spending to $10.1 billion in 2014/15) to lift the achievement of students and strengthen the teaching profession, including:
$359 million to invest in educational success by strengthening leadership and quality teaching across schools.
A further $85 million for schools’ operational grants.
$111 million of operating funding to support school property development.<br>
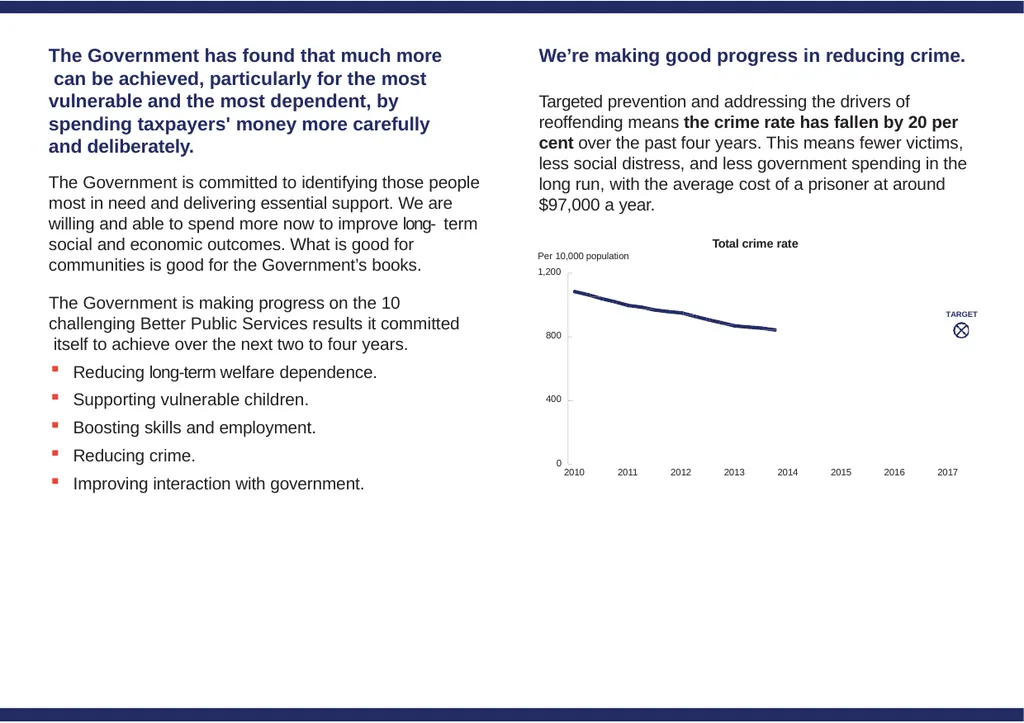
slide9. We’re making good progress in reducing crime. Targeted prevention and addressing the drivers of reoffending means the crime rate has fallen by 20 per cent over the past four years. This means fewer victims, less social distress, and less government spending in the long run, with the average cost of a prisoner at around
$97,000 a year. The Government has found that much more can be achieved, particularly for the most vulnerable and the most dependent, by spending taxpayers' money more carefully and deliberately.
The Government is committed to identifying those people most in need and delivering essential support. We are willing and able to spend more now to improve long- term social and economic outcomes. What is good for communities is good for the Government’s books. The Government is making progress on the 10 challenging Better Public Services results it committed itself to achieve over the next two to four years.
Reducing long-term welfare dependence.
Supporting vulnerable children.
Boosting skills and employment.
Reducing crime.
Improving interaction with government. Total crime rate 0 400 800 Per 10,000 population
1,200 2017 2016 2015 2014 2013 2012 2011 2010 TARGET<br>
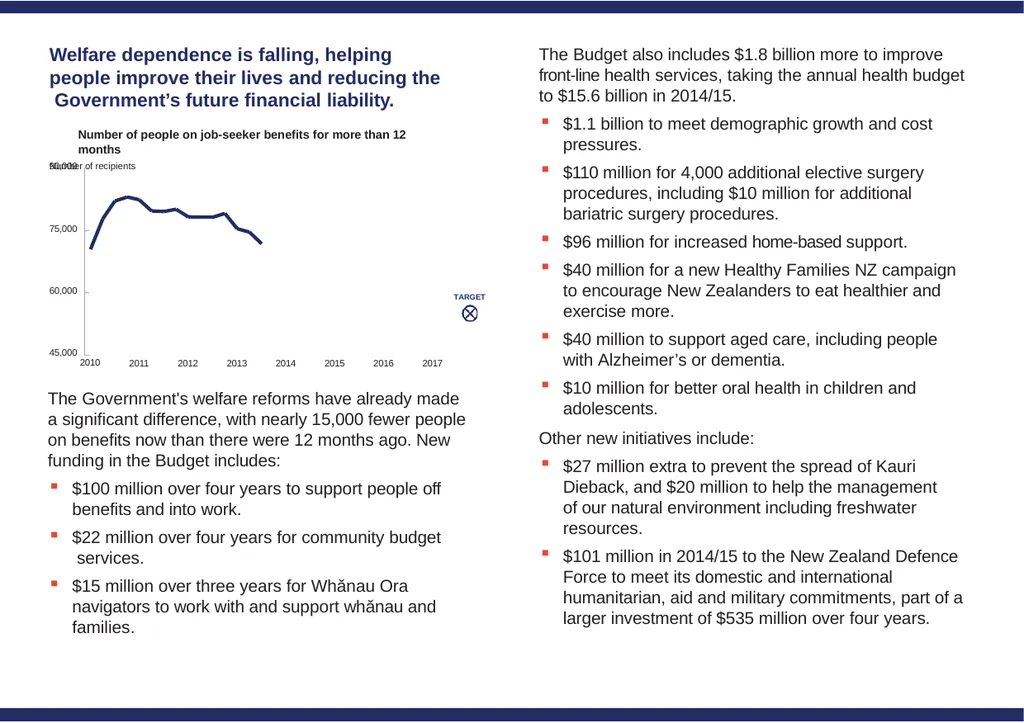
slide10. Welfare dependence is falling, helping people improve their lives and reducing the Government’s future financial liability.
Number of people on job-seeker benefits for more than 12 months
Number of recipients 60,000 75,000 90,000 2017 2016 2015 2014 2013 2012 2011 45,000
2010 TARGET The Budget also includes $1.8 billion more to improve front-line health services, taking the annual health budget to $15.6 billion in 2014/15. $1.1 billion to meet demographic growth and cost pressures.
$110 million for 4,000 additional elective surgery procedures, including $10 million for additional bariatric surgery procedures.
$96 million for increased home-based support.
$40 million for a new Healthy Families NZ campaign to encourage New Zealanders to eat healthier and exercise more.
$40 million to support aged care, including people with Alzheimer’s or dementia.
$10 million for better oral health in children and adolescents. Other new initiatives include: $27 million extra to prevent the spread of Kauri Dieback, and $20 million to help the management of our natural environment including freshwater resources.
$101 million in 2014/15 to the New Zealand Defence Force to meet its domestic and international humanitarian, aid and military commitments, part of a larger investment of $535 million over four years. The Government's welfare reforms have already made a significant difference, with nearly 15,000 fewer people on benefits now than there were 12 months ago. New funding in the Budget includes:
$100 million over four years to support people off
benefits and into work.
$22 million over four years for community budget services.
$15 million over three years for Whǎnau Ora navigators to work with and support whǎnau and families.<br>
slide11. 4. Rebuilding Christchurch Since the first earthquake in September 2010, the Government has backed Cantabrians in the initial response, and now in the recovery and the rebuild.
The total cost of the rebuild has been estimated at
$40 billion and the Government's share will be significant.
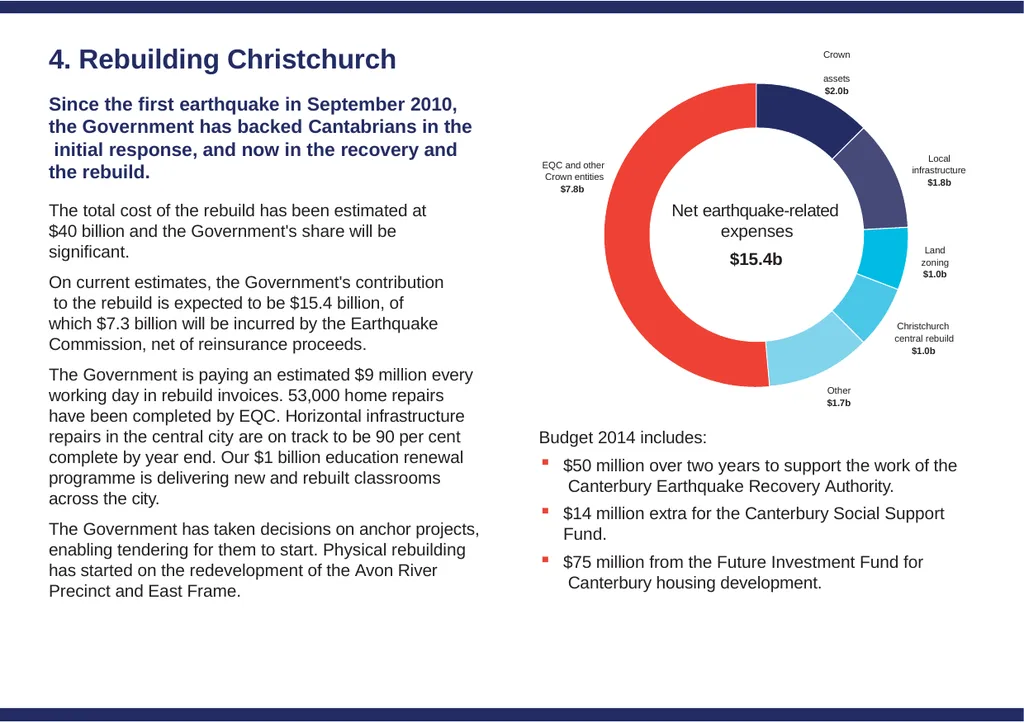
On current estimates, the Government's contribution to the rebuild is expected to be $15.4 billion, of which $7.3 billion will be incurred by the Earthquake Commission, net of reinsurance proceeds.
The Government is paying an estimated $9 million every working day in rebuild invoices. 53,000 home repairs have been completed by EQC. Horizontal infrastructure repairs in the central city are on track to be 90 per cent complete by year end. Our $1 billion education renewal programme is delivering new and rebuilt classrooms across the city.
The Government has taken decisions on anchor projects, enabling tendering for them to start. Physical rebuilding has started on the redevelopment of the Avon River Precinct and East Frame. Budget 2014 includes:
$50 million over two years to support the work of the Canterbury Earthquake Recovery Authority.
$14 million extra for the Canterbury Social Support Fund.
$75 million from the Future Investment Fund for Canterbury housing development. Local infrastructure
$1.8b Land zoning
$1.0b EQC and other Crown entities
$7.8b Christchurch central rebuild
$1.0b
Other
$1.7b Crown assets
$2.0b Net earthquake-related expenses
$15.4b<br>
slide12. New operating spending, savings and revenue in Budget 2014 Expenses in Budget 2014 Social security and welfare, health and education costs will make up over two-thirds of core Crown expenses in 2014/15. Health
$15.1b Law and order
$3.5b Finance costs
$3.9b Education
$12.8b Other
$6.8b
Transport and communications
$2.2b Core government services
$4.8b Social security and welfare
$24.0b Core Crown expenses, 2014/15
$73.1b<br>
slide13. Who pays income tax, and how much Revenue in Budget 2014 Individual, corporate and goods and services tax will make up over three-quarters of core Crown tax revenue in 2014/15. Revenue can be volatile compared to forecasts, and is highly dependent on nominal GDP growth
Core Crown tax revenue
$billion 70
65
60 75 90
85
80 2017/18 2013/14 2014/15 2015/16 2016/17
— Budget 14 forecast - - 1% lower growth rate - - 1% higher growth rate GST
$17.8b $2.5b Other direct taxes
$3.6b Interest revenue Other and dividends $2.4b Corporate tax
$10.4b Other indirect taxes
$6.0b Individuals tax
$29.8b Core Crown revenue, 2014/15
$72.5b<br>
slide14. Forecast Crown liabilities $billion Financial ■ Commercial ■ Social 0 50 100 150 200 250 300 2018 2017 2016 2015 2013 (actual) 2014 Forecast Crown assets $billion Financial ■ Commercial ■ Social 0 50 100 150 200 250 300 2018 2017 2016 2015 2013 (actual) 2014 The Crown’s assets and liabilities In 2013/14, the value of the Crown’s assets is expected to be $246 billion. By 2017/18, total assets will have grown to $282 billion.
Significant growth in financial assets is forecast. The social portfolio is the single biggest component of the Crown’s assets. Social assets are used to deliver public services, such as state highways, social housing, schools and hospitals. The Crown’s total liabilities in 2013/14 are expected to be $174 billion. These are forecast to grow to $187 billion in 2017/18. Most of the Crown’s liabilities are in the financial portfolio, which is largely composed of Crown borrowing and long- term liabilities.<br>
slide15. Guide to the Budget Documents A number of documents are released on Budget day. The purpose of these documents is to provide information about the wider fiscal and economic picture and the Government’s spending intentions for the year ahead. The Budget documents are as follows:
Executive Summary
The Executive Summary is the overview of all the Budget information and contains the main points for the media and public. This summarises the Government’s spending decisions and key issues raised in the Budget Speech, the Fiscal Strategy Report, and the Budget Economic and Fiscal Update.
Budget Speech
The Budget Speech is the Minister of Finance’s speech delivering the Budget Statement at the start of Parliament’s Budget debate. The Budget Statement generally focuses on the overall fiscal and economic position, the Government’s policy priorities and how those priorities will be funded.
Fiscal Strategy Report
The Fiscal Strategy Report sets out the Government’s fiscal strategy in areas such as the balance between operating revenues and expenses, and its debt objectives. The report includes fiscal trends covering at least the next 10 years and the Government’s long term fiscal objectives.
The Government must explain changes in, and/or inconsistencies between, the Fiscal Strategy Report, the Budget Policy Statement and the previous year’s Fiscal Strategy Report.
Budget Economic and Fiscal Update
The Update includes Treasury’s overall economic forecasts and the forecast financial statements of the Government, along with the implications of Government financial decisions and other information relevant to the fiscal and economic position.
The Estimates of Appropriations
The Estimates outlines for the financial year about to start (the Budget year) expenses and capital expenditure the Government plans to incur on specified areas within each Vote, and capital injections it plans to make to individual departments. The Estimates is organised on the basis of 10 sector volumes, with each Vote allocated to one sector. Supporting information in the Estimates summarises the new policy initiatives and trend information for each Vote and provides information on what is intended to be achieved with each appropriation in a Vote and how performance against each appropriation will be assessed and reported on after the end of the Budget year.
The Supplementary Estimates of Appropriations and Supporting Information
The Supplementary Estimates outlines the additional expenses and capital expenditure required for the financial year about to end. The Supporting Information provides reasons for the changes to appropriations during the year, related changes in performance information and certain additional performance information for new appropriations.
NZ Budget App
Smartphone and tablet users can also access the Budget documents through the
NZ Budget App. The App is available on the Apple Store for iOS devices and the Google Play store for Android devices or see www.treasury.govt.nz/budget/app Websites
These documents are available at www.treasury.govt.nz and www.budget.govt.nz
© Crown Copyright
This work is licensed under the Creative Commons Attribution 3.0 New Zealand licence. In essence, you are free to copy, distribute and adapt the work, as long as you attribute the work to the Crown and abide by the other licence terms.
To view a copy of this licence, visit http://creativecommons.org/licenses/by/3.0/nz/. Please note that no departmental
or governmental emblem, logo or Coat of Arms may be used in any way which infringes any provision of the Flags, Emblems, and Names Protection Act 1981. Attribution to the Crown should be in written form and not by reproduction of any such emblem, logo or Coat of Arms.<br>
Hon Bill English, Minister of Finance
15 May 2014 ISBN: 978-0-478-42175-0 (Online) 978-0-478-42174-3 (Print), PURL: http://purl.oclc.org/nzt/b-1656, Treasury URL: www.treasury.govt.nz/budget/2014/execsumm<br>
slide2. The economy continues to grow Budget 2014 looks ahead to build on the hard work done by New Zealand
households and businesses over the past
five years. GDP is forecast to grow between 2 and 4 per cent...
Real production GDP (annual average % change)
% 0
-1
-2
-3 1 2 3 4 5 2018 2017 2016 2015 2014 2013 2012 2011 2010 2009 2013 -0.5 ...faster than many of our trading partners
Real production GDP (annual average % change)
%
4.0
3.5
3.0
2.5
2.0
1.5
1.0
0.5
0.0 Euro Japan Canada UK US NZ Australia
■ 2014 ■ 2015<br>
slide3. Average annual wages are expected to rise by $7,600 (almost 14 per cent) to $62,300 by 2018, compared to inflation of less than 10 per cent
Average wage growth and inflation
Cumulative % change Employment is rising. The Treasury forecasts an additional 170,000 people in work by mid-2018
Total quarterly employment, seasonally adjusted
thousands 2,000 2,100 2,200 2,300 2,400 2,500 2018 2017 2016 2015 2014 2013 2012 2011 2010 2009 Our aim is a long period of steady growth delivering pay rises and more jobs every year, rather than a shorter period of unsustainable growth.
Over the past year, 84,000 more people have jobs. Average weekly wages have gone up by 3.2 per cent, while inflation has been just 1.5 per cent.
This momentum is forecast to continue for the next four years.
Our challenge is to lock in these hard-won gains;; to assemble the capital, the people and the skills to
take advantage of our improving prospects to secure a brighter future for New Zealand families. The Government has a clear plan based around its four key priorities: Responsibly manage the Government’s
finances
Build a more productive and competitive economy
Deliver better public services
Rebuild Christchurch 4
2
0 6 8 10 12 14 2018 2017 2016 2014 2015
— Average wage growth — Inflation<br>
slide4. Fiscal deficits have been reversed
Total Crown operating balance before gains and losses (OBEGAL)
$million ...so debt falls to 20 per cent of GDP by 2020
Net core Crown debt
% of GDP Spending restraint will lead to growing surpluses...
Core Crown expenses and revenue
% of GDP 26 28 30 32 34 36 2018/19 2016/17 24
2006/07 2008/09 2010/11 2012/13 2014/15
— Core Crown expenses - - Core Crown revenue 1. Responsibly managing the Government’s finances The Budget confirms the Government is on track to achieve its surplus and debt targets.
New spending of $5.7 billion over the current year and the next four is financed in part by $1.6 billion of reprioritisation and revenue raising initiatives.
Tax revenue has increased as the economy has recovered. But the fiscal turnaround has been achieved largely by expenditure restraint that targets value and results. 0 5 10 15 20 25 30 2019/20 2017/18 2015/16 2013/14 2011/12 2009/10 5,000
4,000
3,000
2,000
1,000
0
-1,000
-2,000
-3,000
-4,000
-5,000 2017/18 2016/17 2015/16 2014/15 2013/14 -4,414
2012/13 -2,447 372 1,262 2,369 3,485<br>
slide5. ...which is helping to take pressure off interest rates
90-day interest rates 2
1
0
2004 2005 2006 2007 2008 2009 2010 2011 2012 2013 2014 2015 2016 2017 3 4 5 6 7 8 %
9 Over the next four years the Government will continue to focus on achieving better results as the main way of restraining future government expenditure.
The improving fiscal outlook means there is room to increase future operating allowances while remaining on track to reduce debt to 20 per cent in 2019/20.
Operating allowances from Budget 2015 will be
$1.5 billion a year, growing at 2 per cent for Budgets thereafter. This is a moderate increase that will provide the Government with options around investment in public services and modest tax reductions. Treasury advises this will not materially affect interest rates.
These allowances are well below those adopted in the mid-2000s. This means lower interest rate rises, less pressure on households with debt, more investment in productive business and less pressure on the exchange rate for our exporters.
Longer-term projections show net debt dropping to 20 per cent of GDP in 2019/20, in line with the Government's target. This includes the impact of resuming full contributions to the New Zealand Superannuation Fund in 2019/20. Future Budget allowances are set at sustainable levels...
Budget operating allowances
$billion a year 8
7
6
5
4
3
2
1
0
-1
-2 2004 2005 2006 2007 2008 2009 2010 2011 2012 2013 2014 2015 2016 2017<br>
slide6. 2. Building a productive and
competitive economy Looking ahead, there are significant opportunities for New Zealand as countries in the Asia-Pacific region develop rapidly and demand more of what we produce.
The Government’s Business Growth Agenda sets out a wide-ranging programme of micro-economic reforms to help businesses perform well, particularly in the tradable and export sectors. New Zealand can take its opportunities if we support people and businesses to invest and grow, create new products and services and sell more of them to the world.
The Budget helps businesses and households by cutting costs and limiting upwards pressure on interest rates: Moderate new spending allowances – we're on track to surplus and debt reduction.
Freeing up housing supply to make housing more affordable.
Subject to consultation, ACC levy reductions of around
$480 million in 2015/16, mainly through the motor vehicle levy. This is in addition to the nearly $1 billion that annual levies have fallen by since 2011/12. Export Markets Innovation Skilled and Safe Workplaces Capital Markets Natural Resources Infrastructure<br>
slide7. The Government share offer programme is now complete, with $4.7 billion raised for new capital spending through the Future Investment Fund. Budget 2014 allocates a further $1 billion of new capital from the Future Investment Fund: $200 million for health sector projects.
$198 million for KiwiRail.
$172 million for school property expansion.
$40 million to invest in irrigation infrastructure. Almost $3 billion over three Budgets has been allocated from the Future Investment Fund. The remaining
$1.7 billion will be allocated in the 2015 and 2016 Budgets. Proceeds from the share sales Future Investment Fund Education Health Infrastructure Canterbury New initiatives and policies to boost economic performance: A $375 million loan to the New Zealand Transport Agency to kick-start $815 million of Auckland Transport projects, further reducing Auckland congestion.
$69 million extra over four years for New Zealand Trade and Enterprise.
$57 million extra over four years for contestable science funding.
$58 million in increased tax deductions for R&D by
start-up firms.
6,000 extra places in the apprenticeship reboot. The Budget also includes a package to improve the competitiveness of our tertiary education sector: $83 million extra of additional science, agriculture and health science funding.
$53 million to establish three extra Centres of Research Excellence from 2016.
We’re improving social and affordable housing:
Temporarily removing tariffs and duties on building materials, reducing construction costs by $3,500 for a standard home.
A $30 million boost to the Social Housing Fund from 2015/16 to help the community housing sector provide homes for high-need families.
Freeing up housing supply.<br>
slide8. 3. Delivering better public services The Budget provides significant extra support for families and young children who most need our care and protection.
This includes a $500 million package to support families:
$172 million to extend paid parental leave:
Additional four weeks, starting with a two-week extension from 1 April 2015, and another two weeks from 1 April 2016.
Extend eligibility of paid parental leave to caregivers other than parents (for example, “Home for Life” caregivers) and to extend parental leave payments to people in less-regular jobs or who recently changed jobs.
$42 million to increase the parental tax credit from
$150 a week to $220 a week and increase the payment period from eight to 10 weeks from 1 April 2015.
$90 million to provide free GP visits and prescriptions for children aged under 13, starting on 1 July 2015.
$156 million to help early childhood centres remain affordable and increase participation towards the Government's 98 per cent target.
$33 million in 2014/15 to help vulnerable children, including eight new Children’s Teams to identify and work with at-risk children, screening of people who work with children, and additional resources to support children in care. Educational achievement is improving.
New education funding of $858 million over 2013/14 and the next four years (taking total early childhood and school spending to $10.1 billion in 2014/15) to lift the achievement of students and strengthen the teaching profession, including:
$359 million to invest in educational success by strengthening leadership and quality teaching across schools.
A further $85 million for schools’ operational grants.
$111 million of operating funding to support school property development.<br>
slide9. We’re making good progress in reducing crime. Targeted prevention and addressing the drivers of reoffending means the crime rate has fallen by 20 per cent over the past four years. This means fewer victims, less social distress, and less government spending in the long run, with the average cost of a prisoner at around
$97,000 a year. The Government has found that much more can be achieved, particularly for the most vulnerable and the most dependent, by spending taxpayers' money more carefully and deliberately.
The Government is committed to identifying those people most in need and delivering essential support. We are willing and able to spend more now to improve long- term social and economic outcomes. What is good for communities is good for the Government’s books. The Government is making progress on the 10 challenging Better Public Services results it committed itself to achieve over the next two to four years.
Reducing long-term welfare dependence.
Supporting vulnerable children.
Boosting skills and employment.
Reducing crime.
Improving interaction with government. Total crime rate 0 400 800 Per 10,000 population
1,200 2017 2016 2015 2014 2013 2012 2011 2010 TARGET<br>
slide10. Welfare dependence is falling, helping people improve their lives and reducing the Government’s future financial liability.
Number of people on job-seeker benefits for more than 12 months
Number of recipients 60,000 75,000 90,000 2017 2016 2015 2014 2013 2012 2011 45,000
2010 TARGET The Budget also includes $1.8 billion more to improve front-line health services, taking the annual health budget to $15.6 billion in 2014/15. $1.1 billion to meet demographic growth and cost pressures.
$110 million for 4,000 additional elective surgery procedures, including $10 million for additional bariatric surgery procedures.
$96 million for increased home-based support.
$40 million for a new Healthy Families NZ campaign to encourage New Zealanders to eat healthier and exercise more.
$40 million to support aged care, including people with Alzheimer’s or dementia.
$10 million for better oral health in children and adolescents. Other new initiatives include: $27 million extra to prevent the spread of Kauri Dieback, and $20 million to help the management of our natural environment including freshwater resources.
$101 million in 2014/15 to the New Zealand Defence Force to meet its domestic and international humanitarian, aid and military commitments, part of a larger investment of $535 million over four years. The Government's welfare reforms have already made a significant difference, with nearly 15,000 fewer people on benefits now than there were 12 months ago. New funding in the Budget includes:
$100 million over four years to support people off
benefits and into work.
$22 million over four years for community budget services.
$15 million over three years for Whǎnau Ora navigators to work with and support whǎnau and families.<br>
slide11. 4. Rebuilding Christchurch Since the first earthquake in September 2010, the Government has backed Cantabrians in the initial response, and now in the recovery and the rebuild.
The total cost of the rebuild has been estimated at
$40 billion and the Government's share will be significant.
On current estimates, the Government's contribution to the rebuild is expected to be $15.4 billion, of which $7.3 billion will be incurred by the Earthquake Commission, net of reinsurance proceeds.
The Government is paying an estimated $9 million every working day in rebuild invoices. 53,000 home repairs have been completed by EQC. Horizontal infrastructure repairs in the central city are on track to be 90 per cent complete by year end. Our $1 billion education renewal programme is delivering new and rebuilt classrooms across the city.
The Government has taken decisions on anchor projects, enabling tendering for them to start. Physical rebuilding has started on the redevelopment of the Avon River Precinct and East Frame. Budget 2014 includes:
$50 million over two years to support the work of the Canterbury Earthquake Recovery Authority.
$14 million extra for the Canterbury Social Support Fund.
$75 million from the Future Investment Fund for Canterbury housing development. Local infrastructure
$1.8b Land zoning
$1.0b EQC and other Crown entities
$7.8b Christchurch central rebuild
$1.0b
Other
$1.7b Crown assets
$2.0b Net earthquake-related expenses
$15.4b<br>
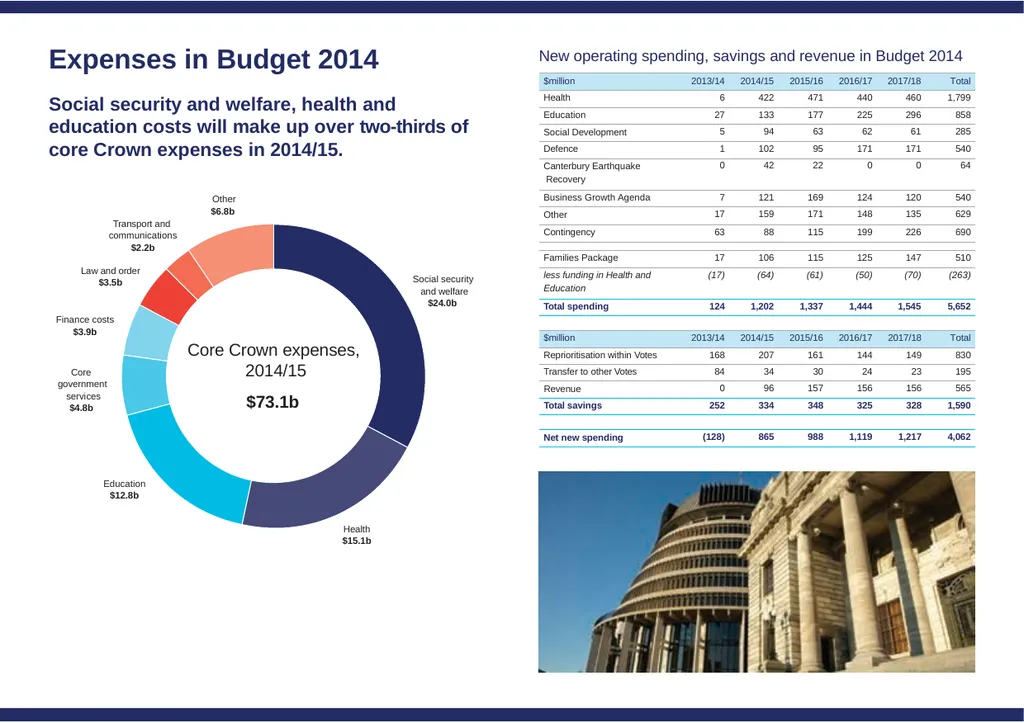
slide12. New operating spending, savings and revenue in Budget 2014 Expenses in Budget 2014 Social security and welfare, health and education costs will make up over two-thirds of core Crown expenses in 2014/15. Health
$15.1b Law and order
$3.5b Finance costs
$3.9b Education
$12.8b Other
$6.8b
Transport and communications
$2.2b Core government services
$4.8b Social security and welfare
$24.0b Core Crown expenses, 2014/15
$73.1b<br>
slide13. Who pays income tax, and how much Revenue in Budget 2014 Individual, corporate and goods and services tax will make up over three-quarters of core Crown tax revenue in 2014/15. Revenue can be volatile compared to forecasts, and is highly dependent on nominal GDP growth
Core Crown tax revenue
$billion 70
65
60 75 90
85
80 2017/18 2013/14 2014/15 2015/16 2016/17
— Budget 14 forecast - - 1% lower growth rate - - 1% higher growth rate GST
$17.8b $2.5b Other direct taxes
$3.6b Interest revenue Other and dividends $2.4b Corporate tax
$10.4b Other indirect taxes
$6.0b Individuals tax
$29.8b Core Crown revenue, 2014/15
$72.5b<br>
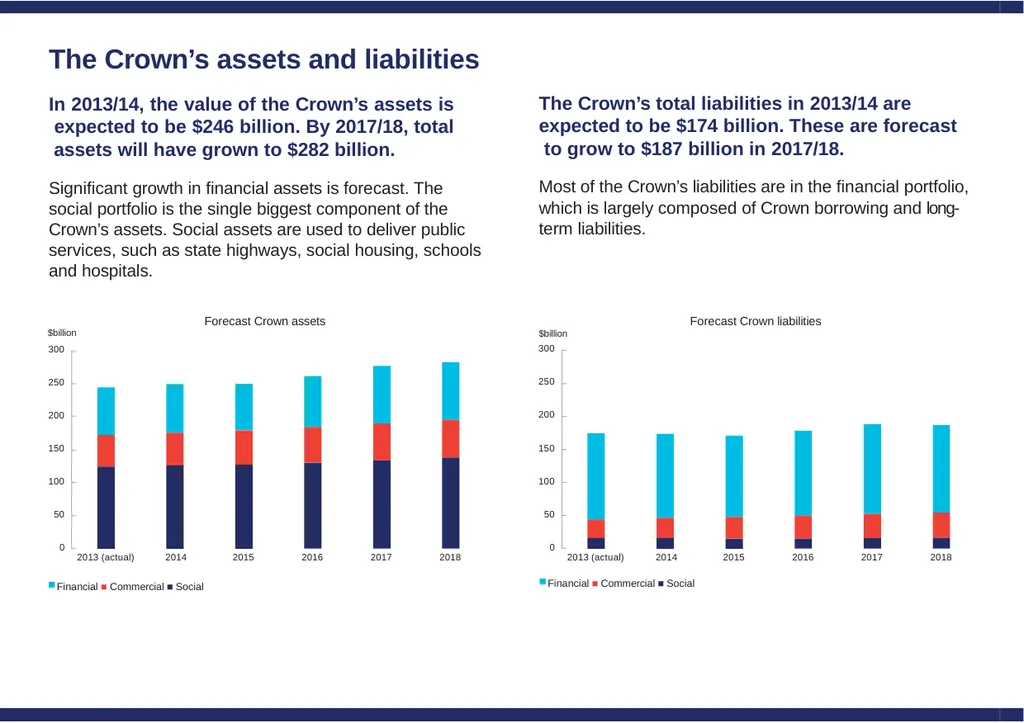
slide14. Forecast Crown liabilities $billion Financial ■ Commercial ■ Social 0 50 100 150 200 250 300 2018 2017 2016 2015 2013 (actual) 2014 Forecast Crown assets $billion Financial ■ Commercial ■ Social 0 50 100 150 200 250 300 2018 2017 2016 2015 2013 (actual) 2014 The Crown’s assets and liabilities In 2013/14, the value of the Crown’s assets is expected to be $246 billion. By 2017/18, total assets will have grown to $282 billion.
Significant growth in financial assets is forecast. The social portfolio is the single biggest component of the Crown’s assets. Social assets are used to deliver public services, such as state highways, social housing, schools and hospitals. The Crown’s total liabilities in 2013/14 are expected to be $174 billion. These are forecast to grow to $187 billion in 2017/18. Most of the Crown’s liabilities are in the financial portfolio, which is largely composed of Crown borrowing and long- term liabilities.<br>
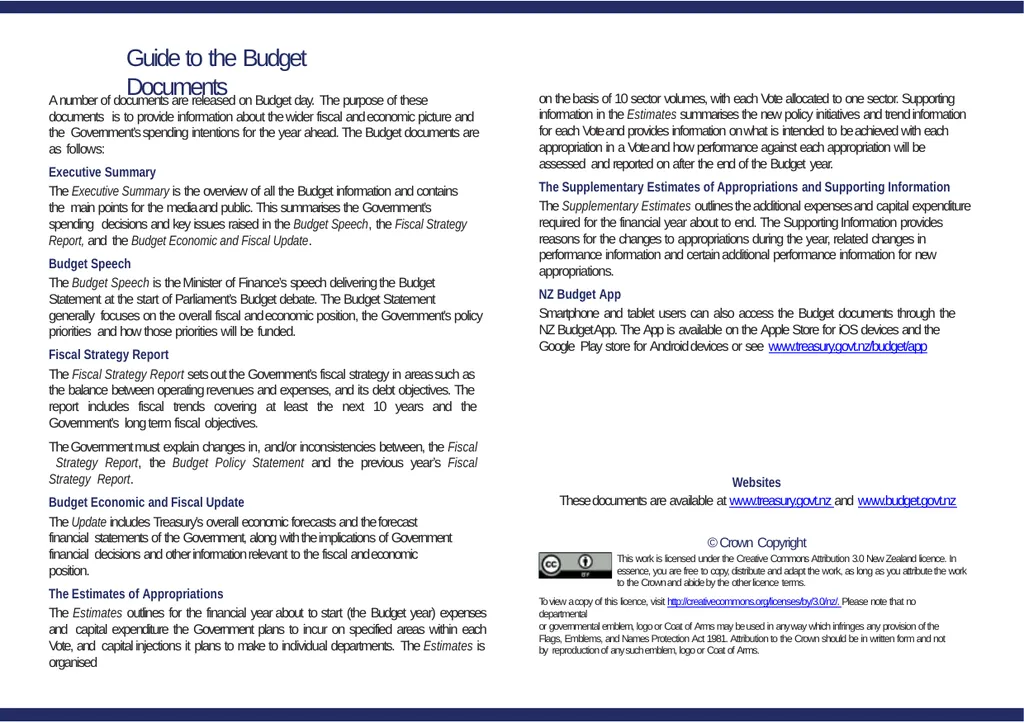
slide15. Guide to the Budget Documents A number of documents are released on Budget day. The purpose of these documents is to provide information about the wider fiscal and economic picture and the Government’s spending intentions for the year ahead. The Budget documents are as follows:
Executive Summary
The Executive Summary is the overview of all the Budget information and contains the main points for the media and public. This summarises the Government’s spending decisions and key issues raised in the Budget Speech, the Fiscal Strategy Report, and the Budget Economic and Fiscal Update.
Budget Speech
The Budget Speech is the Minister of Finance’s speech delivering the Budget Statement at the start of Parliament’s Budget debate. The Budget Statement generally focuses on the overall fiscal and economic position, the Government’s policy priorities and how those priorities will be funded.
Fiscal Strategy Report
The Fiscal Strategy Report sets out the Government’s fiscal strategy in areas such as the balance between operating revenues and expenses, and its debt objectives. The report includes fiscal trends covering at least the next 10 years and the Government’s long term fiscal objectives.
The Government must explain changes in, and/or inconsistencies between, the Fiscal Strategy Report, the Budget Policy Statement and the previous year’s Fiscal Strategy Report.
Budget Economic and Fiscal Update
The Update includes Treasury’s overall economic forecasts and the forecast financial statements of the Government, along with the implications of Government financial decisions and other information relevant to the fiscal and economic position.
The Estimates of Appropriations
The Estimates outlines for the financial year about to start (the Budget year) expenses and capital expenditure the Government plans to incur on specified areas within each Vote, and capital injections it plans to make to individual departments. The Estimates is organised on the basis of 10 sector volumes, with each Vote allocated to one sector. Supporting information in the Estimates summarises the new policy initiatives and trend information for each Vote and provides information on what is intended to be achieved with each appropriation in a Vote and how performance against each appropriation will be assessed and reported on after the end of the Budget year.
The Supplementary Estimates of Appropriations and Supporting Information
The Supplementary Estimates outlines the additional expenses and capital expenditure required for the financial year about to end. The Supporting Information provides reasons for the changes to appropriations during the year, related changes in performance information and certain additional performance information for new appropriations.
NZ Budget App
Smartphone and tablet users can also access the Budget documents through the
NZ Budget App. The App is available on the Apple Store for iOS devices and the Google Play store for Android devices or see www.treasury.govt.nz/budget/app Websites
These documents are available at www.treasury.govt.nz and www.budget.govt.nz
© Crown Copyright
This work is licensed under the Creative Commons Attribution 3.0 New Zealand licence. In essence, you are free to copy, distribute and adapt the work, as long as you attribute the work to the Crown and abide by the other licence terms.
To view a copy of this licence, visit http://creativecommons.org/licenses/by/3.0/nz/. Please note that no departmental
or governmental emblem, logo or Coat of Arms may be used in any way which infringes any provision of the Flags, Emblems, and Names Protection Act 1981. Attribution to the Crown should be in written form and not by reproduction of any such emblem, logo or Coat of Arms.<br>