
Exercise 5.C: Creating a thematic maps using QGIS
OM
Published · 39 slides · 0 views
1 / 1


Description
Exercise 5.C: Creating a thematic maps using QGIS MODULE 5: Creating good thematic maps The objectives of this exercise are to teach participants how to: Apply the lessons learned from Session 5.1 Prepare geospatial data for use in GIS
Related Topics
Download this presentation From Below
"Exercise 5.C: Creating a thematic maps using QGIS" is the property of its rightful owner. Permission is granted to download and print the materials on this website for personal, non-commercial use only, and to display it on your personal computer provided you do not modify the materials and that you retain all copyright notices contained in the materials. By downloading content from our website, you accept the terms of this agreement.
Share
Embed code
Presentation Transcript
01
Exercise 5.C: Creating a thematic maps using QGIS MODULE 5:
Creating good thematic maps<br>
Creating good thematic maps<br>
02
The objectives of this exercise are to teach participants how to:
Apply the lessons learned from Session 5.1
Prepare geospatial data for use in GIS software (QGIS) Objectives Although the modules in the HIS Geo-enabling Course can be taken separately, it is recommended for participants of Module 5 to go through Module 4, particularly Session 4.3 and Exercise 4.B beforehand.
These session and exercise will provide the necessary background and basic skills needed to be able to complete the present exercise. Recommended background sessions The data used in this exercise are fictitious and created only to facilitate the exercises in this course. The different geospatial objects are not related to any real location or infrastructure in the real world. Exercise Data<br>
Apply the lessons learned from Session 5.1
Prepare geospatial data for use in GIS software (QGIS) Objectives Although the modules in the HIS Geo-enabling Course can be taken separately, it is recommended for participants of Module 5 to go through Module 4, particularly Session 4.3 and Exercise 4.B beforehand.
These session and exercise will provide the necessary background and basic skills needed to be able to complete the present exercise. Recommended background sessions The data used in this exercise are fictitious and created only to facilitate the exercises in this course. The different geospatial objects are not related to any real location or infrastructure in the real world. Exercise Data<br>
03
In Exercise 5.A, you prepared the statistical data
In Exercise 5.B, you prepared the geospatial data In Exercise 5.C, you will join the statistical data with the geospatial data to create geographic data which you will represent in your maps. Create thematic maps! Recap<br>
In Exercise 5.B, you prepared the geospatial data In Exercise 5.C, you will join the statistical data with the geospatial data to create geographic data which you will represent in your maps. Create thematic maps! Recap<br>
04
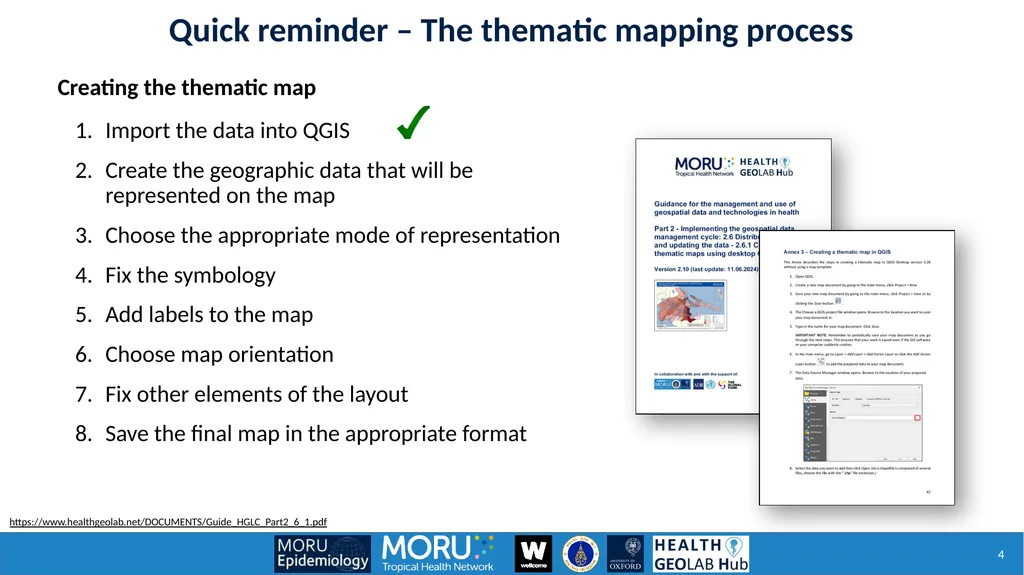
Import the data into QGIS
Create the geographic data that will be represented on the map
Choose the appropriate mode of representation
Fix the symbology
Add labels to the map
Choose map orientation
Fix other elements of the layout
Save the final map in the appropriate format Creating the thematic map https://www.healthgeolab.net/DOCUMENTS/Guide_HGLC_Part2_6_1.pdf Quick reminder – The thematic mapping process<br>
Create the geographic data that will be represented on the map
Choose the appropriate mode of representation
Fix the symbology
Add labels to the map
Choose map orientation
Fix other elements of the layout
Save the final map in the appropriate format Creating the thematic map https://www.healthgeolab.net/DOCUMENTS/Guide_HGLC_Part2_6_1.pdf Quick reminder – The thematic mapping process<br>
05
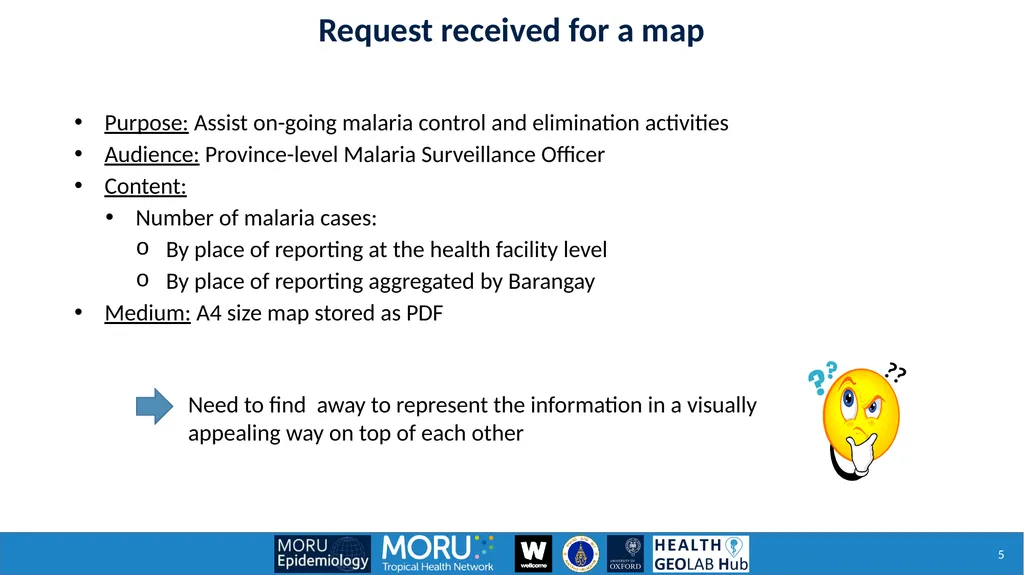
Need to find away to represent the information in a visually appealing way on top of each other Request received for a map Purpose: Assist on-going malaria control and elimination activities
Audience: Province-level Malaria Surveillance Officer
Content:
Number of malaria cases:
By place of reporting at the health facility level
By place of reporting aggregated by Barangay
Medium: A4 size map stored as PDF<br>
Audience: Province-level Malaria Surveillance Officer
Content:
Number of malaria cases:
By place of reporting at the health facility level
By place of reporting aggregated by Barangay
Medium: A4 size map stored as PDF<br>
06
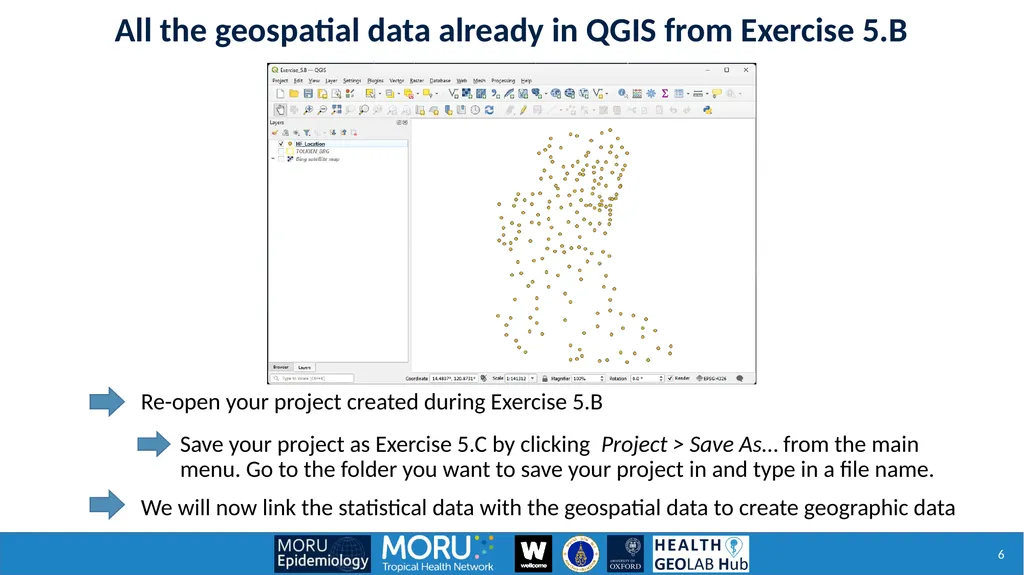
All the geospatial data already in QGIS from Exercise 5.B Re-open your project created during Exercise 5.B We will now link the statistical data with the geospatial data to create geographic data Save your project as Exercise 5.C by clicking Project > Save As… from the main menu. Go to the folder you want to save your project in and type in a file name.<br>
07
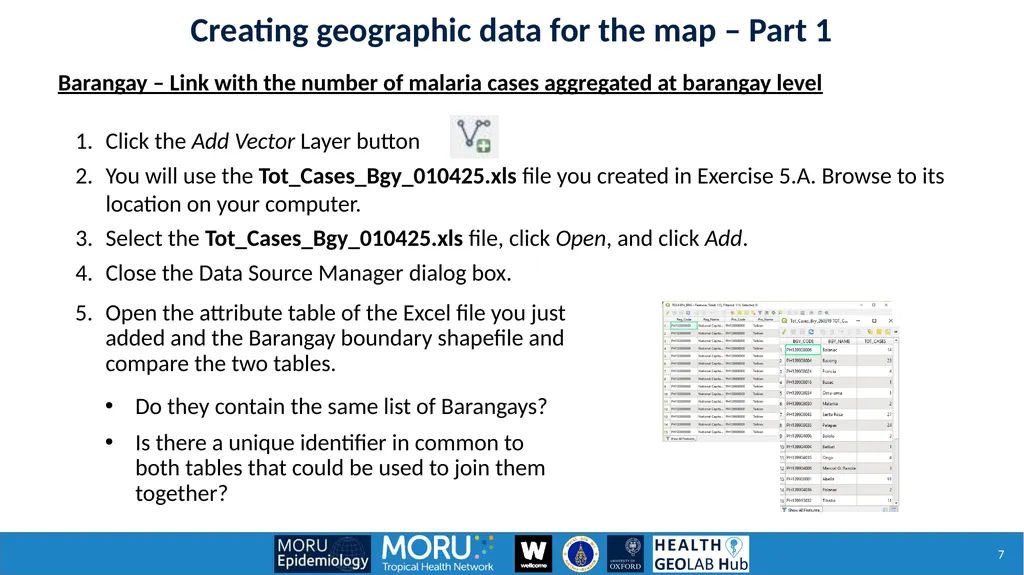
Open the attribute table of the Excel file you just added and the Barangay boundary shapefile and compare the two tables. Click the Add Vector Layer button
You will use the Tot_Cases_Bgy_010425.xls file you created in Exercise 5.A. Browse to its location on your computer.
Select the Tot_Cases_Bgy_010425.xls file, click Open, and click Add.
Close the Data Source Manager dialog box. Creating geographic data for the map – Part 1 Barangay – Link with the number of malaria cases aggregated at barangay level Do they contain the same list of Barangays?
Is there a unique identifier in common to both tables that could be used to join them together?<br>
You will use the Tot_Cases_Bgy_010425.xls file you created in Exercise 5.A. Browse to its location on your computer.
Select the Tot_Cases_Bgy_010425.xls file, click Open, and click Add.
Close the Data Source Manager dialog box. Creating geographic data for the map – Part 1 Barangay – Link with the number of malaria cases aggregated at barangay level Do they contain the same list of Barangays?
Is there a unique identifier in common to both tables that could be used to join them together?<br>
08
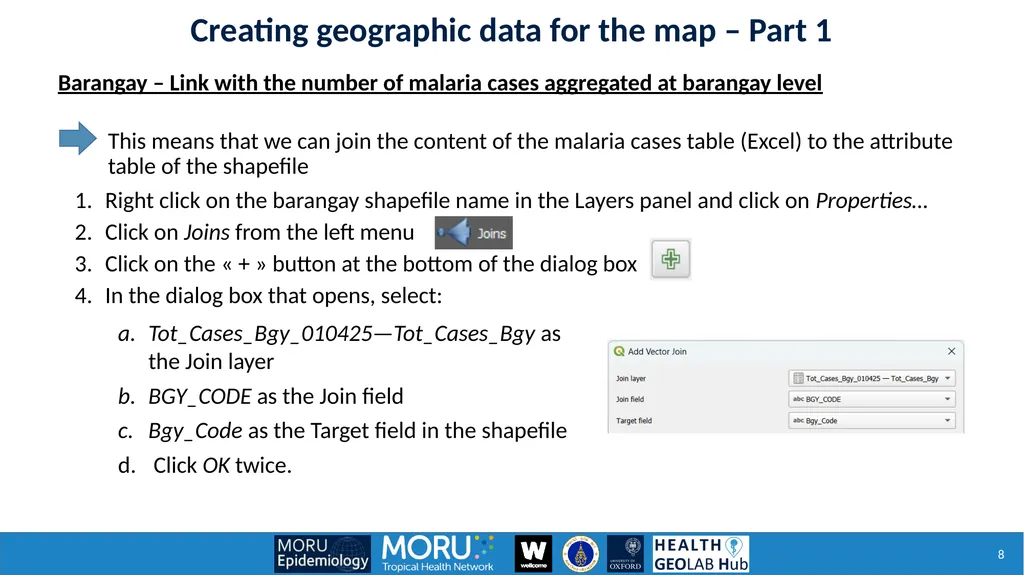
Right click on the barangay shapefile name in the Layers panel and click on Properties…
Click on Joins from the left menu
Click on the « + » button at the bottom of the dialog box
In the dialog box that opens, select: Tot_Cases_Bgy_010425—Tot_Cases_Bgy as the Join layer
BGY_CODE as the Join field
Bgy_Code as the Target field in the shapefile
Click OK twice. This means that we can join the content of the malaria cases table (Excel) to the attribute table of the shapefile Creating geographic data for the map – Part 1 Barangay – Link with the number of malaria cases aggregated at barangay level<br>
Click on Joins from the left menu
Click on the « + » button at the bottom of the dialog box
In the dialog box that opens, select: Tot_Cases_Bgy_010425—Tot_Cases_Bgy as the Join layer
BGY_CODE as the Join field
Bgy_Code as the Target field in the shapefile
Click OK twice. This means that we can join the content of the malaria cases table (Excel) to the attribute table of the shapefile Creating geographic data for the map – Part 1 Barangay – Link with the number of malaria cases aggregated at barangay level<br>
09
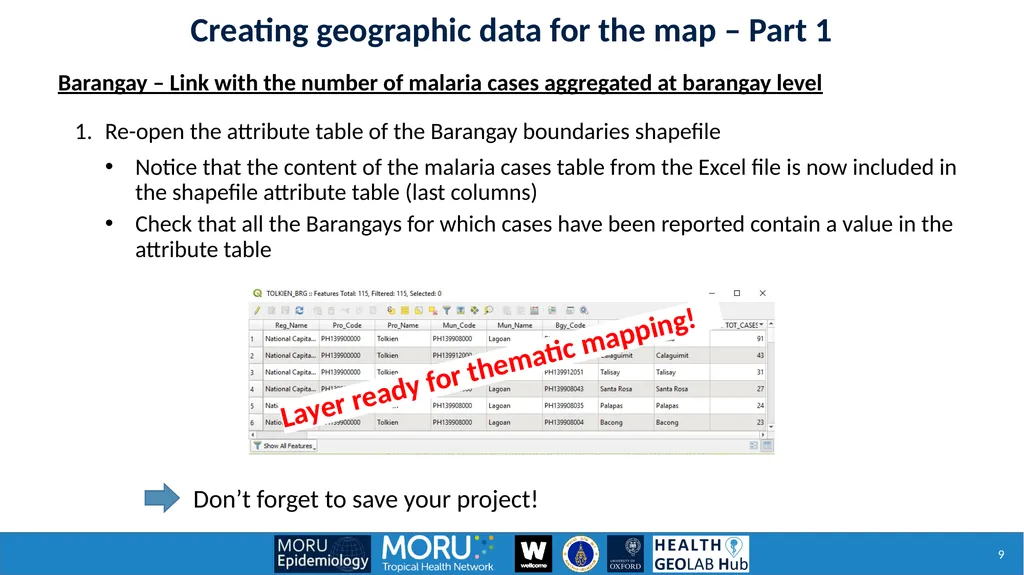
Re-open the attribute table of the Barangay boundaries shapefile Notice that the content of the malaria cases table from the Excel file is now included in the shapefile attribute table (last columns)
Check that all the Barangays for which cases have been reported contain a value in the attribute table Don’t forget to save your project! Creating geographic data for the map – Part 1 Barangay – Link with the number of malaria cases aggregated at barangay level<br>
Check that all the Barangays for which cases have been reported contain a value in the attribute table Don’t forget to save your project! Creating geographic data for the map – Part 1 Barangay – Link with the number of malaria cases aggregated at barangay level<br>
10
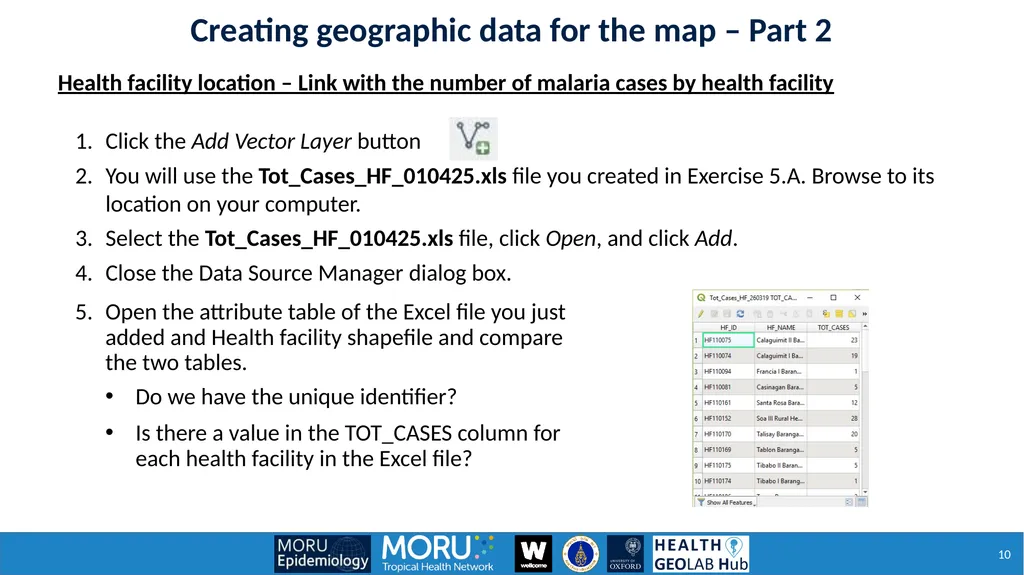
Click the Add Vector Layer button
You will use the Tot_Cases_HF_010425.xls file you created in Exercise 5.A. Browse to its location on your computer.
Select the Tot_Cases_HF_010425.xls file, click Open, and click Add.
Close the Data Source Manager dialog box. Do we have the unique identifier?
Is there a value in the TOT_CASES column for each health facility in the Excel file? Open the attribute table of the Excel file you just added and Health facility shapefile and compare the two tables. Creating geographic data for the map – Part 2 Health facility location – Link with the number of malaria cases by health facility<br>
You will use the Tot_Cases_HF_010425.xls file you created in Exercise 5.A. Browse to its location on your computer.
Select the Tot_Cases_HF_010425.xls file, click Open, and click Add.
Close the Data Source Manager dialog box. Do we have the unique identifier?
Is there a value in the TOT_CASES column for each health facility in the Excel file? Open the attribute table of the Excel file you just added and Health facility shapefile and compare the two tables. Creating geographic data for the map – Part 2 Health facility location – Link with the number of malaria cases by health facility<br>
11
Right click on the health facility shapefile name in the Layers panel and click on Properties…
Click on Joins from the left menu
Click on the « + » button at the bottom of the dialog box
In the dialog box that opens select: Tot_Cases_HF_010425—Tot_Cases_HF as the Join layer
HF_ID as the Join field
HF_ID as the Target field in the shapefile
Click OK twice. Save the project! We can join the content of the malaria cases table (Excel) to the attribute table of the shapefile Creating geographic data for the map – Part 2 Health facility location – Link with the number of malaria cases by health facility<br>
Click on Joins from the left menu
Click on the « + » button at the bottom of the dialog box
In the dialog box that opens select: Tot_Cases_HF_010425—Tot_Cases_HF as the Join layer
HF_ID as the Join field
HF_ID as the Target field in the shapefile
Click OK twice. Save the project! We can join the content of the malaria cases table (Excel) to the attribute table of the shapefile Creating geographic data for the map – Part 2 Health facility location – Link with the number of malaria cases by health facility<br>
12
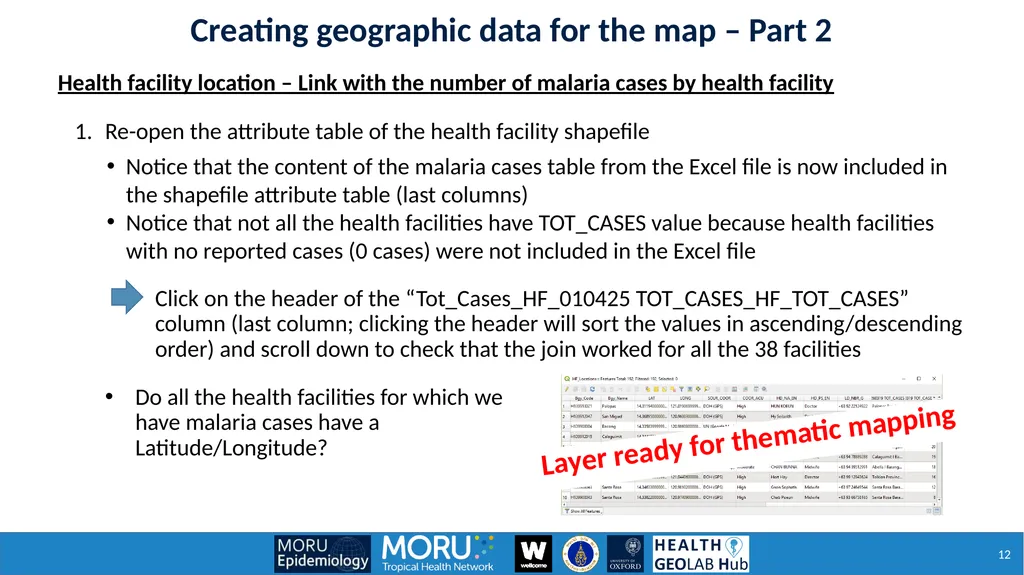
Re-open the attribute table of the health facility shapefile Notice that the content of the malaria cases table from the Excel file is now included in the shapefile attribute table (last columns)
Notice that not all the health facilities have TOT_CASES value because health facilities with no reported cases (0 cases) were not included in the Excel file Click on the header of the “Tot_Cases_HF_010425 TOT_CASES_HF_TOT_CASES” column (last column; clicking the header will sort the values in ascending/descending order) and scroll down to check that the join worked for all the 38 facilities Do all the health facilities for which we have malaria cases have a Latitude/Longitude? Creating geographic data for the map – Part 2 Health facility location – Link with the number of malaria cases by health facility<br>
Notice that not all the health facilities have TOT_CASES value because health facilities with no reported cases (0 cases) were not included in the Excel file Click on the header of the “Tot_Cases_HF_010425 TOT_CASES_HF_TOT_CASES” column (last column; clicking the header will sort the values in ascending/descending order) and scroll down to check that the join worked for all the 38 facilities Do all the health facilities for which we have malaria cases have a Latitude/Longitude? Creating geographic data for the map – Part 2 Health facility location – Link with the number of malaria cases by health facility<br>
13
You may now choose the mode of representation for your map.
As mentioned in Session 5.1, there are different ways to represent the data in your map.
For this exercise, graduated colors and proportional symbols are chosen as an example. Let’s represent our data! Creating thematic map – Mode of representation<br>
As mentioned in Session 5.1, there are different ways to represent the data in your map.
For this exercise, graduated colors and proportional symbols are chosen as an example. Let’s represent our data! Creating thematic map – Mode of representation<br>
14
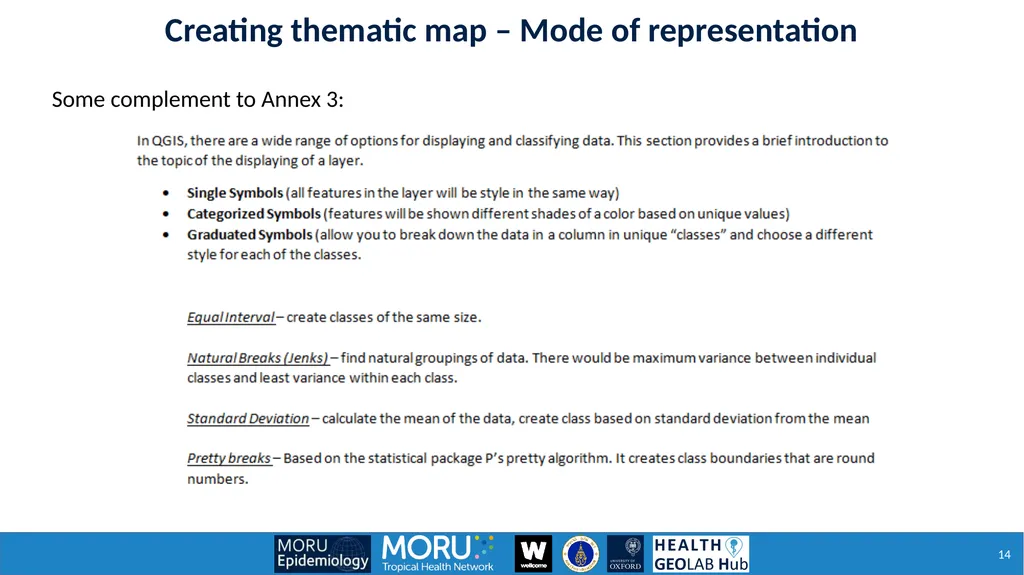
Some complement to Annex 3: Creating thematic map – Mode of representation<br>
15
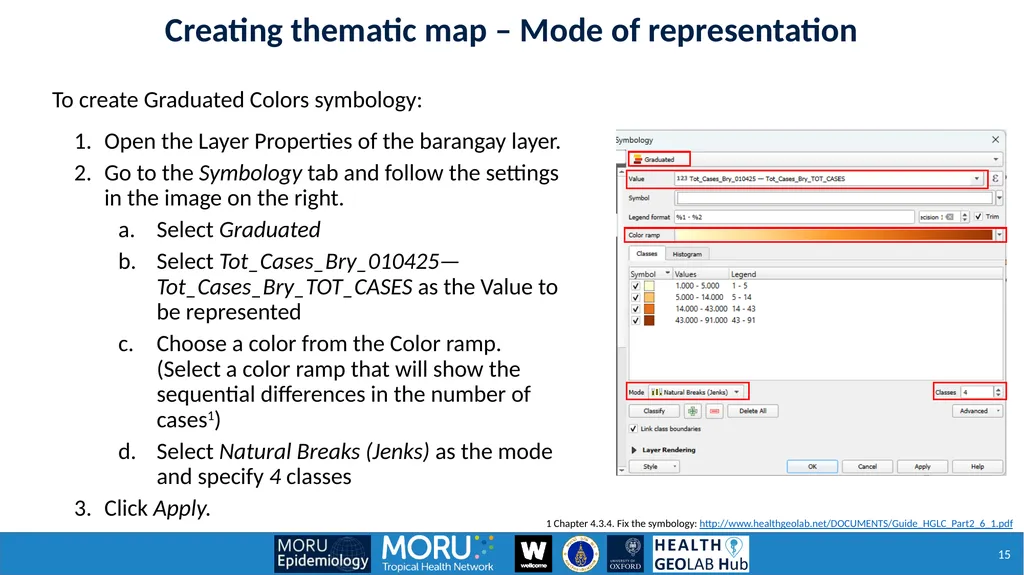
To create Graduated Colors symbology: Open the Layer Properties of the barangay layer.
Go to the Symbology tab and follow the settings in the image on the right.
Select Graduated
Select Tot_Cases_Bry_010425—Tot_Cases_Bry_TOT_CASES as the Value to be represented
Choose a color from the Color ramp. (Select a color ramp that will show the sequential differences in the number of cases1)
Select Natural Breaks (Jenks) as the mode and specify 4 classes
Click Apply. Creating thematic map – Mode of representation 1 Chapter 4.3.4. Fix the symbology: http://www.healthgeolab.net/DOCUMENTS/Guide_HGLC_Part2_6_1.pdf<br>
Go to the Symbology tab and follow the settings in the image on the right.
Select Graduated
Select Tot_Cases_Bry_010425—Tot_Cases_Bry_TOT_CASES as the Value to be represented
Choose a color from the Color ramp. (Select a color ramp that will show the sequential differences in the number of cases1)
Select Natural Breaks (Jenks) as the mode and specify 4 classes
Click Apply. Creating thematic map – Mode of representation 1 Chapter 4.3.4. Fix the symbology: http://www.healthgeolab.net/DOCUMENTS/Guide_HGLC_Part2_6_1.pdf<br>
16
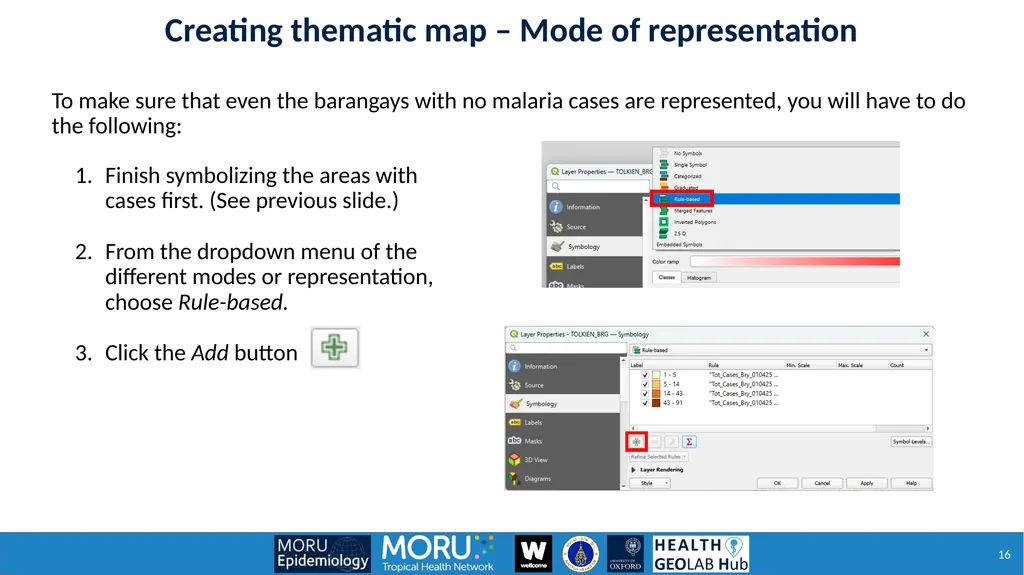
To make sure that even the barangays with no malaria cases are represented, you will have to do the following: Finish symbolizing the areas with cases first. (See previous slide.)
From the dropdown menu of the different modes or representation, choose Rule-based.
Click the Add button Creating thematic map – Mode of representation<br>
From the dropdown menu of the different modes or representation, choose Rule-based.
Click the Add button Creating thematic map – Mode of representation<br>
17
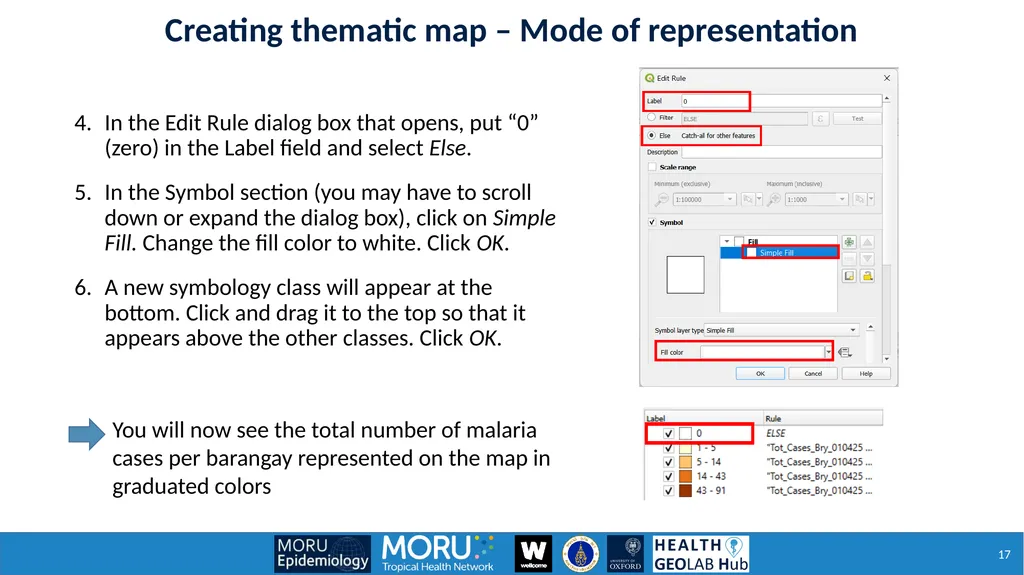
Creating thematic map – Mode of representation In the Edit Rule dialog box that opens, put “0” (zero) in the Label field and select Else.
In the Symbol section (you may have to scroll down or expand the dialog box), click on Simple Fill. Change the fill color to white. Click OK.
A new symbology class will appear at the bottom. Click and drag it to the top so that it appears above the other classes. Click OK. You will now see the total number of malaria cases per barangay represented on the map in graduated colors<br>
In the Symbol section (you may have to scroll down or expand the dialog box), click on Simple Fill. Change the fill color to white. Click OK.
A new symbology class will appear at the bottom. Click and drag it to the top so that it appears above the other classes. Click OK. You will now see the total number of malaria cases per barangay represented on the map in graduated colors<br>
18
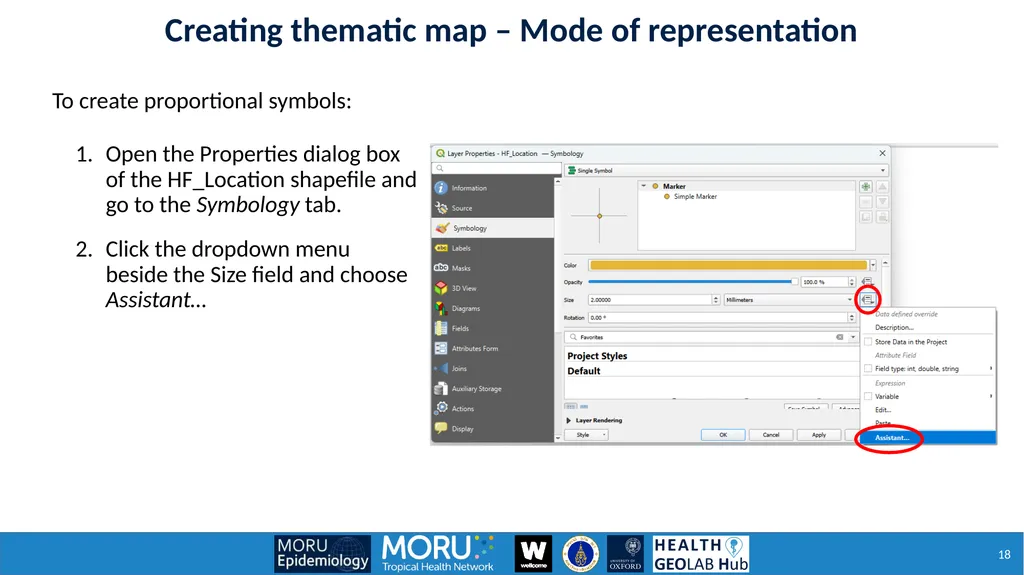
Creating thematic map – Mode of representation To create proportional symbols: Open the Properties dialog box of the HF_Location shapefile and go to the Symbology tab.
Click the dropdown menu beside the Size field and choose Assistant…<br>
Click the dropdown menu beside the Size field and choose Assistant…<br>
19
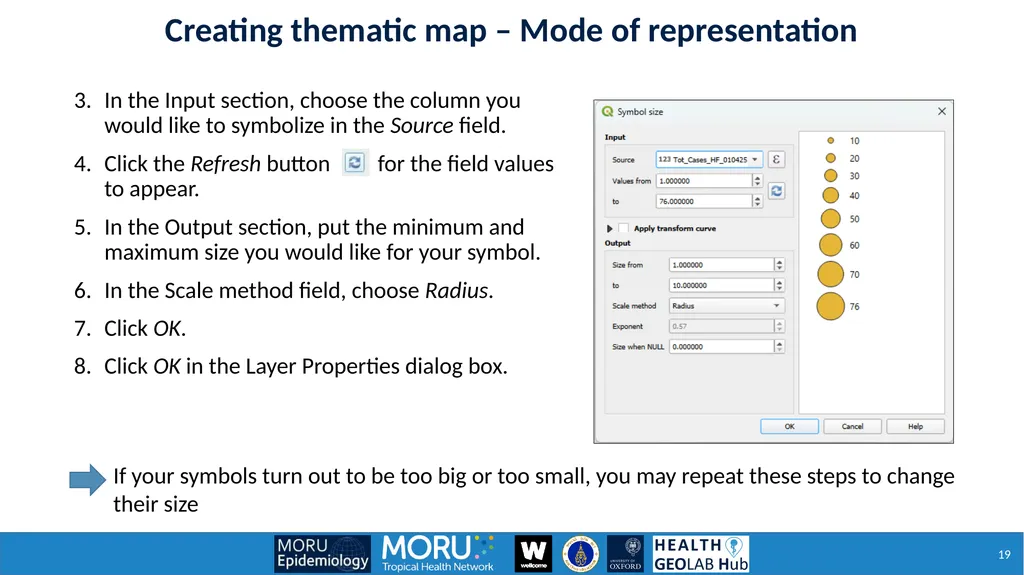
Creating thematic map – Mode of representation In the Input section, choose the column you would like to symbolize in the Source field.
Click the Refresh button for the field values to appear.
In the Output section, put the minimum and maximum size you would like for your symbol.
In the Scale method field, choose Radius.
Click OK.
Click OK in the Layer Properties dialog box. If your symbols turn out to be too big or too small, you may repeat these steps to change their size<br>
Click the Refresh button for the field values to appear.
In the Output section, put the minimum and maximum size you would like for your symbol.
In the Scale method field, choose Radius.
Click OK.
Click OK in the Layer Properties dialog box. If your symbols turn out to be too big or too small, you may repeat these steps to change their size<br>
20
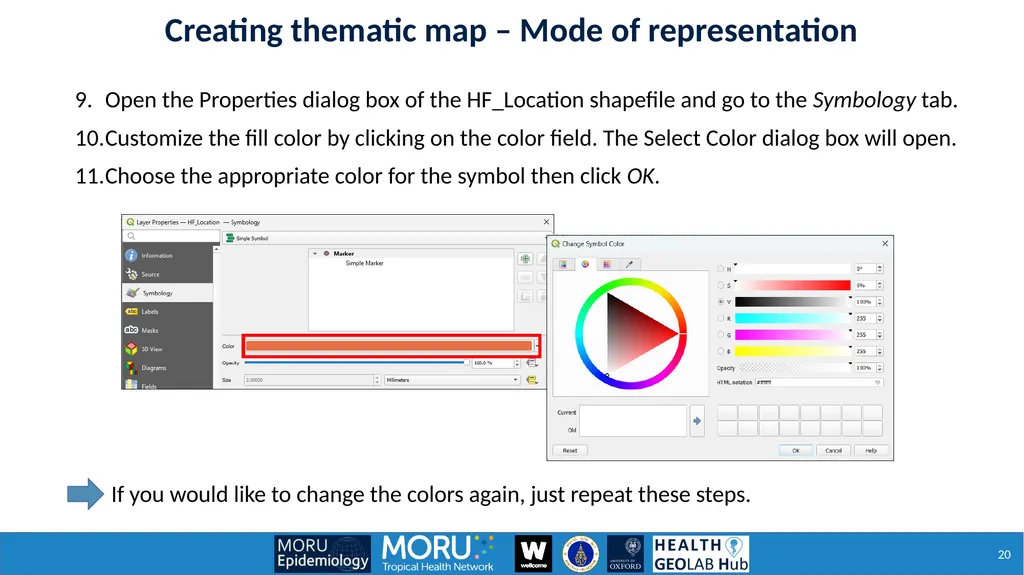
Creating thematic map – Mode of representation Open the Properties dialog box of the HF_Location shapefile and go to the Symbology tab.
Customize the fill color by clicking on the color field. The Select Color dialog box will open.
Choose the appropriate color for the symbol then click OK. If you would like to change the colors again, just repeat these steps.<br>
Customize the fill color by clicking on the color field. The Select Color dialog box will open.
Choose the appropriate color for the symbol then click OK. If you would like to change the colors again, just repeat these steps.<br>
21
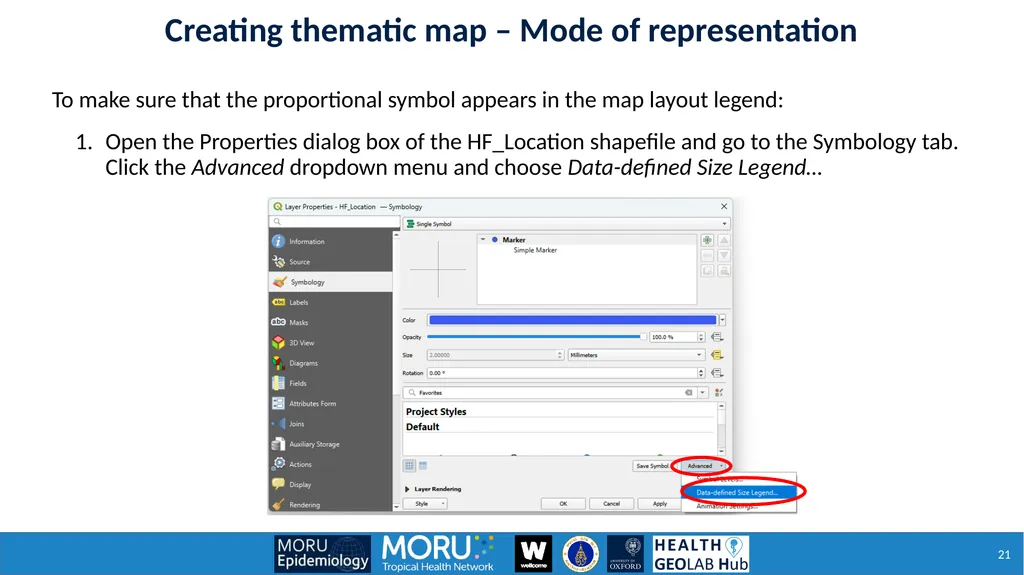
Creating thematic map – Mode of representation To make sure that the proportional symbol appears in the map layout legend: Open the Properties dialog box of the HF_Location shapefile and go to the Symbology tab. Click the Advanced dropdown menu and choose Data-defined Size Legend…<br>
22
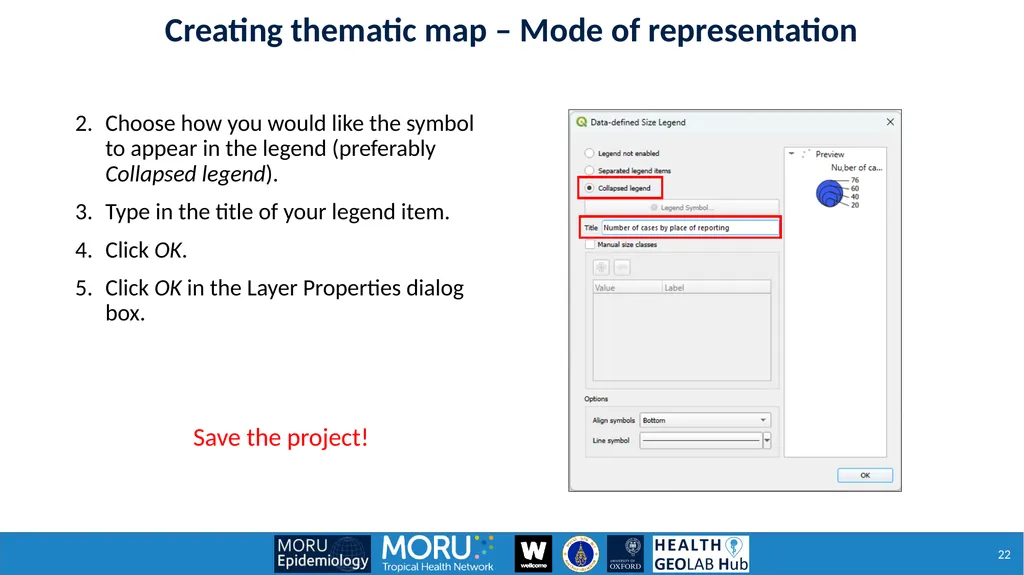
Creating thematic map – Mode of representation Choose how you would like the symbol to appear in the legend (preferably Collapsed legend).
Type in the title of your legend item.
Click OK.
Click OK in the Layer Properties dialog box. Save the project!<br>
Type in the title of your legend item.
Click OK.
Click OK in the Layer Properties dialog box. Save the project!<br>
23
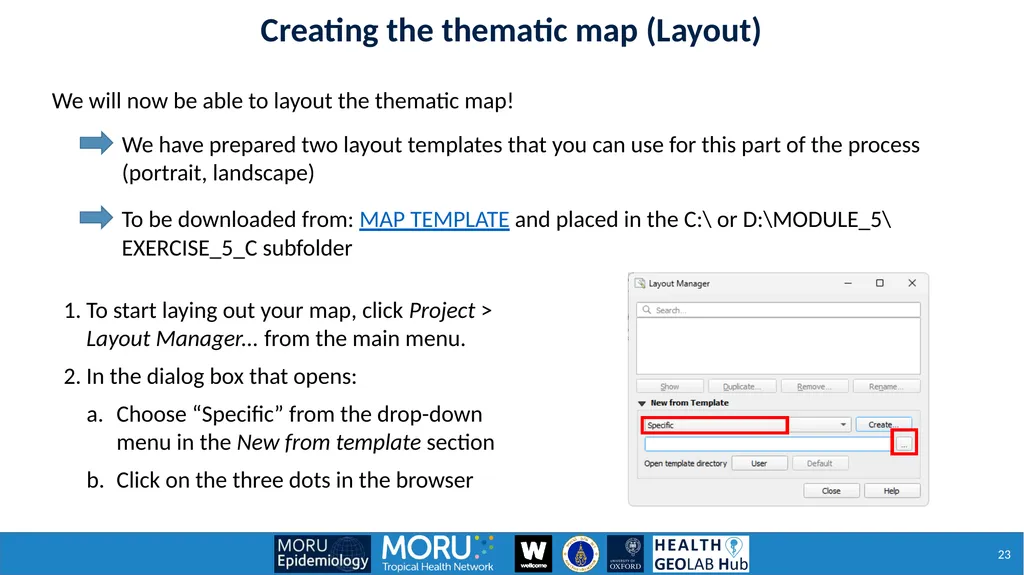
We have prepared two layout templates that you can use for this part of the process (portrait, landscape) To start laying out your map, click Project > Layout Manager... from the main menu.
In the dialog box that opens:
Choose “Specific” from the drop-down menu in the New from template section
Click on the three dots in the browser We will now be able to layout the thematic map! To be downloaded from: MAP TEMPLATE and placed in the C:\ or D:\MODULE_5\EXERCISE_5_C subfolder Creating the thematic map (Layout)<br>
In the dialog box that opens:
Choose “Specific” from the drop-down menu in the New from template section
Click on the three dots in the browser We will now be able to layout the thematic map! To be downloaded from: MAP TEMPLATE and placed in the C:\ or D:\MODULE_5\EXERCISE_5_C subfolder Creating the thematic map (Layout)<br>
24
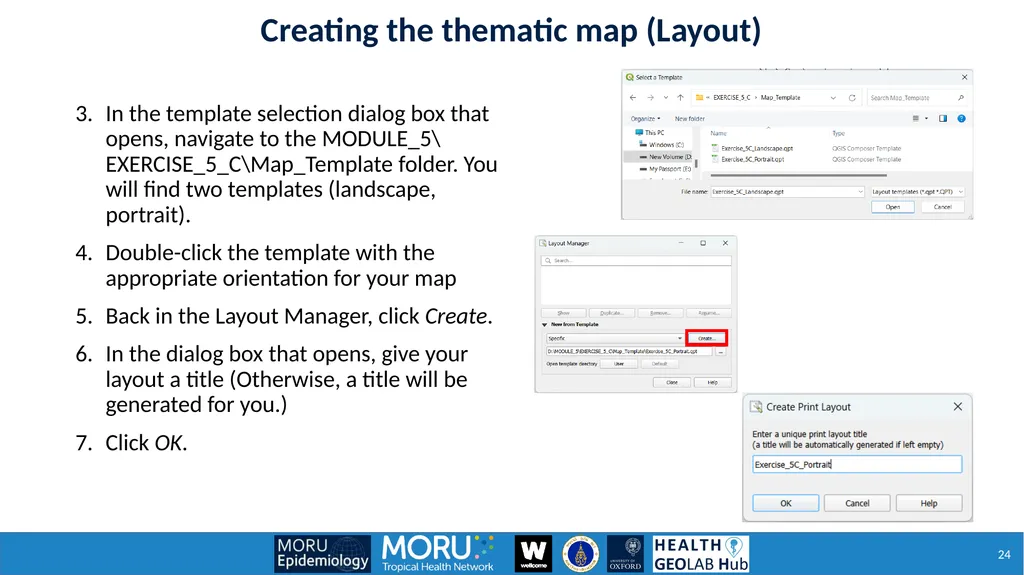
In the template selection dialog box that opens, navigate to the MODULE_5\EXERCISE_5_C\Map_Template folder. You will find two templates (landscape, portrait).
Double-click the template with the appropriate orientation for your map
Back in the Layout Manager, click Create.
In the dialog box that opens, give your layout a title (Otherwise, a title will be generated for you.)
Click OK. Creating the thematic map (Layout)<br>
Double-click the template with the appropriate orientation for your map
Back in the Layout Manager, click Create.
In the dialog box that opens, give your layout a title (Otherwise, a title will be generated for you.)
Click OK. Creating the thematic map (Layout)<br>
25
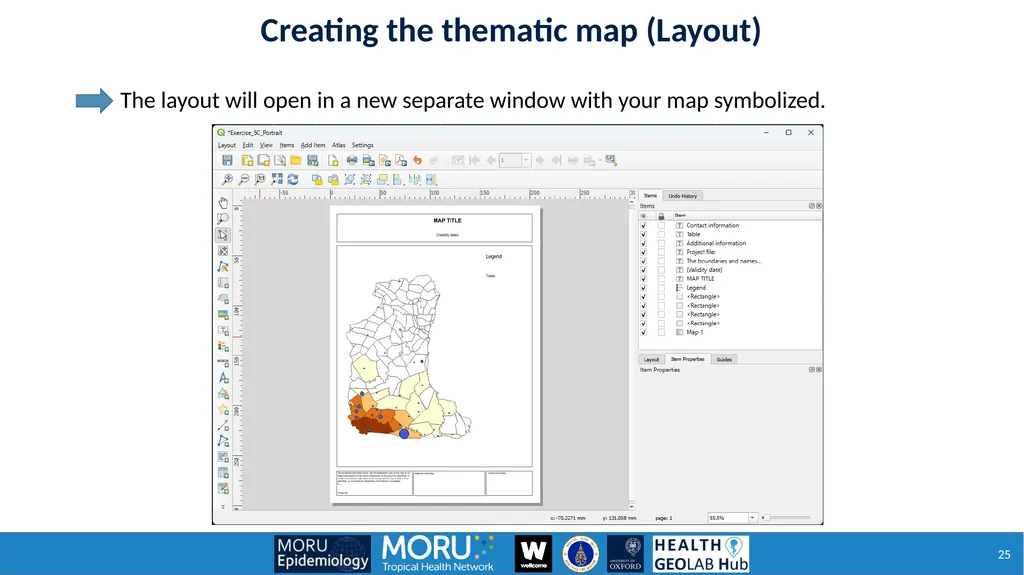
The layout will open in a new separate window with your map symbolized. Creating the thematic map (Layout)<br>
26
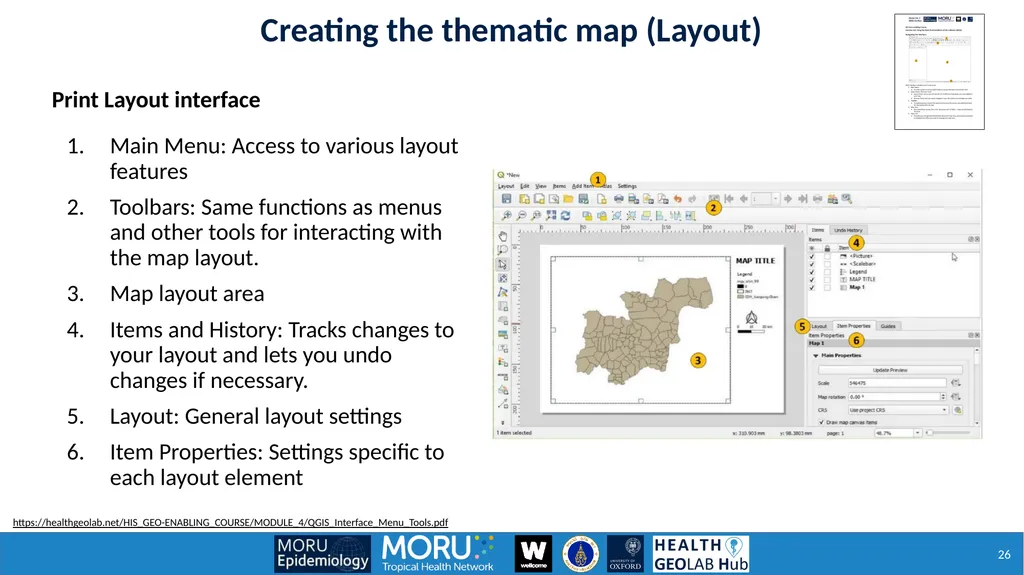
Print Layout interface Main Menu: Access to various layout features
Toolbars: Same functions as menus and other tools for interacting with the map layout.
Map layout area
Items and History: Tracks changes to your layout and lets you undo changes if necessary.
Layout: General layout settings
Item Properties: Settings specific to each layout element Creating the thematic map (Layout) https://healthgeolab.net/HIS_GEO-ENABLING_COURSE/MODULE_4/QGIS_Interface_Menu_Tools.pdf<br>
Toolbars: Same functions as menus and other tools for interacting with the map layout.
Map layout area
Items and History: Tracks changes to your layout and lets you undo changes if necessary.
Layout: General layout settings
Item Properties: Settings specific to each layout element Creating the thematic map (Layout) https://healthgeolab.net/HIS_GEO-ENABLING_COURSE/MODULE_4/QGIS_Interface_Menu_Tools.pdf<br>
27
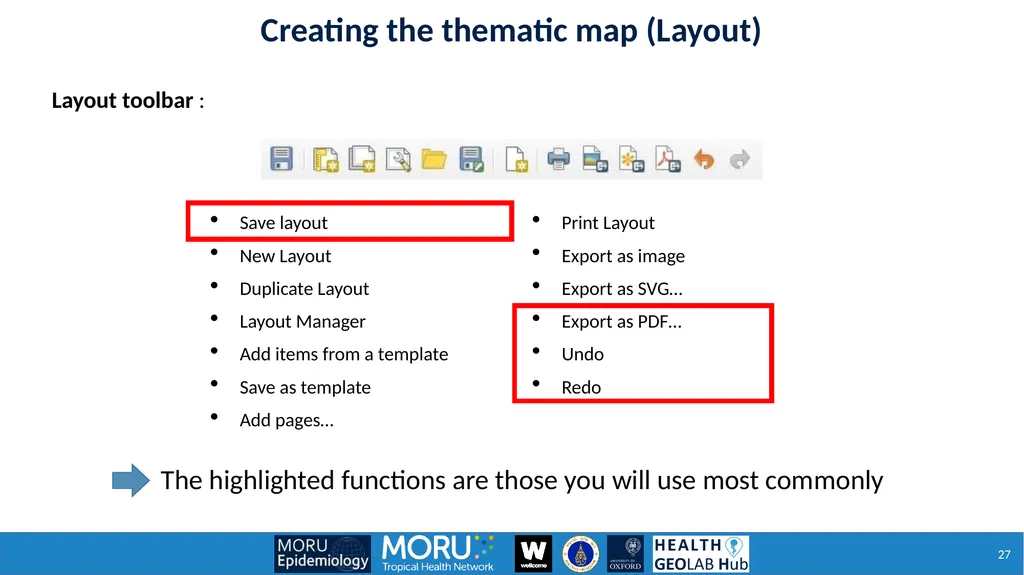
Layout toolbar : Save layout
New Layout
Duplicate Layout
Layout Manager
Add items from a template
Save as template
Add pages…
Print Layout
Export as image
Export as SVG…
Export as PDF…
Undo
Redo The highlighted functions are those you will use most commonly Creating the thematic map (Layout)<br>
New Layout
Duplicate Layout
Layout Manager
Add items from a template
Save as template
Add pages…
Print Layout
Export as image
Export as SVG…
Export as PDF…
Undo
Redo The highlighted functions are those you will use most commonly Creating the thematic map (Layout)<br>
28
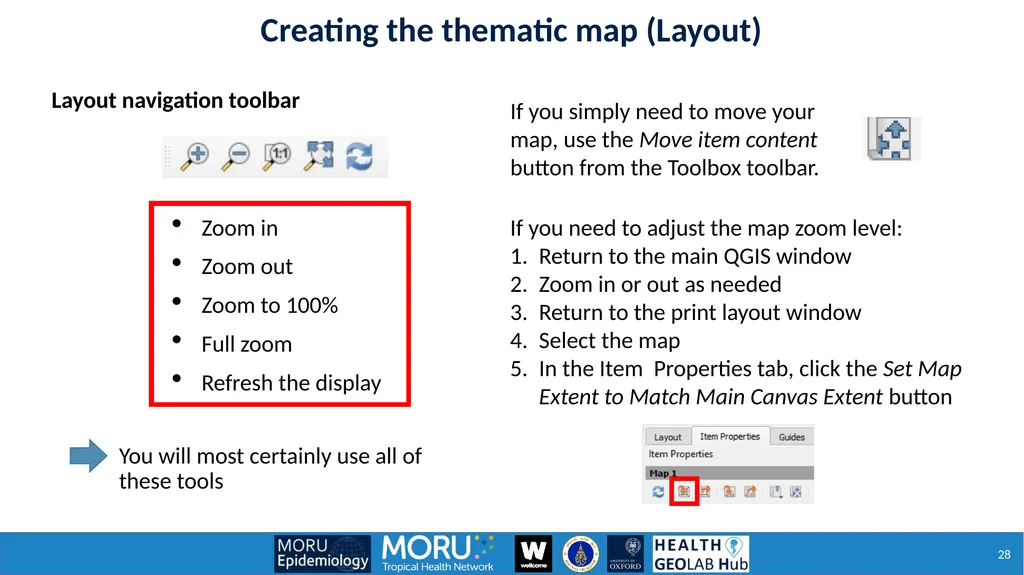
Layout navigation toolbar You will most certainly use all of these tools Zoom in
Zoom out
Zoom to 100%
Full zoom
Refresh the display If you simply need to move your map, use the Move item content button from the Toolbox toolbar. If you need to adjust the map zoom level:
Return to the main QGIS window
Zoom in or out as needed
Return to the print layout window
Select the map
In the Item Properties tab, click the Set Map Extent to Match Main Canvas Extent button Creating the thematic map (Layout)<br>
Zoom out
Zoom to 100%
Full zoom
Refresh the display If you simply need to move your map, use the Move item content button from the Toolbox toolbar. If you need to adjust the map zoom level:
Return to the main QGIS window
Zoom in or out as needed
Return to the print layout window
Select the map
In the Item Properties tab, click the Set Map Extent to Match Main Canvas Extent button Creating the thematic map (Layout)<br>
29
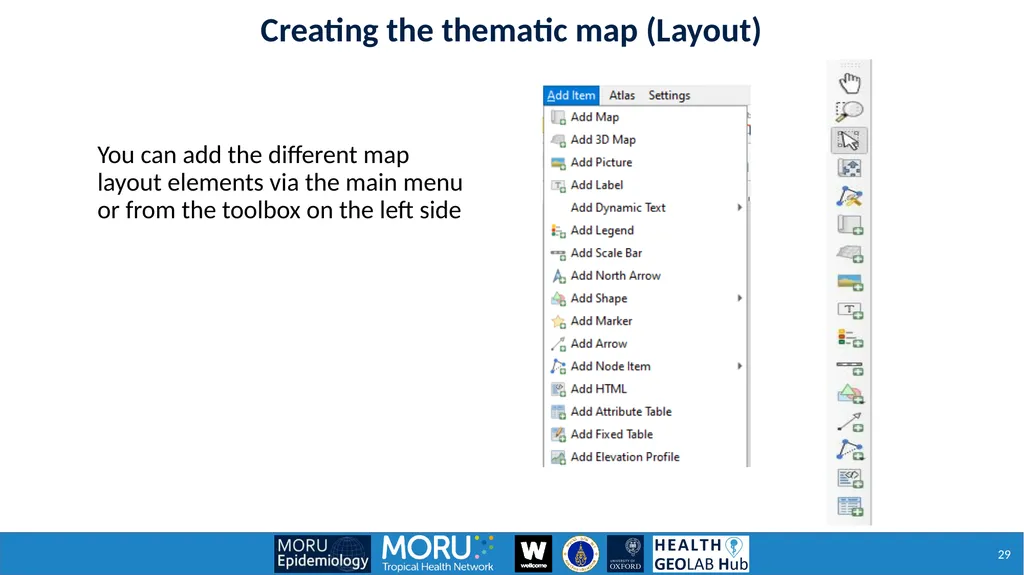
You can add the different map layout elements via the main menu or from the toolbox on the left side Creating the thematic map (Layout)<br>
30
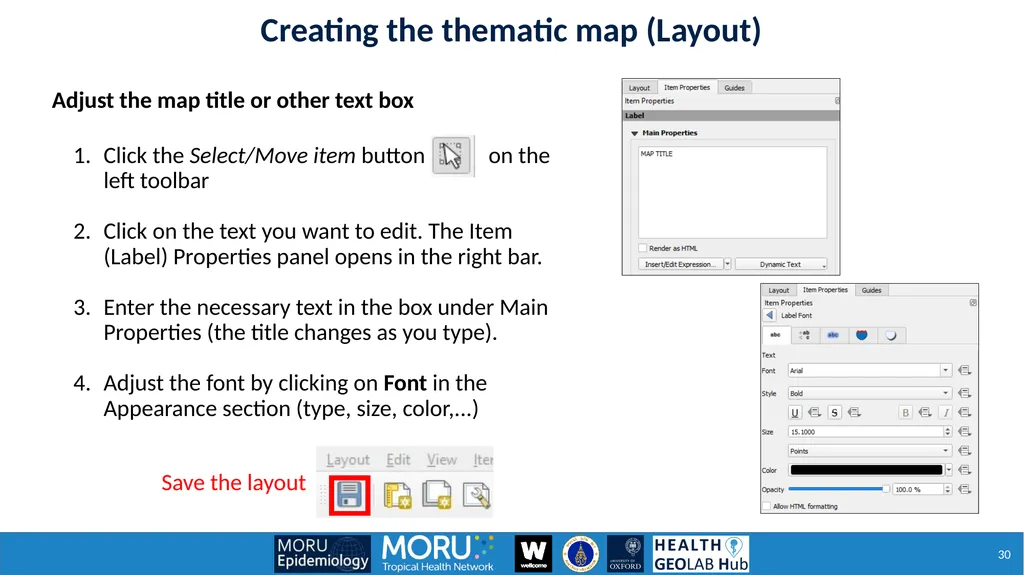
Click the Select/Move item button on the left toolbar
Click on the text you want to edit. The Item (Label) Properties panel opens in the right bar.
Enter the necessary text in the box under Main Properties (the title changes as you type).
Adjust the font by clicking on Font in the Appearance section (type, size, color,...) Adjust the map title or other text box Save the layout Creating the thematic map (Layout)<br>
Click on the text you want to edit. The Item (Label) Properties panel opens in the right bar.
Enter the necessary text in the box under Main Properties (the title changes as you type).
Adjust the font by clicking on Font in the Appearance section (type, size, color,...) Adjust the map title or other text box Save the layout Creating the thematic map (Layout)<br>
31
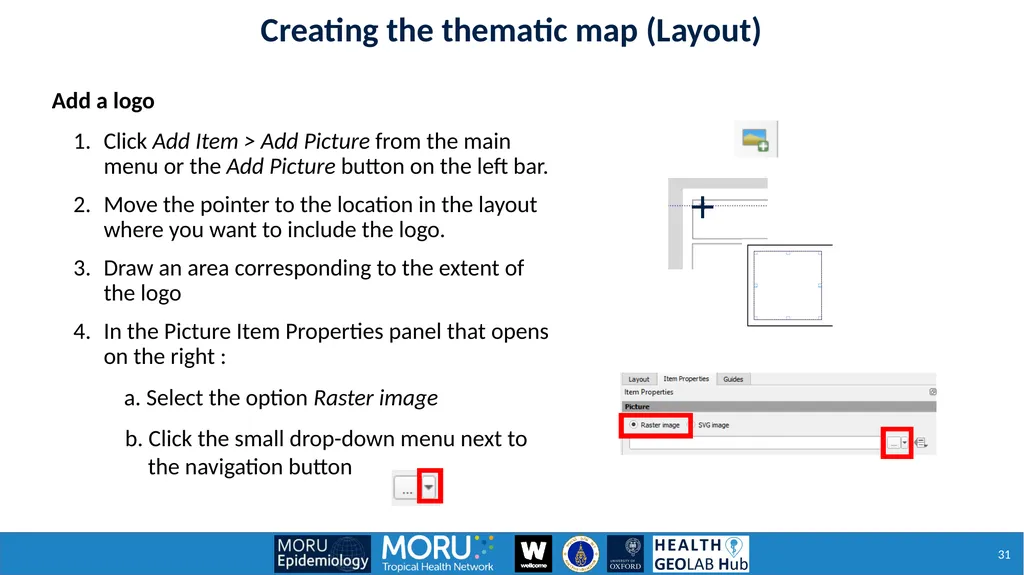
Click Add Item > Add Picture from the main menu or the Add Picture button on the left bar.
Move the pointer to the location in the layout where you want to include the logo.
Draw an area corresponding to the extent of the logo
In the Picture Item Properties panel that opens on the right :
a. Select the option Raster image
b. Click the small drop-down menu next to the navigation button Add a logo Creating the thematic map (Layout)<br>
Move the pointer to the location in the layout where you want to include the logo.
Draw an area corresponding to the extent of the logo
In the Picture Item Properties panel that opens on the right :
a. Select the option Raster image
b. Click the small drop-down menu next to the navigation button Add a logo Creating the thematic map (Layout)<br>
32
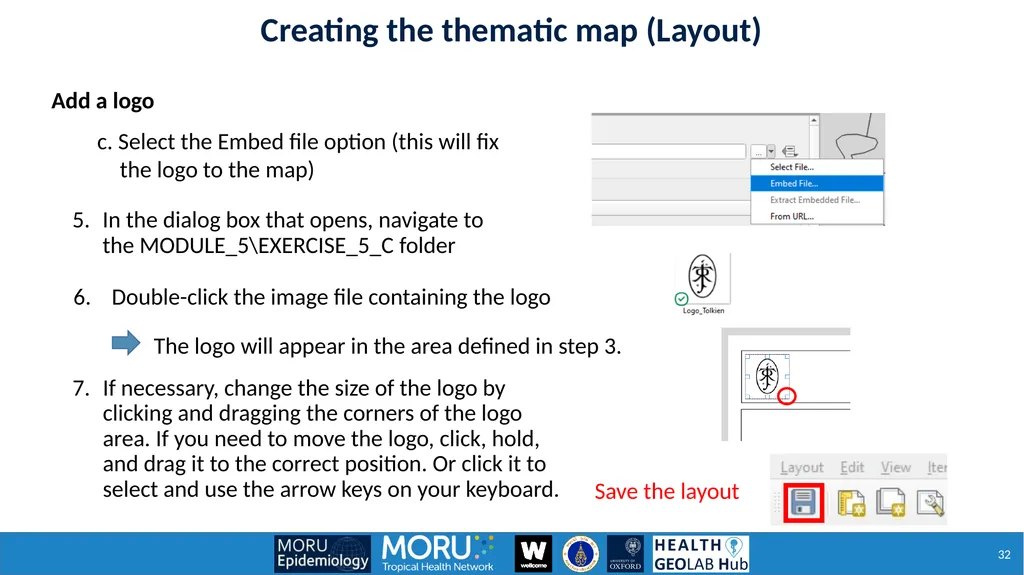
Double-click the image file containing the logo The logo will appear in the area defined in step 3. If necessary, change the size of the logo by clicking and dragging the corners of the logo area. If you need to move the logo, click, hold, and drag it to the correct position. Or click it to select and use the arrow keys on your keyboard. c. Select the Embed file option (this will fix the logo to the map)
In the dialog box that opens, navigate to the MODULE_5\EXERCISE_5_C folder Save the layout Add a logo Creating the thematic map (Layout)<br>
In the dialog box that opens, navigate to the MODULE_5\EXERCISE_5_C folder Save the layout Add a logo Creating the thematic map (Layout)<br>
33
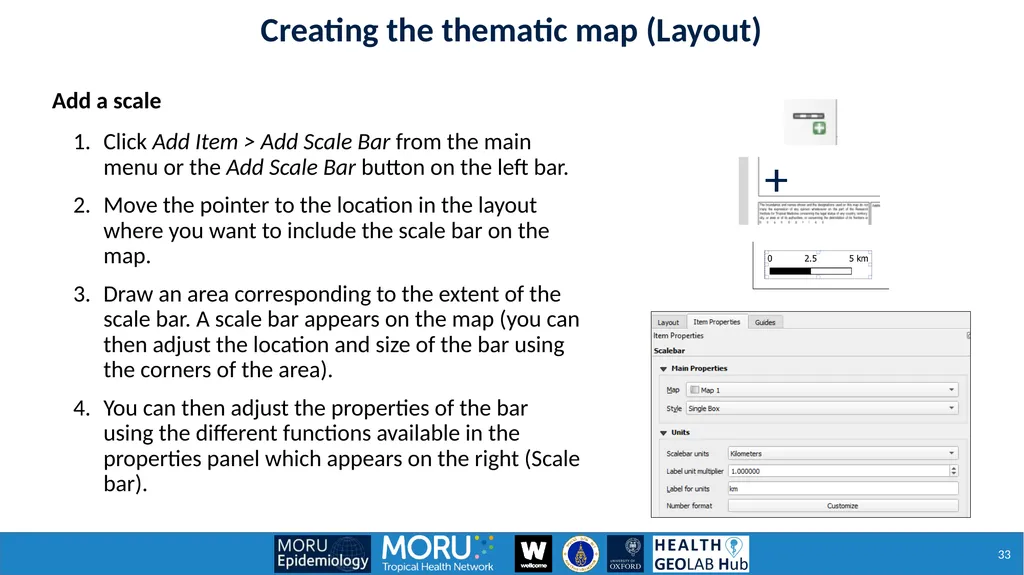
Add a scale Click Add Item > Add Scale Bar from the main menu or the Add Scale Bar button on the left bar.
Move the pointer to the location in the layout where you want to include the scale bar on the map.
Draw an area corresponding to the extent of the scale bar. A scale bar appears on the map (you can then adjust the location and size of the bar using the corners of the area).
You can then adjust the properties of the bar using the different functions available in the properties panel which appears on the right (Scale bar). Creating the thematic map (Layout)<br>
Move the pointer to the location in the layout where you want to include the scale bar on the map.
Draw an area corresponding to the extent of the scale bar. A scale bar appears on the map (you can then adjust the location and size of the bar using the corners of the area).
You can then adjust the properties of the bar using the different functions available in the properties panel which appears on the right (Scale bar). Creating the thematic map (Layout)<br>
34
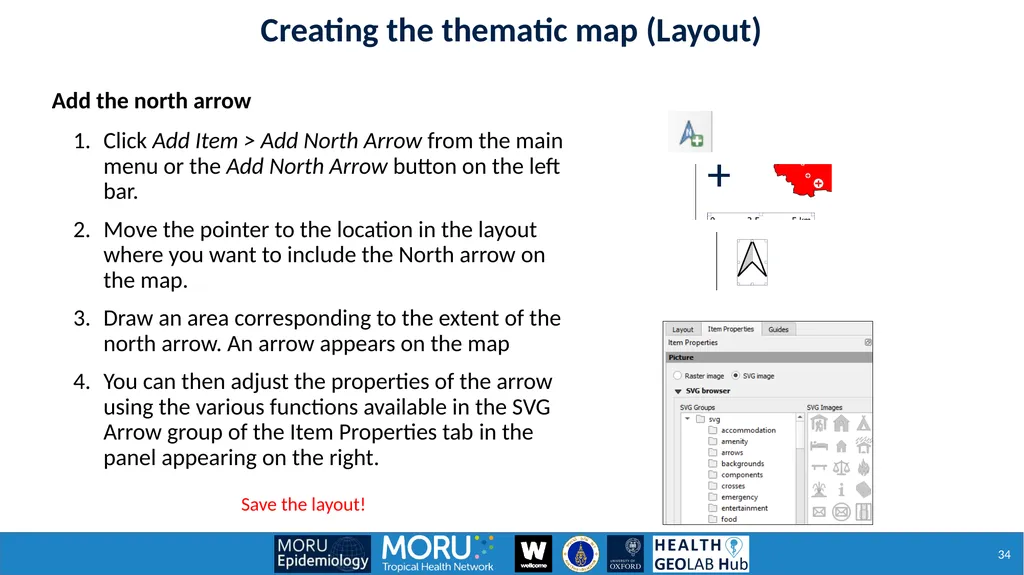
Add the north arrow Click Add Item > Add North Arrow from the main menu or the Add North Arrow button on the left bar.
Move the pointer to the location in the layout where you want to include the North arrow on the map.
Draw an area corresponding to the extent of the north arrow. An arrow appears on the map
You can then adjust the properties of the arrow using the various functions available in the SVG Arrow group of the Item Properties tab in the panel appearing on the right. Save the layout! Creating the thematic map (Layout)<br>
Move the pointer to the location in the layout where you want to include the North arrow on the map.
Draw an area corresponding to the extent of the north arrow. An arrow appears on the map
You can then adjust the properties of the arrow using the various functions available in the SVG Arrow group of the Item Properties tab in the panel appearing on the right. Save the layout! Creating the thematic map (Layout)<br>
35
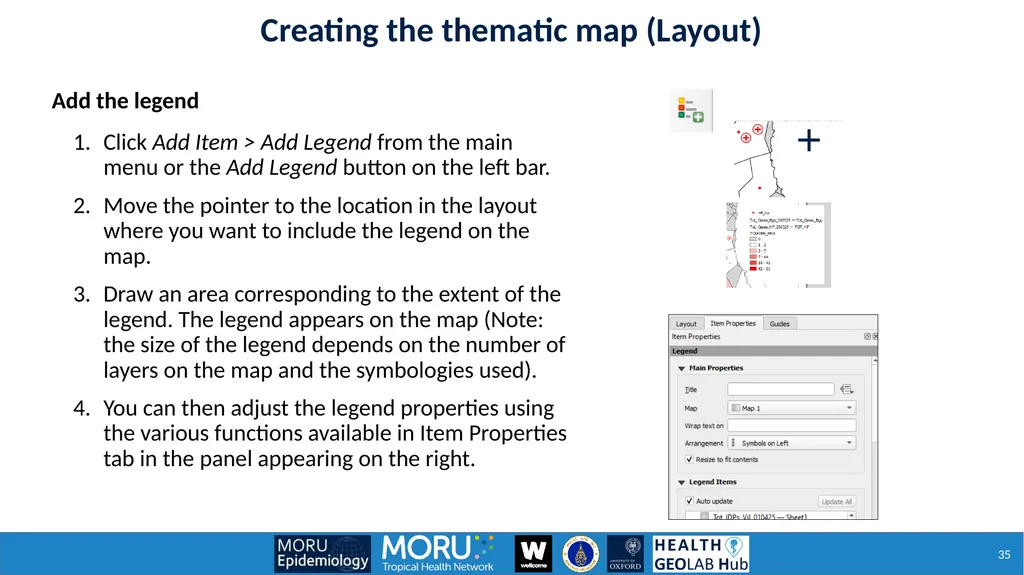
Add the legend Click Add Item > Add Legend from the main menu or the Add Legend button on the left bar.
Move the pointer to the location in the layout where you want to include the legend on the map.
Draw an area corresponding to the extent of the legend. The legend appears on the map (Note: the size of the legend depends on the number of layers on the map and the symbologies used).
You can then adjust the legend properties using the various functions available in Item Properties tab in the panel appearing on the right. Creating the thematic map (Layout)<br>
Move the pointer to the location in the layout where you want to include the legend on the map.
Draw an area corresponding to the extent of the legend. The legend appears on the map (Note: the size of the legend depends on the number of layers on the map and the symbologies used).
You can then adjust the legend properties using the various functions available in Item Properties tab in the panel appearing on the right. Creating the thematic map (Layout)<br>
36
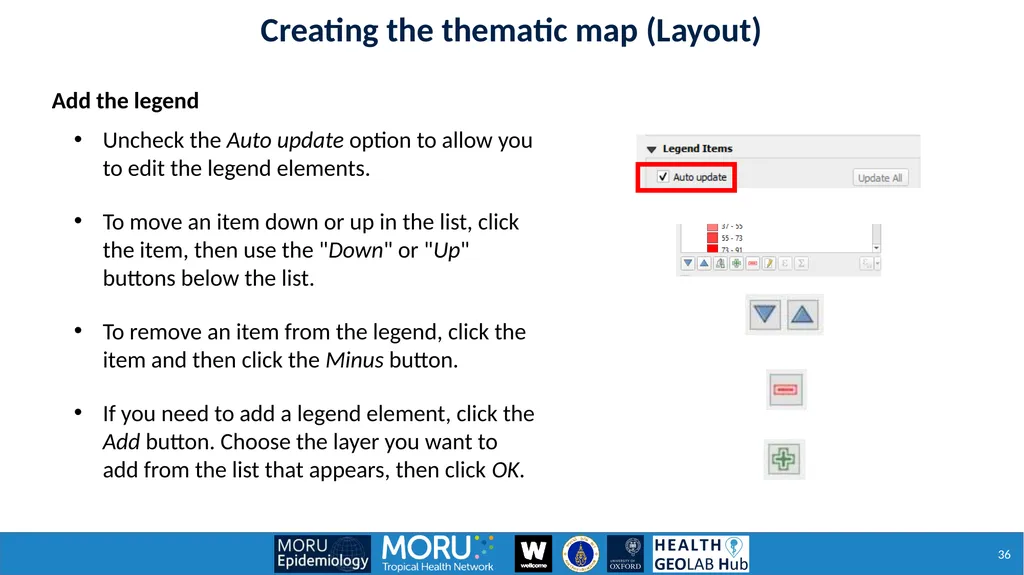
Uncheck the Auto update option to allow you to edit the legend elements.
To move an item down or up in the list, click the item, then use the "Down" or "Up" buttons below the list.
To remove an item from the legend, click the item and then click the Minus button.
If you need to add a legend element, click the Add button. Choose the layer you want to add from the list that appears, then click OK. Add the legend Creating the thematic map (Layout)<br>
To move an item down or up in the list, click the item, then use the "Down" or "Up" buttons below the list.
To remove an item from the legend, click the item and then click the Minus button.
If you need to add a legend element, click the Add button. Choose the layer you want to add from the list that appears, then click OK. Add the legend Creating the thematic map (Layout)<br>
37
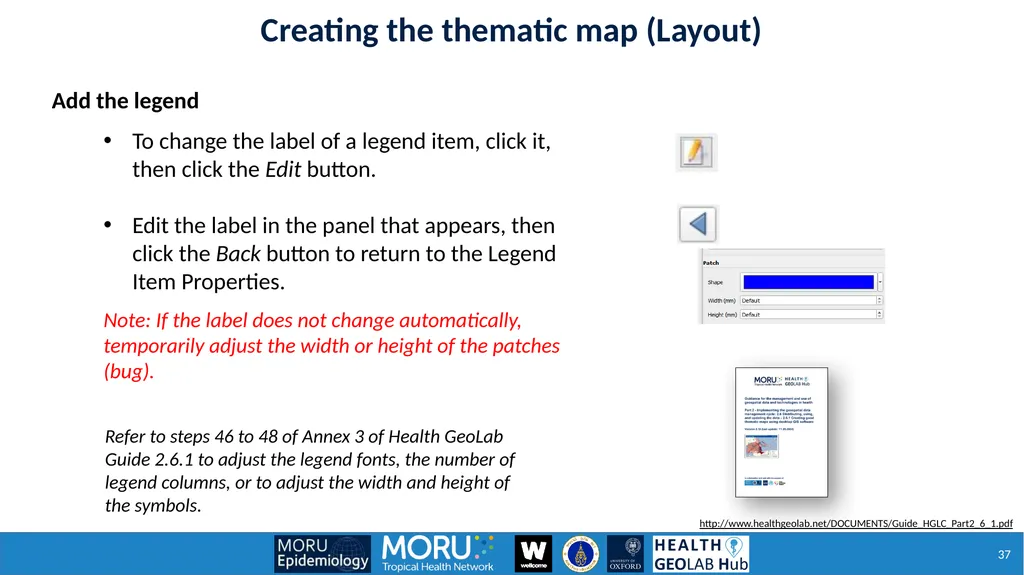
To change the label of a legend item, click it, then click the Edit button.
Edit the label in the panel that appears, then click the Back button to return to the Legend Item Properties.
Note: If the label does not change automatically, temporarily adjust the width or height of the patches (bug). Refer to steps 46 to 48 of Annex 3 of Health GeoLab Guide 2.6.1 to adjust the legend fonts, the number of legend columns, or to adjust the width and height of the symbols. Add the legend Creating the thematic map (Layout) http://www.healthgeolab.net/DOCUMENTS/Guide_HGLC_Part2_6_1.pdf<br>
Edit the label in the panel that appears, then click the Back button to return to the Legend Item Properties.
Note: If the label does not change automatically, temporarily adjust the width or height of the patches (bug). Refer to steps 46 to 48 of Annex 3 of Health GeoLab Guide 2.6.1 to adjust the legend fonts, the number of legend columns, or to adjust the width and height of the symbols. Add the legend Creating the thematic map (Layout) http://www.healthgeolab.net/DOCUMENTS/Guide_HGLC_Part2_6_1.pdf<br>
38
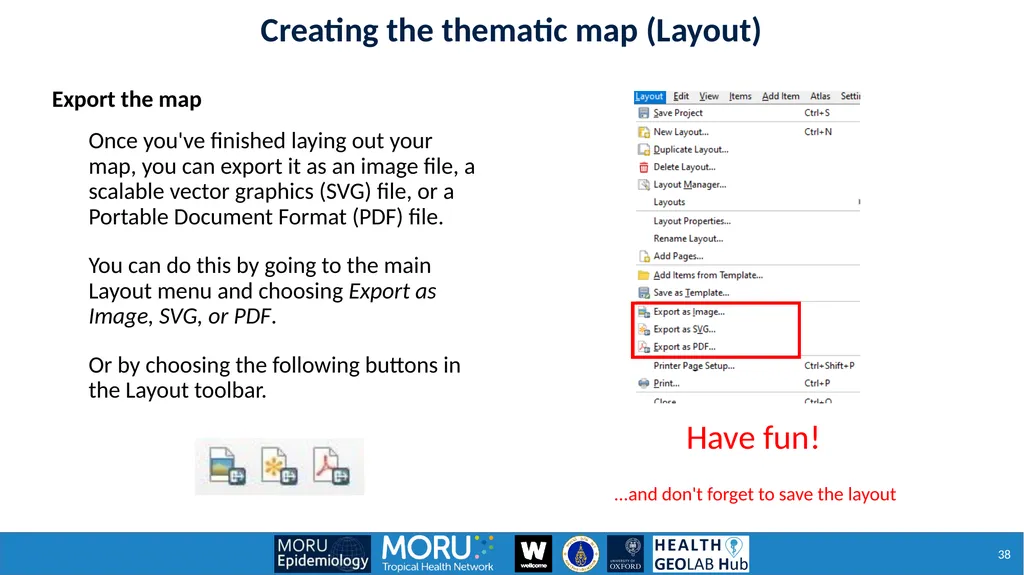
Once you've finished laying out your map, you can export it as an image file, a scalable vector graphics (SVG) file, or a Portable Document Format (PDF) file.
You can do this by going to the main Layout menu and choosing Export as Image, SVG, or PDF.
Or by choosing the following buttons in the Layout toolbar. Export the map ...and don't forget to save the layout Have fun! Creating the thematic map (Layout)<br>
You can do this by going to the main Layout menu and choosing Export as Image, SVG, or PDF.
Or by choosing the following buttons in the Layout toolbar. Export the map ...and don't forget to save the layout Have fun! Creating the thematic map (Layout)<br>
39
Adapted to the purpose, audience, content and medium Include the key components that make a good map + Good luck !!! Criteria to judge the maps Purpose: Assist on-going malaria control and elimination activities
Audience: Province-level Malaria Surveillance Officer
Content:
Number of malaria cases:
By place of reporting at the health facility level
By place of reporting aggregated by Barangay
Medium: A4 size map stored as PDF<br>
Audience: Province-level Malaria Surveillance Officer
Content:
Number of malaria cases:
By place of reporting at the health facility level
By place of reporting aggregated by Barangay
Medium: A4 size map stored as PDF<br>