
Exploring the Relationship among Stocks of
AS
Published · 21 slides · 0 views
1 / 1

Description
Exploring the Relationship among Stocks of Community Wealth, State Farm to School Policies, and the Intensity of Farm to School Activities Pratyoosh Kashyap Becca Jablonski Allie Bauman Department of Agricultural and Resource Economics
Related Topics
Share
Embed code
Download this presentation From Below
"Exploring the Relationship among Stocks of" is the property of its rightful owner. Permission is granted to download and print the materials on this website for personal, non-commercial use only, and to display it on your personal computer provided you do not modify the materials and that you retain all copyright notices contained in the materials. By downloading content from our website, you accept the terms of this agreement.
Presentation Transcript
01
Exploring the Relationship among
Stocks of Community Wealth,
State Farm to School Policies, and the Intensity of Farm to School Activities Pratyoosh Kashyap
Becca Jablonski
Allie Bauman
Department of Agricultural and Resource Economics Colorado State University Presenting at the 2022 AAEA Annual Meeting
This material is based upon work that is supported by the National Institute of Food and Agriculture, U.S. Department of Agriculture, under award number 2021-68006-34029.<br>
Department of Agricultural and Resource Economics Colorado State University Presenting at the 2022 AAEA Annual Meeting
This material is based upon work that is supported by the National Institute of Food and Agriculture, U.S. Department of Agriculture, under award number 2021-68006-34029.<br>
02
STOCKS OF WEALTH AND
COMMUNITY DEVELOPMENT Growing body of literature that discusses the importance of understanding community assets in evaluating the potential of development policies.
Pender, Marré, and Reeder (2012) describe a community’s endowment of wealth as consisting of multiple types of assets - human, financial, social, and cultural capital.
Together, the net worth of these assets form the stocks of wealth (also referred to as community capitals).
Asset-based frameworks with emphasis on local assets and actors.
Also used to understand rural impacts of investments in the local food systems (Schmit et al., 2021).<br>
Pender, Marré, and Reeder (2012) describe a community’s endowment of wealth as consisting of multiple types of assets - human, financial, social, and cultural capital.
Together, the net worth of these assets form the stocks of wealth (also referred to as community capitals).
Asset-based frameworks with emphasis on local assets and actors.
Also used to understand rural impacts of investments in the local food systems (Schmit et al., 2021).<br>
03
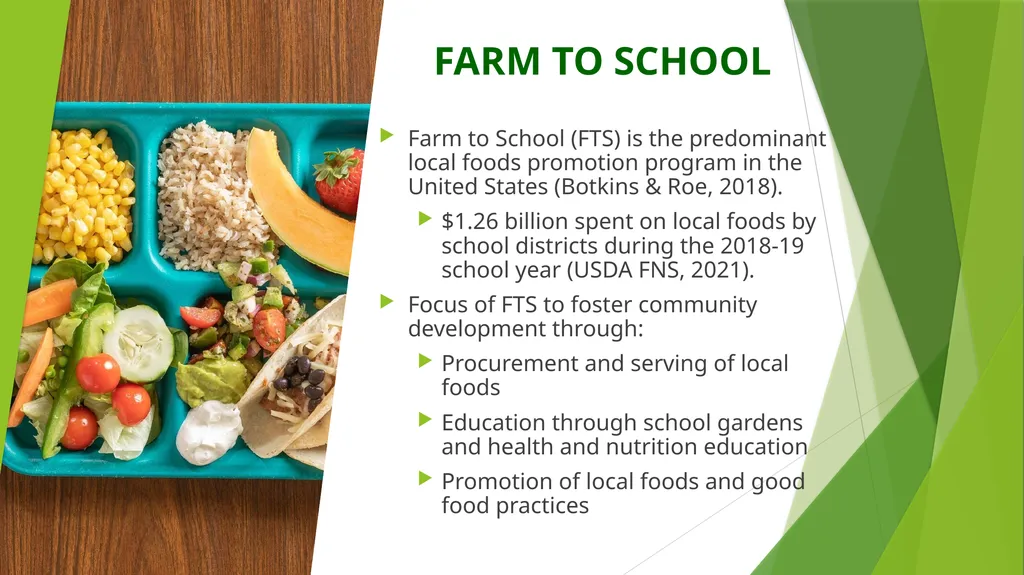
FARM TO SCHOOL Farm to School (FTS) is the predominant local foods promotion program in the United States (Botkins & Roe, 2018).
$1.26 billion spent on local foods by school districts during the 2018-19 school year (USDA FNS, 2021).
Focus of FTS to foster community development through:
Procurement and serving of local foods
Education through school gardens and health and nutrition education
Promotion of local foods and good food practices<br>
$1.26 billion spent on local foods by school districts during the 2018-19 school year (USDA FNS, 2021).
Focus of FTS to foster community development through:
Procurement and serving of local foods
Education through school gardens and health and nutrition education
Promotion of local foods and good food practices<br>
04
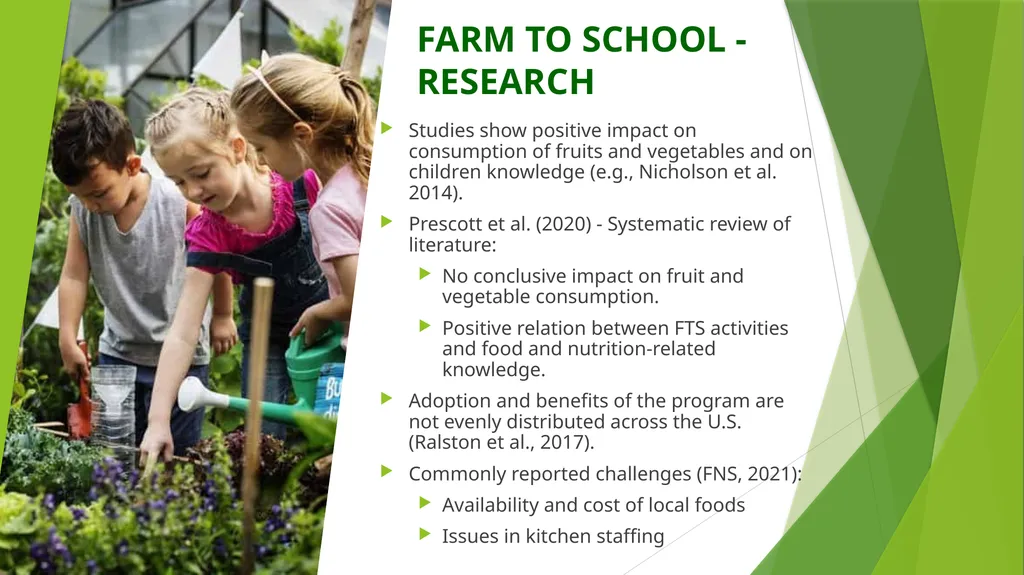
FARM TO SCHOOL - RESEARCH Studies show positive impact on consumption of fruits and vegetables and on children knowledge (e.g., Nicholson et al. 2014).
Prescott et al. (2020) - Systematic review of literature:
No conclusive impact on fruit and vegetable consumption.
Positive relation between FTS activities and food and nutrition-related knowledge.
Adoption and benefits of the program are not evenly distributed across the U.S. (Ralston et al., 2017).
Commonly reported challenges (FNS, 2021):
Availability and cost of local foods
Issues in kitchen staffing<br>
Prescott et al. (2020) - Systematic review of literature:
No conclusive impact on fruit and vegetable consumption.
Positive relation between FTS activities and food and nutrition-related knowledge.
Adoption and benefits of the program are not evenly distributed across the U.S. (Ralston et al., 2017).
Commonly reported challenges (FNS, 2021):
Availability and cost of local foods
Issues in kitchen staffing<br>
05
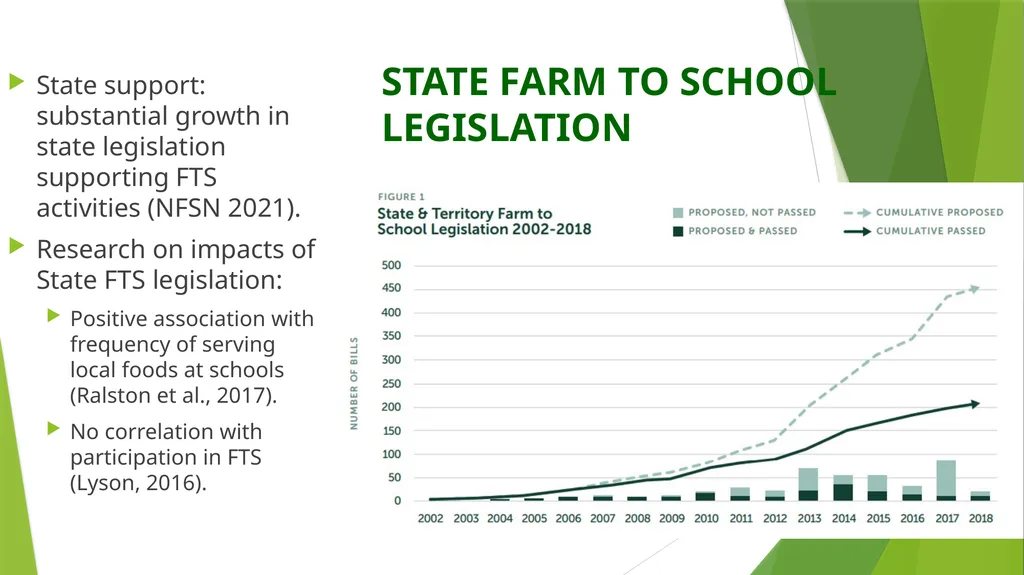
STATE FARM TO SCHOOL LEGISLATION State support: substantial growth in state legislation supporting FTS activities (NFSN 2021).
Research on impacts of State FTS legislation:
Positive association with frequency of serving local foods at schools (Ralston et al., 2017).
No correlation with participation in FTS (Lyson, 2016).<br>
Research on impacts of State FTS legislation:
Positive association with frequency of serving local foods at schools (Ralston et al., 2017).
No correlation with participation in FTS (Lyson, 2016).<br>
06
RESEARCH QUESTION Are there associations between stocks of community wealth, State Farm to School Policies, and intensity of Farm to School program participation? Is there a relationship between community capitals and FTS participation?
Given the stocks of wealth, how do state legislation focused on procurement and education activities affect intensity of program participation?
Does intensity of program adoption by School Food Authorities have a spillover effect?<br>
Given the stocks of wealth, how do state legislation focused on procurement and education activities affect intensity of program participation?
Does intensity of program adoption by School Food Authorities have a spillover effect?<br>
07
DATA AND STUDY VARIABLES Database on stocks of rural wealth and capital stock indices
Created by Schmit et al. (2021)
County-level indicators associated with six types of capital: built, cultural, financial, human, natural, and social.
Farm to School Census 2019.
Census conducted by U.S. Department of Agriculture’s Food and Nutrition Service (USDA FNS) for school year (SY) 2018-19.
12,634 School Food Authorities (SFAs) completed the Census.
8,393 SFAs reported participating in FTS activities in SY 2018-19.
State Farm to School Policy Handbook (2002-2018)
Developed by The Center for Agriculture and Food Systems at Vermont Law School (CAFS), and the National Farm to School Network (NFSN)
Summarizes FTS legislation for all states and District of Columbia.<br>
Created by Schmit et al. (2021)
County-level indicators associated with six types of capital: built, cultural, financial, human, natural, and social.
Farm to School Census 2019.
Census conducted by U.S. Department of Agriculture’s Food and Nutrition Service (USDA FNS) for school year (SY) 2018-19.
12,634 School Food Authorities (SFAs) completed the Census.
8,393 SFAs reported participating in FTS activities in SY 2018-19.
State Farm to School Policy Handbook (2002-2018)
Developed by The Center for Agriculture and Food Systems at Vermont Law School (CAFS), and the National Farm to School Network (NFSN)
Summarizes FTS legislation for all states and District of Columbia.<br>
08
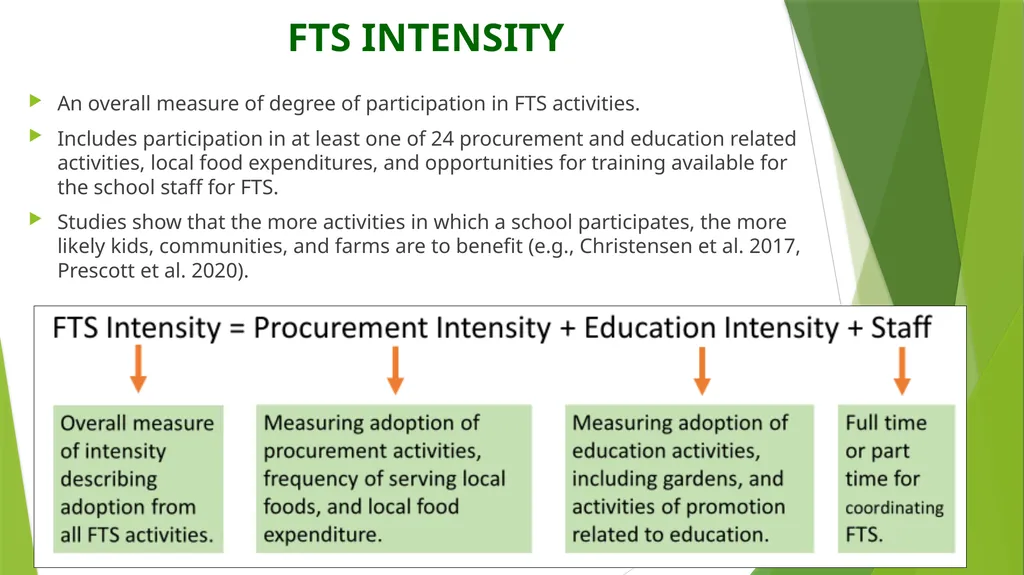
FTS INTENSITY An overall measure of degree of participation in FTS activities.
Includes participation in at least one of 24 procurement and education related activities, local food expenditures, and opportunities for training available for the school staff for FTS.
Studies show that the more activities in which a school participates, the more likely kids, communities, and farms are to benefit (e.g., Christensen et al. 2017, Prescott et al. 2020).<br>
Includes participation in at least one of 24 procurement and education related activities, local food expenditures, and opportunities for training available for the school staff for FTS.
Studies show that the more activities in which a school participates, the more likely kids, communities, and farms are to benefit (e.g., Christensen et al. 2017, Prescott et al. 2020).<br>
09
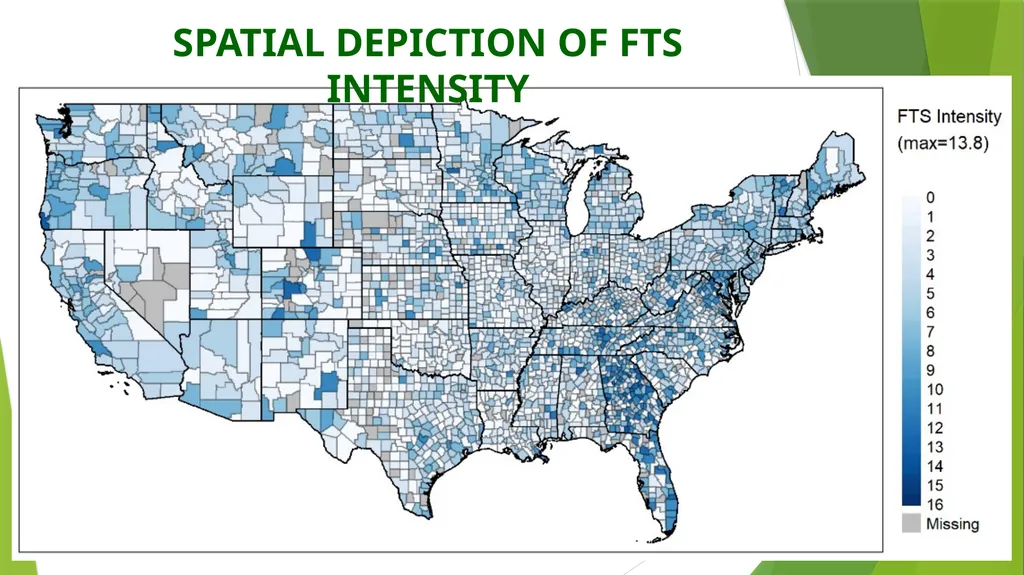
SPATIAL DEPICTION OF FTS INTENSITY<br>
10
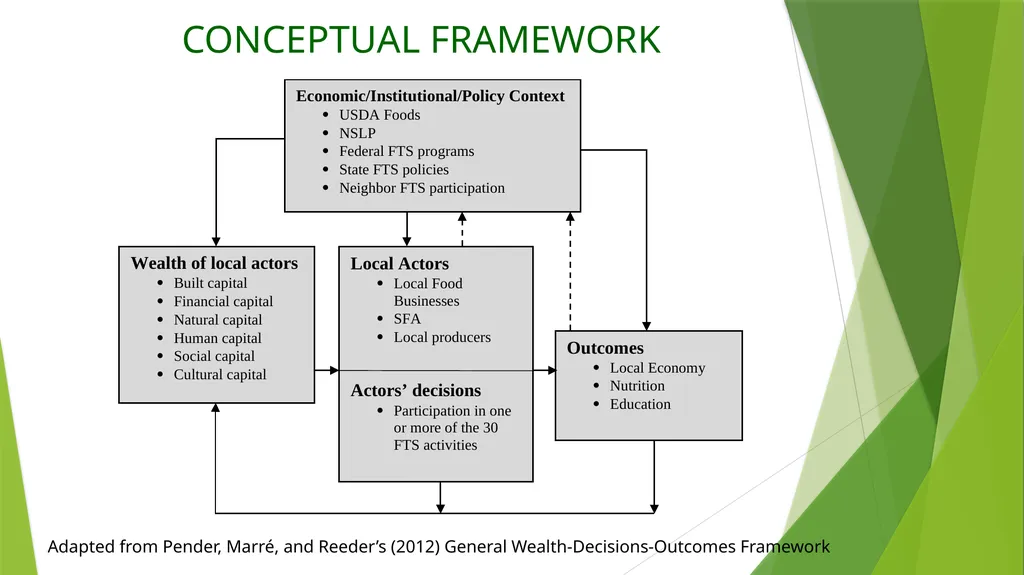
CONCEPTUAL FRAMEWORK Adapted from Pender, Marré, and Reeder’s (2012) General Wealth-Decisions-Outcomes Framework<br>
11
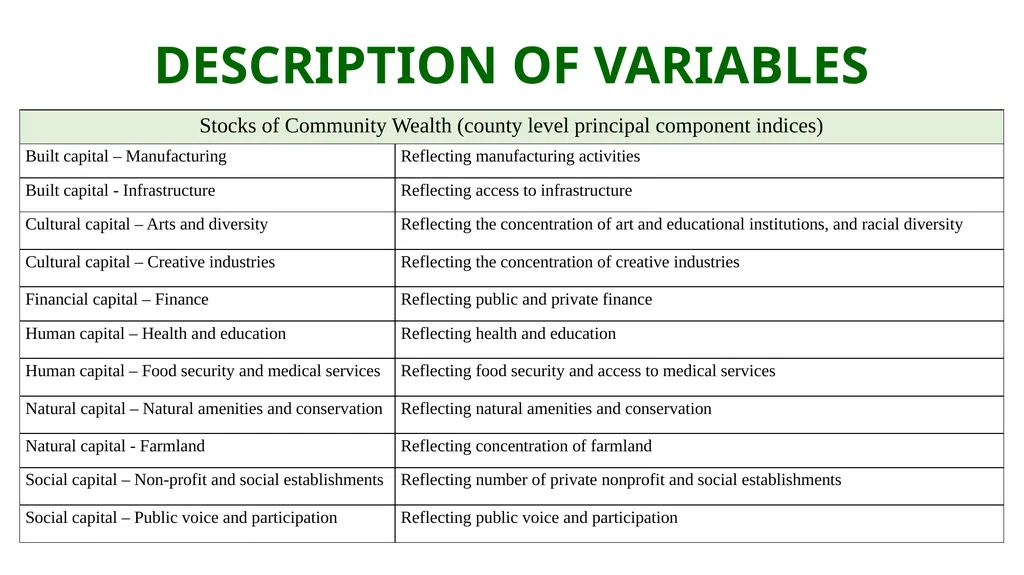
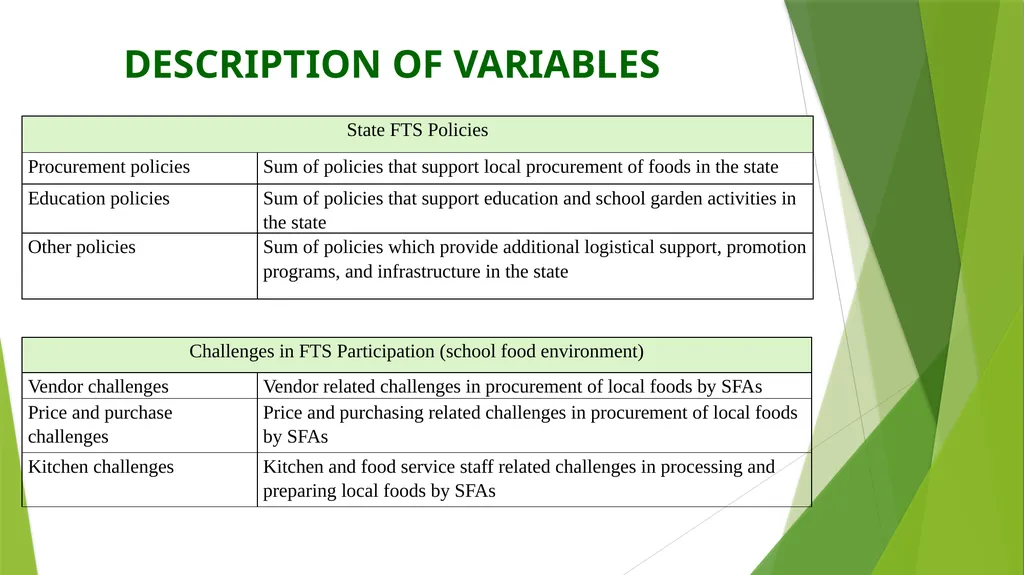
DESCRIPTION OF VARIABLES<br>
12
DESCRIPTION OF VARIABLES<br>
13
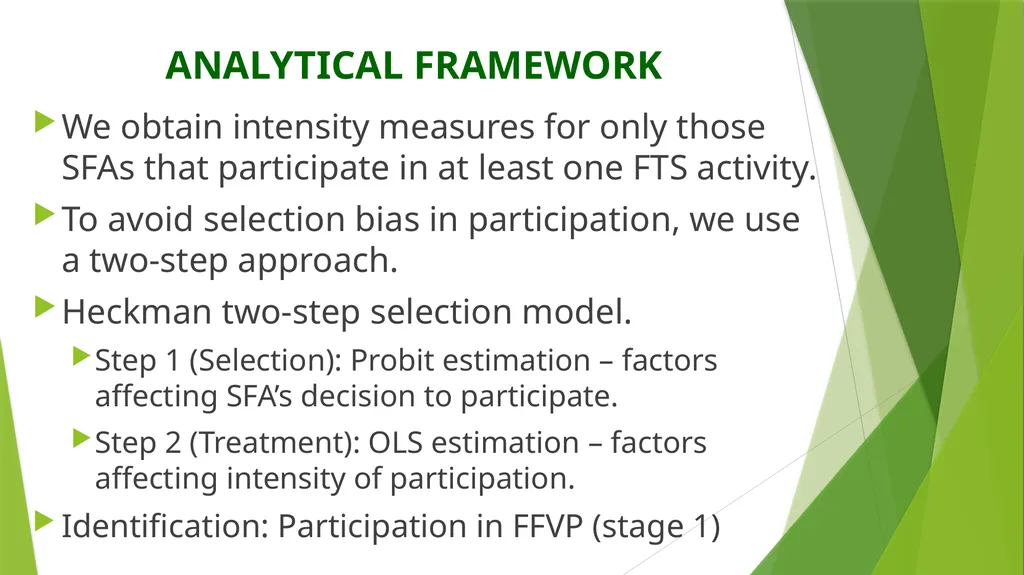
ANALYTICAL FRAMEWORK We obtain intensity measures for only those SFAs that participate in at least one FTS activity.
To avoid selection bias in participation, we use a two-step approach.
Heckman two-step selection model.
Step 1 (Selection): Probit estimation – factors affecting SFA’s decision to participate.
Step 2 (Treatment): OLS estimation – factors affecting intensity of participation.
Identification: Participation in FFVP (stage 1)<br>
To avoid selection bias in participation, we use a two-step approach.
Heckman two-step selection model.
Step 1 (Selection): Probit estimation – factors affecting SFA’s decision to participate.
Step 2 (Treatment): OLS estimation – factors affecting intensity of participation.
Identification: Participation in FFVP (stage 1)<br>
14
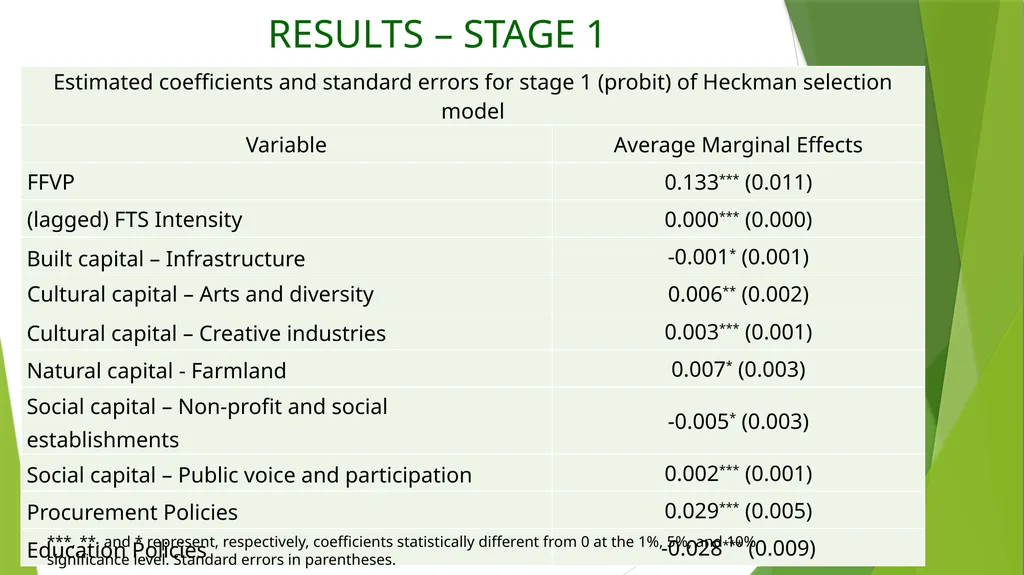
RESULTS – STAGE 1 ***, **, and * represent, respectively, coefficients statistically different from 0 at the 1%, 5%, and 10% significance level. Standard errors in parentheses.<br>
15
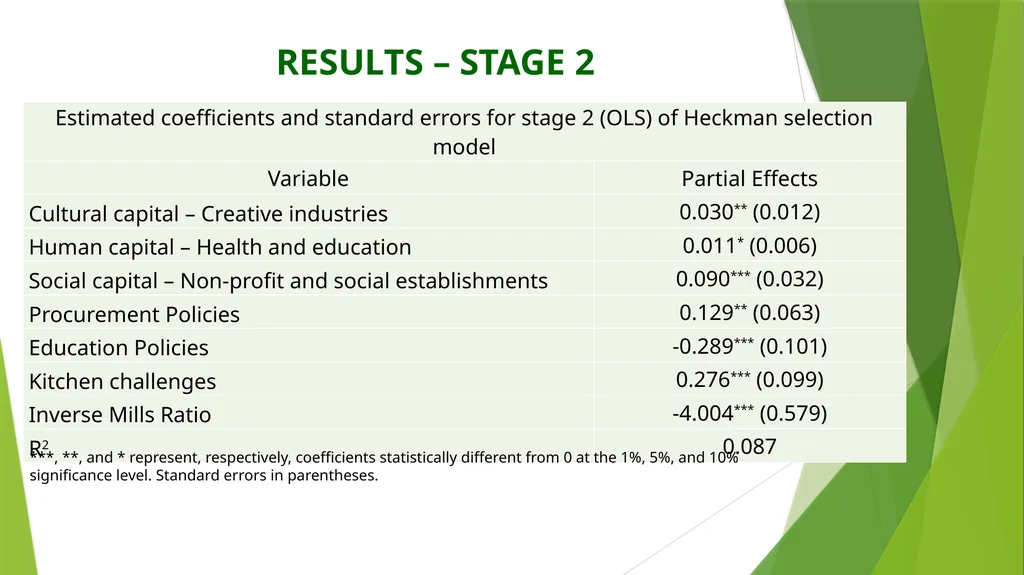
RESULTS – STAGE 2 ***, **, and * represent, respectively, coefficients statistically different from 0 at the 1%, 5%, and 10% significance level. Standard errors in parentheses.<br>
16
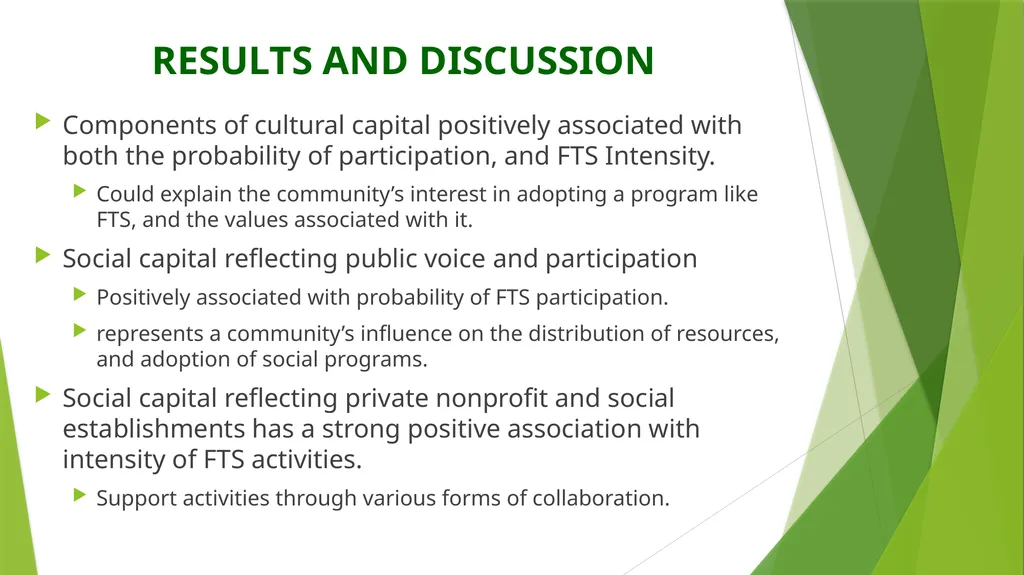
RESULTS AND DISCUSSION Components of cultural capital positively associated with both the probability of participation, and FTS Intensity.
Could explain the community’s interest in adopting a program like FTS, and the values associated with it.
Social capital reflecting public voice and participation
Positively associated with probability of FTS participation.
represents a community’s influence on the distribution of resources, and adoption of social programs.
Social capital reflecting private nonprofit and social establishments has a strong positive association with intensity of FTS activities.
Support activities through various forms of collaboration.<br>
Could explain the community’s interest in adopting a program like FTS, and the values associated with it.
Social capital reflecting public voice and participation
Positively associated with probability of FTS participation.
represents a community’s influence on the distribution of resources, and adoption of social programs.
Social capital reflecting private nonprofit and social establishments has a strong positive association with intensity of FTS activities.
Support activities through various forms of collaboration.<br>
17
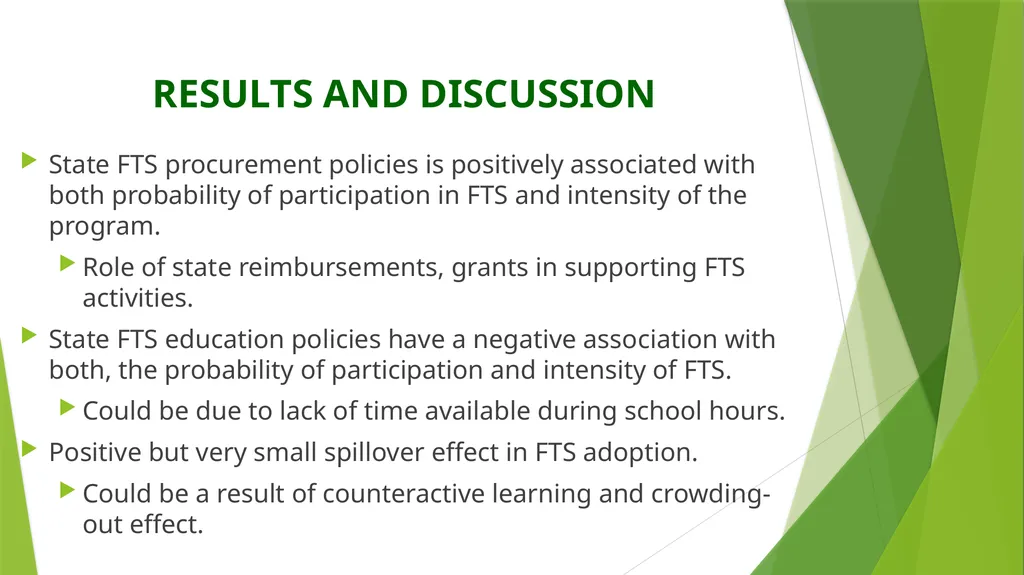
RESULTS AND DISCUSSION State FTS procurement policies is positively associated with both probability of participation in FTS and intensity of the program.
Role of state reimbursements, grants in supporting FTS activities.
State FTS education policies have a negative association with both, the probability of participation and intensity of FTS.
Could be due to lack of time available during school hours.
Positive but very small spillover effect in FTS adoption.
Could be a result of counteractive learning and crowding-out effect.<br>
Role of state reimbursements, grants in supporting FTS activities.
State FTS education policies have a negative association with both, the probability of participation and intensity of FTS.
Could be due to lack of time available during school hours.
Positive but very small spillover effect in FTS adoption.
Could be a result of counteractive learning and crowding-out effect.<br>
18
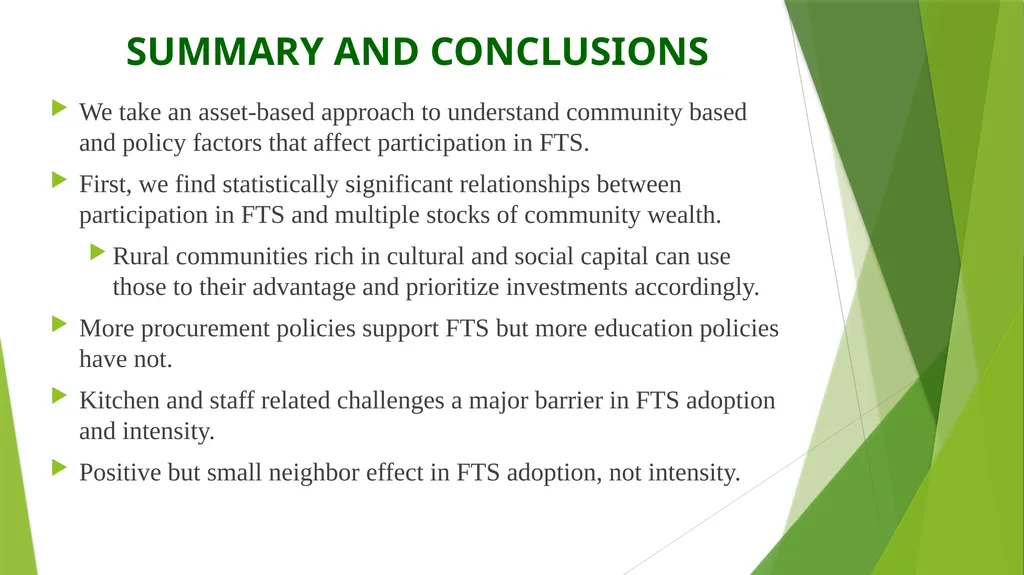
SUMMARY AND CONCLUSIONS We take an asset-based approach to understand community based and policy factors that affect participation in FTS.
First, we find statistically significant relationships between participation in FTS and multiple stocks of community wealth.
Rural communities rich in cultural and social capital can use those to their advantage and prioritize investments accordingly.
More procurement policies support FTS but more education policies have not.
Kitchen and staff related challenges a major barrier in FTS adoption and intensity.
Positive but small neighbor effect in FTS adoption, not intensity.<br>
First, we find statistically significant relationships between participation in FTS and multiple stocks of community wealth.
Rural communities rich in cultural and social capital can use those to their advantage and prioritize investments accordingly.
More procurement policies support FTS but more education policies have not.
Kitchen and staff related challenges a major barrier in FTS adoption and intensity.
Positive but small neighbor effect in FTS adoption, not intensity.<br>
19
Thank you for engaging in the presentation.
Please feel free to write to us with feedback and/or questions:
Pratyoosh Kashyap
pratyoosh.kashyap@colostate.edu
Becca Jablonski
becca.jablonski@colostate.edu
Allie Bauman
allie.bauman@colostate.edu<br>
Please feel free to write to us with feedback and/or questions:
Pratyoosh Kashyap
pratyoosh.kashyap@colostate.edu
Becca Jablonski
becca.jablonski@colostate.edu
Allie Bauman
allie.bauman@colostate.edu<br>
20
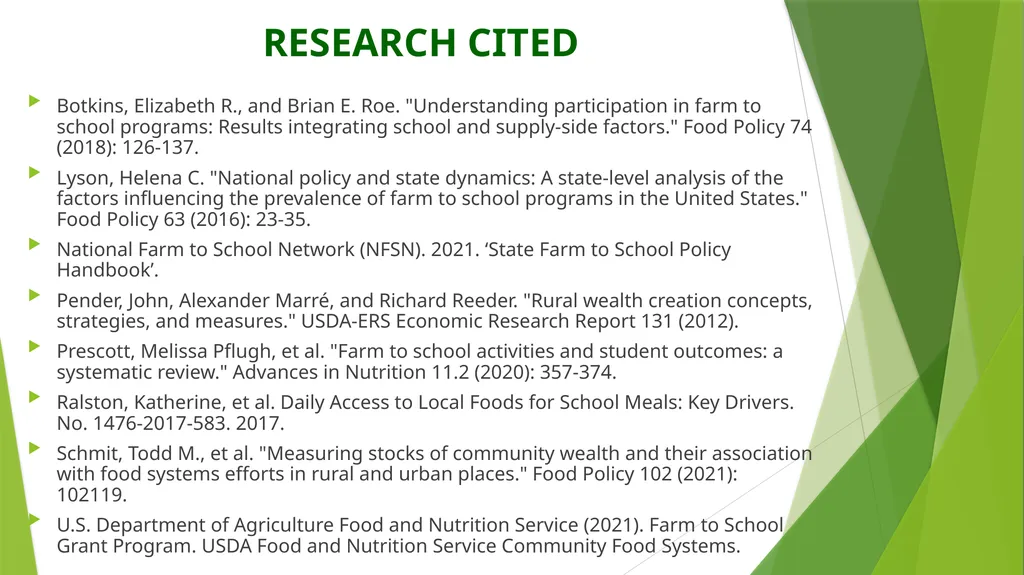
RESEARCH CITED Botkins, Elizabeth R., and Brian E. Roe. "Understanding participation in farm to school programs: Results integrating school and supply-side factors." Food Policy 74 (2018): 126-137.
Lyson, Helena C. "National policy and state dynamics: A state-level analysis of the factors influencing the prevalence of farm to school programs in the United States." Food Policy 63 (2016): 23-35.
National Farm to School Network (NFSN). 2021. ‘State Farm to School Policy Handbook’.
Pender, John, Alexander Marré, and Richard Reeder. "Rural wealth creation concepts, strategies, and measures." USDA-ERS Economic Research Report 131 (2012).
Prescott, Melissa Pflugh, et al. "Farm to school activities and student outcomes: a systematic review." Advances in Nutrition 11.2 (2020): 357-374.
Ralston, Katherine, et al. Daily Access to Local Foods for School Meals: Key Drivers. No. 1476-2017-583. 2017.
Schmit, Todd M., et al. "Measuring stocks of community wealth and their association with food systems efforts in rural and urban places." Food Policy 102 (2021): 102119.
U.S. Department of Agriculture Food and Nutrition Service (2021). Farm to School Grant Program. USDA Food and Nutrition Service Community Food Systems.<br>
Lyson, Helena C. "National policy and state dynamics: A state-level analysis of the factors influencing the prevalence of farm to school programs in the United States." Food Policy 63 (2016): 23-35.
National Farm to School Network (NFSN). 2021. ‘State Farm to School Policy Handbook’.
Pender, John, Alexander Marré, and Richard Reeder. "Rural wealth creation concepts, strategies, and measures." USDA-ERS Economic Research Report 131 (2012).
Prescott, Melissa Pflugh, et al. "Farm to school activities and student outcomes: a systematic review." Advances in Nutrition 11.2 (2020): 357-374.
Ralston, Katherine, et al. Daily Access to Local Foods for School Meals: Key Drivers. No. 1476-2017-583. 2017.
Schmit, Todd M., et al. "Measuring stocks of community wealth and their association with food systems efforts in rural and urban places." Food Policy 102 (2021): 102119.
U.S. Department of Agriculture Food and Nutrition Service (2021). Farm to School Grant Program. USDA Food and Nutrition Service Community Food Systems.<br>
21
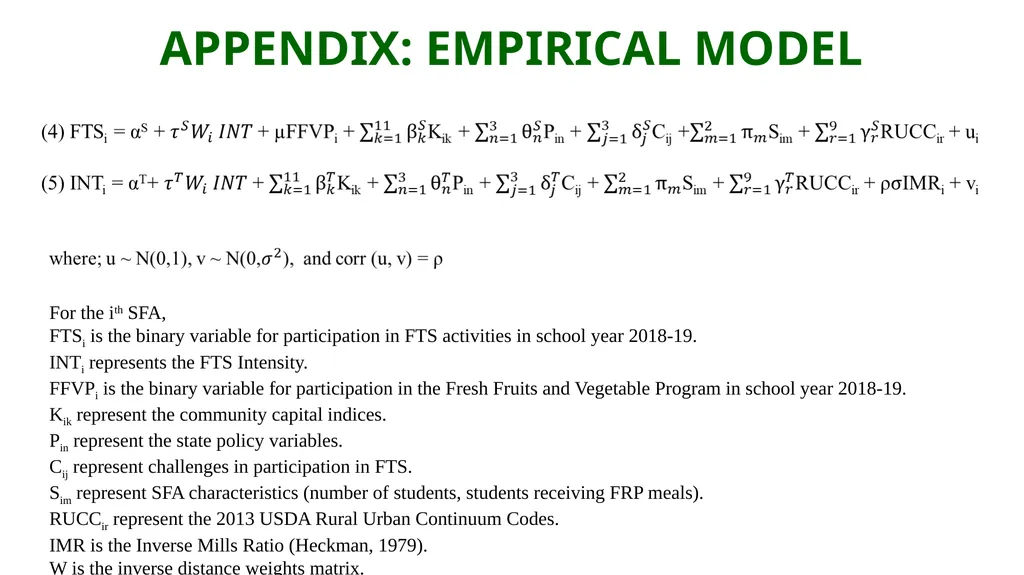
APPENDIX: EMPIRICAL MODEL For the ith SFA,
FTSi is the binary variable for participation in FTS activities in school year 2018-19.
INTi represents the FTS Intensity.
FFVPi is the binary variable for participation in the Fresh Fruits and Vegetable Program in school year 2018-19.
Kik represent the community capital indices.
Pin represent the state policy variables.
Cij represent challenges in participation in FTS.
Sim represent SFA characteristics (number of students, students receiving FRP meals).
RUCCir represent the 2013 USDA Rural Urban Continuum Codes.
IMR is the Inverse Mills Ratio (Heckman, 1979).
W is the inverse distance weights matrix.<br>
FTSi is the binary variable for participation in FTS activities in school year 2018-19.
INTi represents the FTS Intensity.
FFVPi is the binary variable for participation in the Fresh Fruits and Vegetable Program in school year 2018-19.
Kik represent the community capital indices.
Pin represent the state policy variables.
Cij represent challenges in participation in FTS.
Sim represent SFA characteristics (number of students, students receiving FRP meals).
RUCCir represent the 2013 USDA Rural Urban Continuum Codes.
IMR is the Inverse Mills Ratio (Heckman, 1979).
W is the inverse distance weights matrix.<br>