Failure Investigation Process Fault Tree Analysis Failure Investigation Process Examples of tools that exist to investigate failures: MFC tends to use Fault Tree; suppliers tend to use Fishbone Charts Fishbone Chart Fault Tree Fault Tree:
"Failure Investigation Process Fault Tree Analysis" is the property of its rightful owner. Permission is granted to
download and print the materials on this website for personal, non-commercial use only, and to display it
on your personal computer provided you do not modify the materials and that you retain all copyright
notices contained in the materials. By downloading content from our website, you accept the terms of this
agreement.
Presentation Transcript
01
Failure Investigation Process Fault Tree Analysis<br>
02
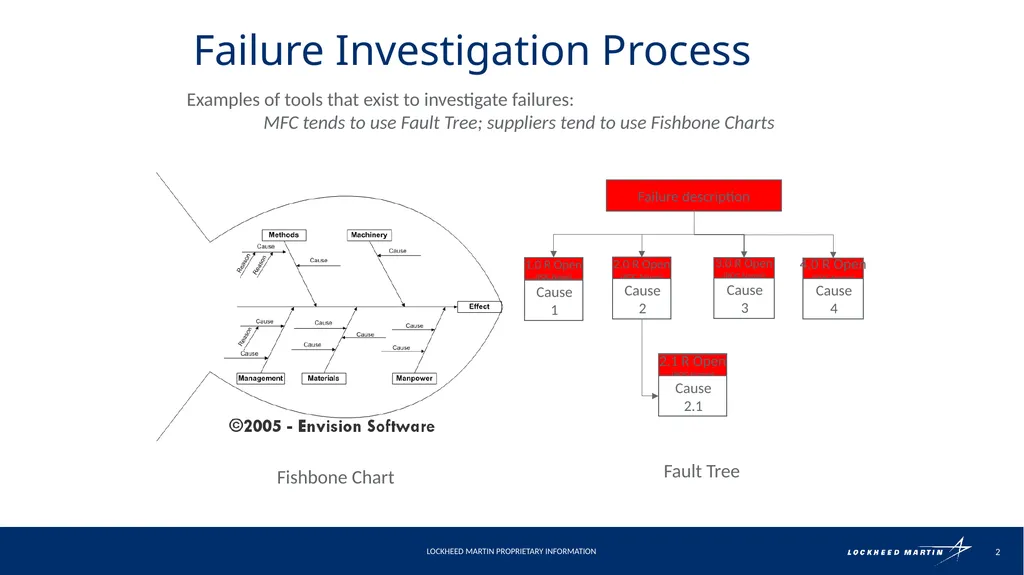
Failure Investigation Process Examples of tools that exist to investigate failures:
MFC tends to use Fault Tree; suppliers tend to use Fishbone Charts Fishbone Chart Fault Tree<br>
03
Fault Tree: What it is It is a method for focusing the team on identifying root cause of a failure so that appropriate corrective action can be applied to mitigate repeat failures of the same nature
It is a TOOL that should be used often; the more often it used, the faster the process of using it becomes second nature
As a tool, it enhances technical interchange between users and suppliers of subsystems
It provides a repository for design details and test results that can easily be accessed in the future
It is NOT intended to assign blame
It is NOT a panacea; conclusions drawn are only as good as the input criteria
It is NOT absolute; because of the complexity of some systems, it may not present a single ROOT CAUSE<br>
04
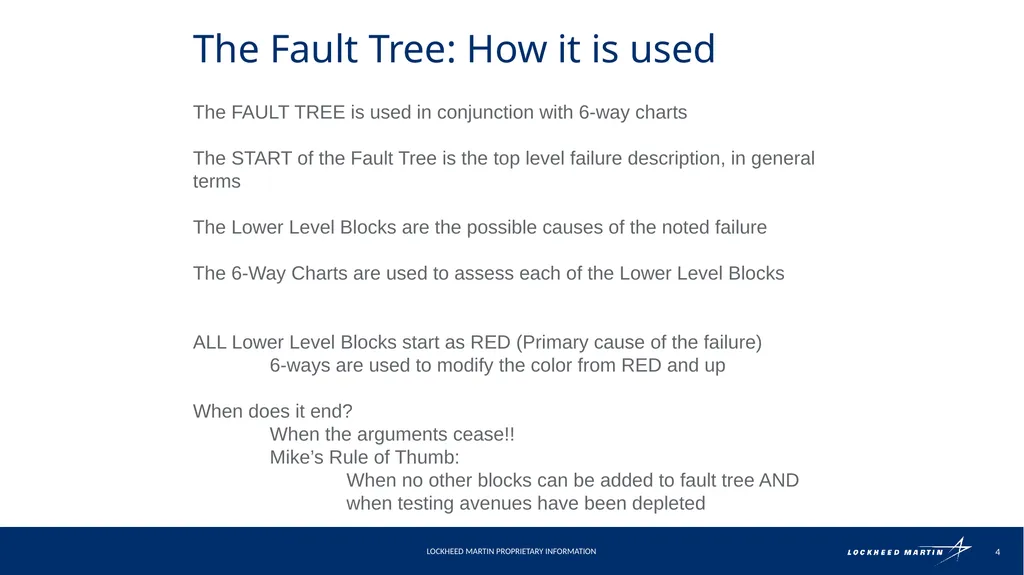
The Fault Tree: How it is used The FAULT TREE is used in conjunction with 6-way charts
The START of the Fault Tree is the top level failure description, in general terms
The Lower Level Blocks are the possible causes of the noted failure
The 6-Way Charts are used to assess each of the Lower Level Blocks
ALL Lower Level Blocks start as RED (Primary cause of the failure)
6-ways are used to modify the color from RED and up
When does it end?
When the arguments cease!!
Mike’s Rule of Thumb:
When no other blocks can be added to fault tree AND when testing avenues have been depleted<br>
05
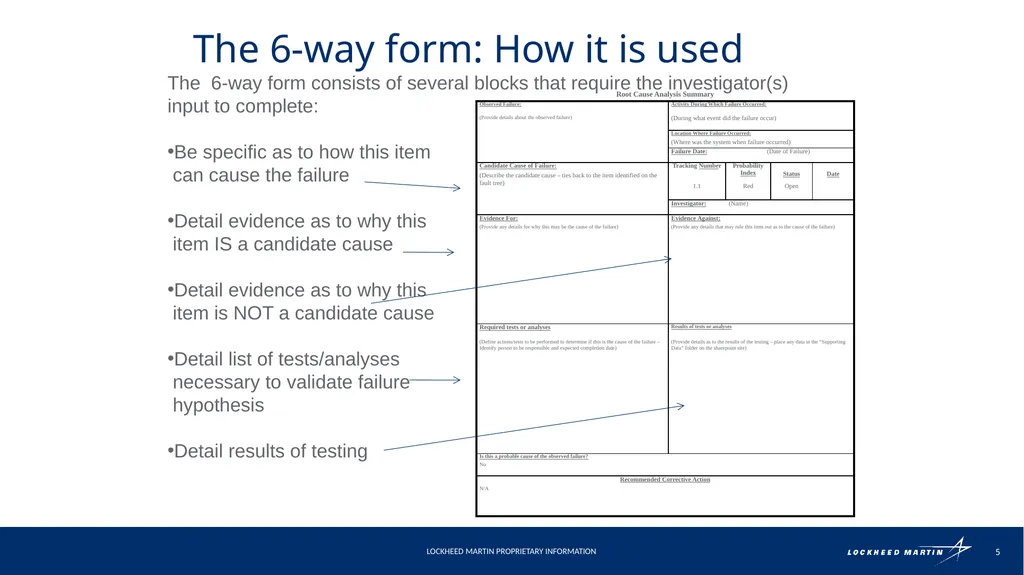
The 6-way form: How it is used The 6-way form consists of several blocks that require the investigator(s) input to complete:
Be specific as to how this item
can cause the failure
Detail evidence as to why this
item IS a candidate cause
Detail evidence as to why this
item is NOT a candidate cause
Detail list of tests/analyses
necessary to validate failure
hypothesis