Fall 2021 - Lecture 2 1 Descriptive Statistics Part 2 Nina Gunnes September 9, 2021 09092021 Center, spread, and shape of a distribution Simple characteristics of the distribution of a variable Summary statistics Describing the data
"Fall 2021 - Lecture 2 1 Descriptive Statistics –" is the property of its rightful owner. Permission is granted to
download and print the materials on this website for personal, non-commercial use only, and to display it
on your personal computer provided you do not modify the materials and that you retain all copyright
notices contained in the materials. By downloading content from our website, you accept the terms of this
agreement.
Presentation Transcript
01
Fall 2021 - Lecture 2 1 Descriptive Statistics – Part 2 Nina Gunnes
September 9, 2021 09/09/2021<br>
02
Center, spread, and shape of a distribution Simple characteristics of the distribution of a variable
Summary statistics
Describing the data beyond frequency tables and histograms
Two important features of a distribution
Central tendency
Dispersion, variability, or spread
Valuable information about the shape of a distribution Fall 2021 - Lecture 2 2 09/09/2021<br>
03
Measures of central tendency Describing the center, or central location, of a distribution
Colloquially, sometimes called averages
The tendency of data to cluster around a middle value
Three common measures
(Arithmetic) mean
Median
Mode
Many others (https://en.wikipedia.org/wiki/Central_tendency) Fall 2021 - Lecture 2 3 09/09/2021<br>
04
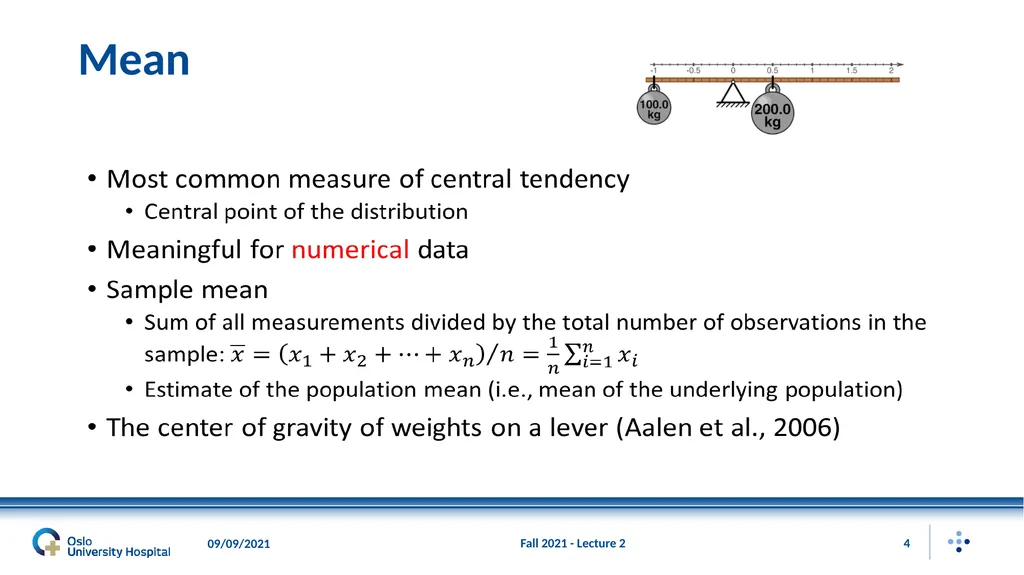
Mean Fall 2021 - Lecture 2 4 09/09/2021<br>
05
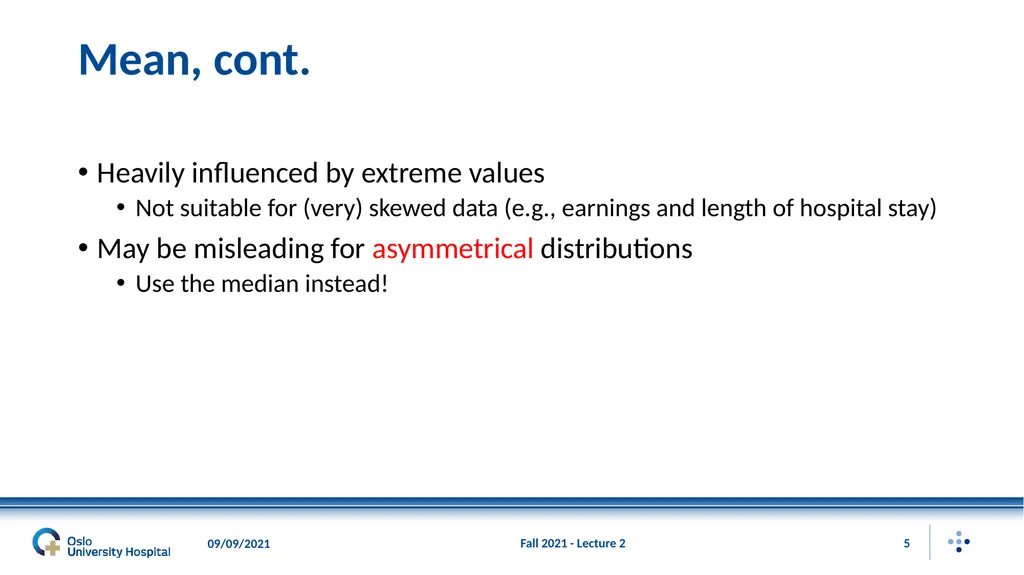
Mean, cont. Heavily influenced by extreme values
Not suitable for (very) skewed data (e.g., earnings and length of hospital stay)
May be misleading for asymmetrical distributions
Use the median instead! Fall 2021 - Lecture 2 5 09/09/2021<br>
06
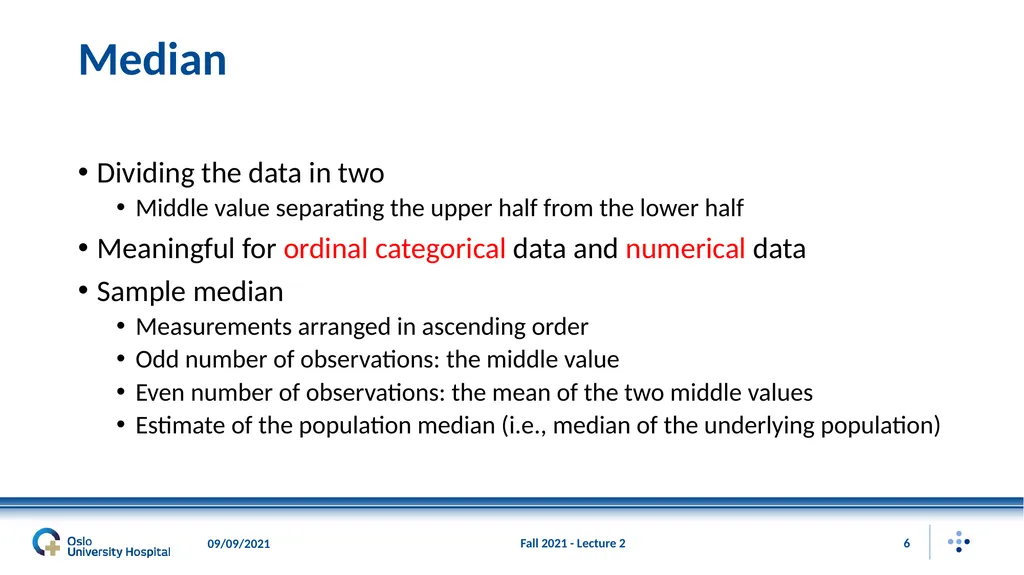
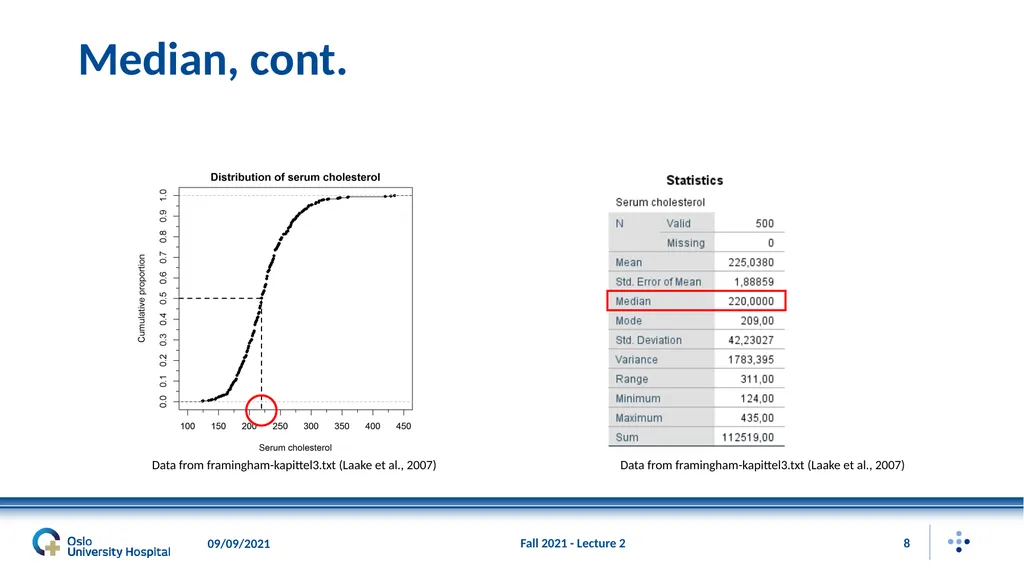
Median Dividing the data in two
Middle value separating the upper half from the lower half
Meaningful for ordinal categorical data and numerical data
Sample median
Measurements arranged in ascending order
Odd number of observations: the middle value
Even number of observations: the mean of the two middle values
Estimate of the population median (i.e., median of the underlying population) Fall 2021 - Lecture 2 6 09/09/2021<br>
07
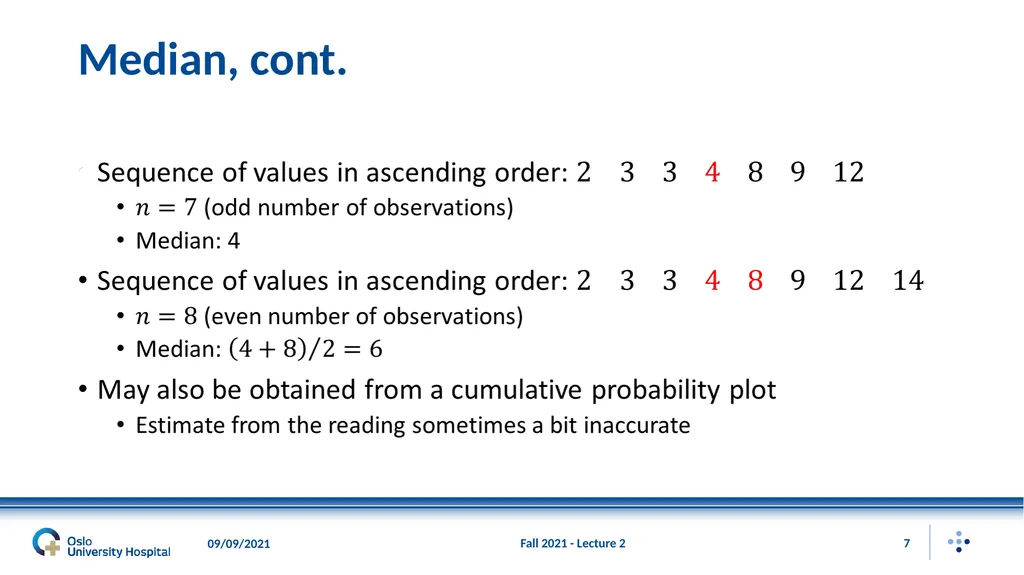
Median, cont. Fall 2021 - Lecture 2 7 09/09/2021<br>
08
Median, cont. Fall 2021 - Lecture 2 8 Data from framingham-kapittel3.txt (Laake et al., 2007) Data from framingham-kapittel3.txt (Laake et al., 2007) 09/09/2021<br>
09
Median, cont. Not sensitive to extreme values
Preferred measure of central tendency in a skewed distribution
Difference between mean and median expressing skewness
May be determined by inspecting a histogram
Mean and median coinciding exactly: symmetrical distribution
Median deviating from the mean: asymmetrical distribution Fall 2021 - Lecture 2 9 09/09/2021<br>
10
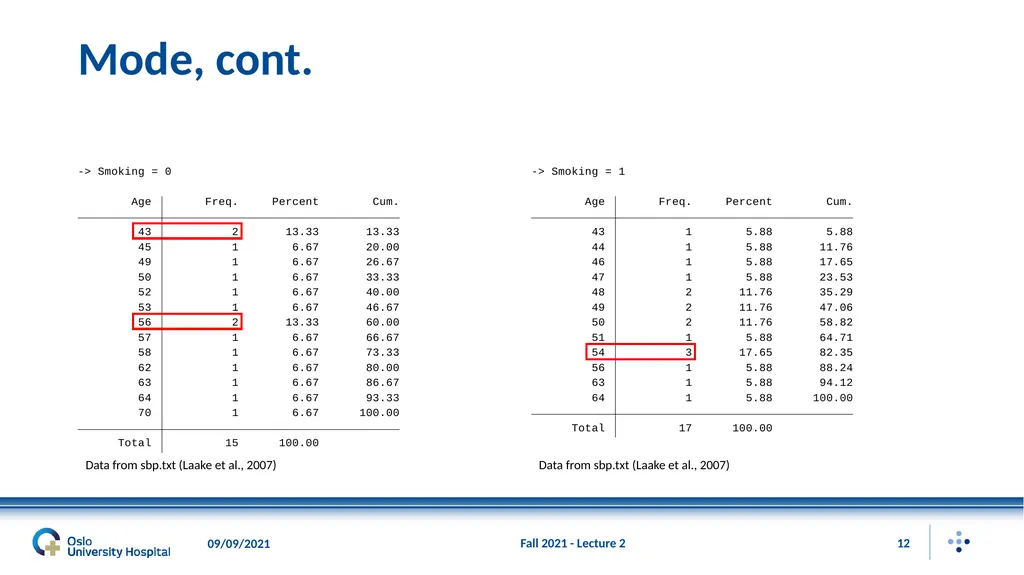
Mode Discrete distribution
Values at which the probability mass function takes its maximum value(s)
Continuous distribution
Value(s) at which the probability density function has a (local) maximum
Useful for nominal and ordinal categorical data and numerical data
Sample mode
Most frequently occurring value(s)
Estimate of the population mode (i.e., mode of the underlying population) Fall 2021 - Lecture 2 10 09/09/2021<br>
11
Mode, cont. Obtained by making a histogram for continuous data
Grouping the data into intervals and assigning a frequency to each interval
Corresponding to the midpoint of the interval with the highest bin
Sensitive to the choice of interval width for small and medium-sized samples (should not be too narrow nor too wide)
Symmetrical unimodal distributions (e.g., the normal distribution)
Population mean (if defined), median, and mode all coinciding
Sample mean used as an estimate of the population mode Fall 2021 - Lecture 2 11 09/09/2021<br>
12
Mode, cont. Fall 2021 - Lecture 2 12 Data from sbp.txt (Laake et al., 2007) Data from sbp.txt (Laake et al., 2007) 09/09/2021<br>
13
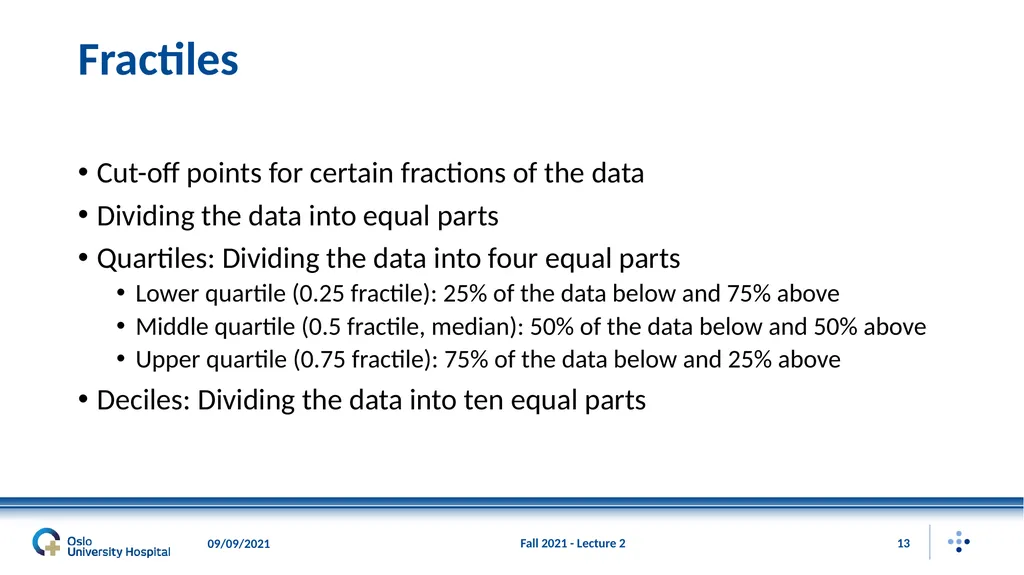
Fractiles Cut-off points for certain fractions of the data
Dividing the data into equal parts
Quartiles: Dividing the data into four equal parts
Lower quartile (0.25 fractile): 25% of the data below and 75% above
Middle quartile (0.5 fractile, median): 50% of the data below and 50% above
Upper quartile (0.75 fractile): 75% of the data below and 25% above
Deciles: Dividing the data into ten equal parts Fall 2021 - Lecture 2 13 09/09/2021<br>
14
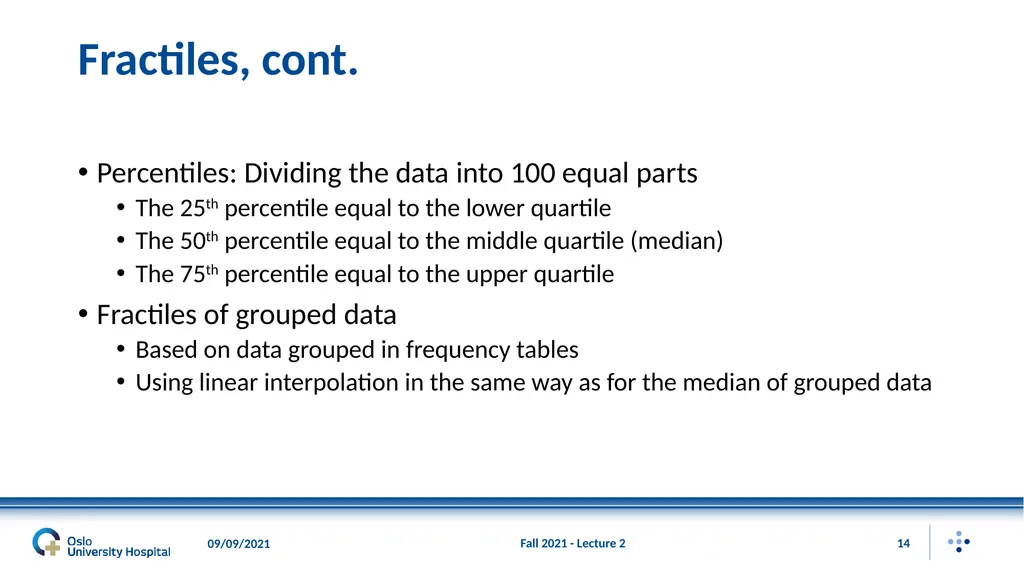
Fractiles, cont. Percentiles: Dividing the data into 100 equal parts
The 25th percentile equal to the lower quartile
The 50th percentile equal to the middle quartile (median)
The 75th percentile equal to the upper quartile
Fractiles of grouped data
Based on data grouped in frequency tables
Using linear interpolation in the same way as for the median of grouped data Fall 2021 - Lecture 2 14 09/09/2021<br>
15
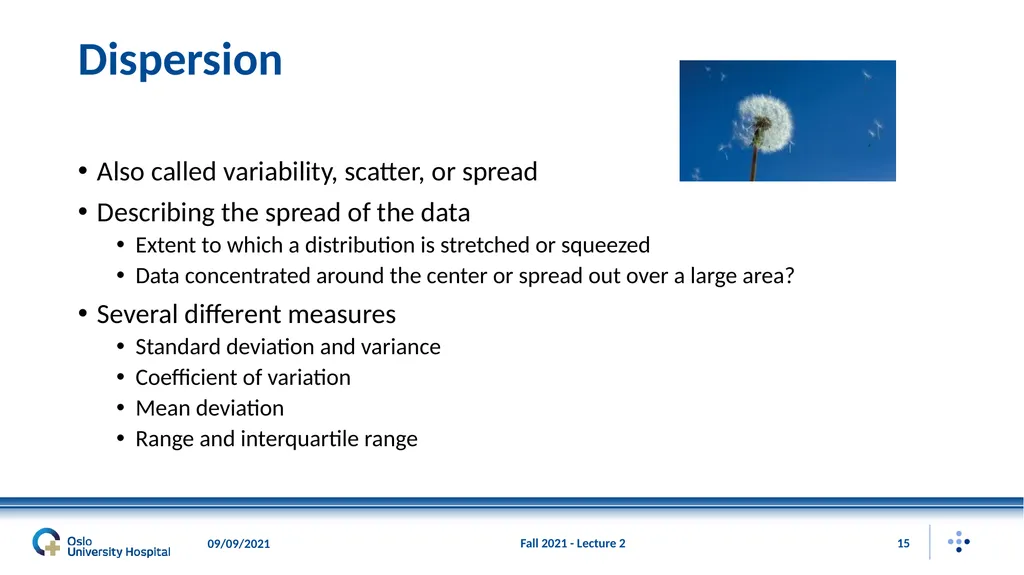
Dispersion Also called variability, scatter, or spread
Describing the spread of the data
Extent to which a distribution is stretched or squeezed
Data concentrated around the center or spread out over a large area?
Several different measures
Standard deviation and variance
Coefficient of variation
Mean deviation
Range and interquartile range Fall 2021 - Lecture 2 15 09/09/2021<br>
16
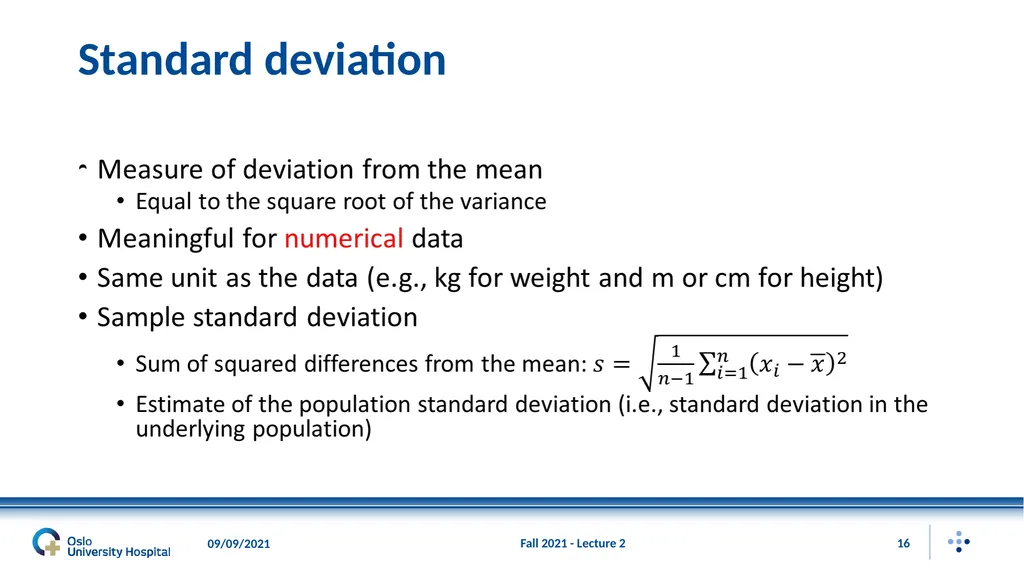
Standard deviation Fall 2021 - Lecture 2 16 09/09/2021<br>
17
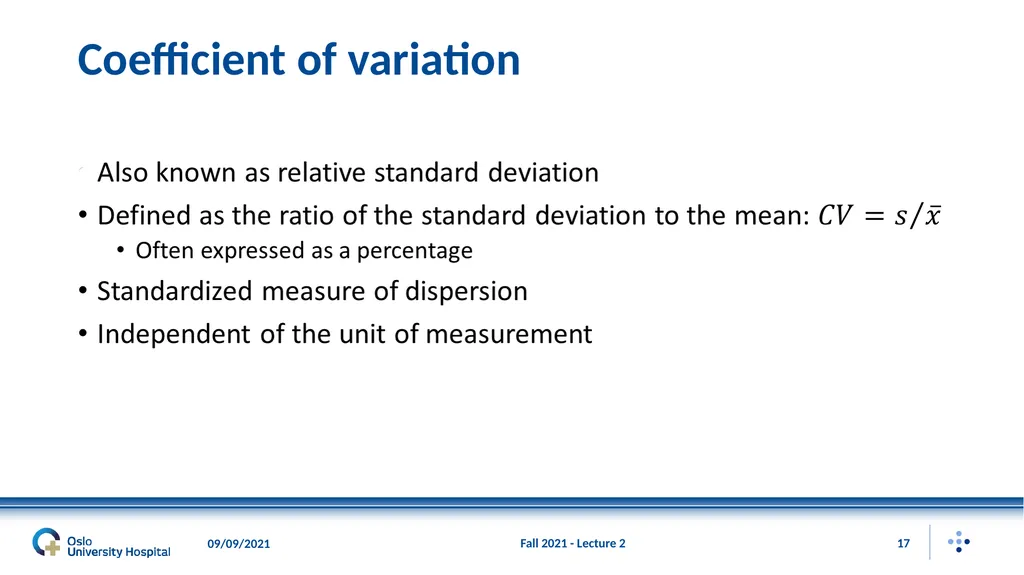
Coefficient of variation Fall 2021 - Lecture 2 17 09/09/2021<br>
18
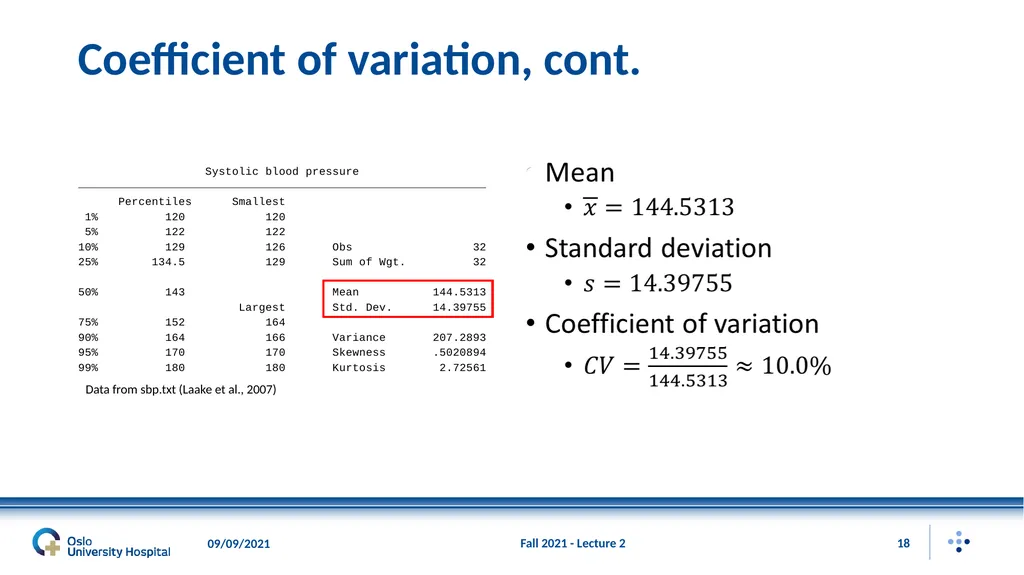
Coefficient of variation, cont. Fall 2021 - Lecture 2 18 Data from sbp.txt (Laake et al., 2007) 09/09/2021<br>
19
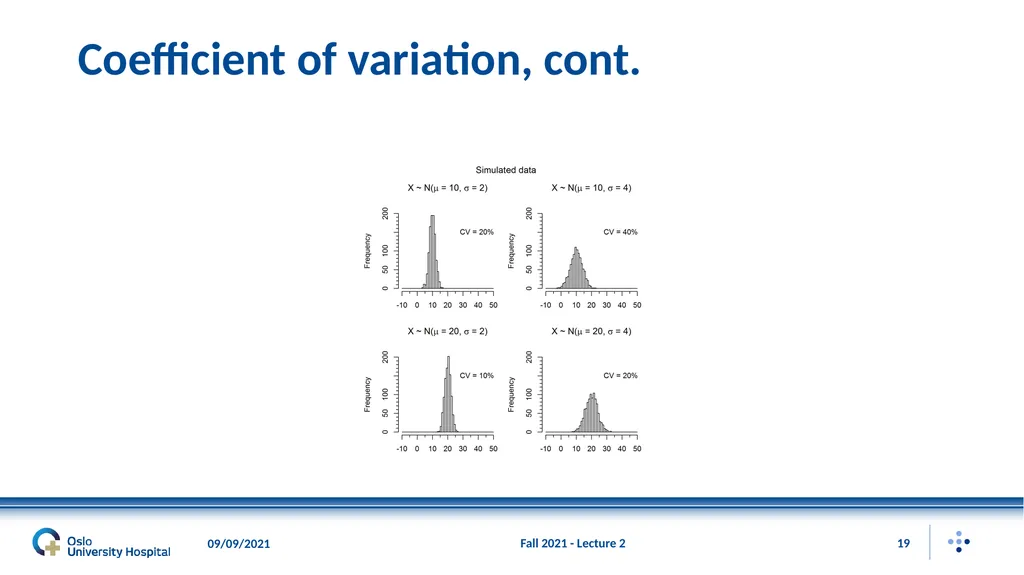
Coefficient of variation, cont. Fall 2021 - Lecture 2 19 09/09/2021<br>
20
References Aalen OO, Frigessi A, Moger TA, Scheel I, Skovlund E, Veierød MB. 2006. Statistiske metoder i medisin og helsefag. Oslo: Gyldendal akademisk.
Laake P, Hjartåker A, Thelle DS, Veierød MB. 2007. Epidemiologiske og kliniske forskningsmetoder. Oslo: Gyldendal akademisk. https://www.med.uio.no/imb/forskning/publikasjoner/boker/2007/epidemiolgiske-kliniske-forskningsmetoder.html. Fall 2021 - Lecture 2 20 09/09/2021<br>