
FedRAMP & DAP Case Study Part 2: Reporting and


Description: FedRAMP DAP Case Study Part 2: Reporting and Decision-Making See how the FedRAMP team assessed their analytics objectives and key performance indicators (KPIs) prior to the launch of their redesigned site, fedramp.gov. 1 Overview Second
Related Topics
Download Presentation
"FedRAMP & DAP Case Study Part 2: Reporting and" is the property of its rightful owner. Permission is granted to download and print the materials on this website for personal, non-commercial use only, and to display it on your personal computer provided you do not modify the materials and that you retain all copyright notices contained in the materials. By downloading content from our website, you accept the terms of this agreement.
Presentation Transcript
slide1. FedRAMP & DAP Case Study Part 2: Reporting and Decision-Making See how the FedRAMP team assessed their analytics objectives and key performance indicators (KPIs) prior to the launch of their redesigned site, fedramp.gov. 1<br>
slide2. Overview Second webinar in a 2 part series
If you didn’t attend part 1 which was focused on strategy, be on the lookout for an upcoming blog summary on digital.gov.
Please note - you’ll see both DAP (paid version) and independently managed analytics tool.
What is FedRAMP? 2<br>
slide3. A big thank you to the FedRAMP team Partnering with just some of our colleagues on the FedRAMP team in our 2 part webinar series.
Thank you
Betsy Steele
Matt Silber
Janelle Thalls
Bailey Feldman 3<br>
slide4. Quick Recap of
Part 1 We presented Analytics Case Study Part 1: Assessment
What is analytics strategy?
Brief Overview of our methodology
Website Mission, Goals & Key Performance Indicators (KPIs)
Defined 3 specific goals 4<br>
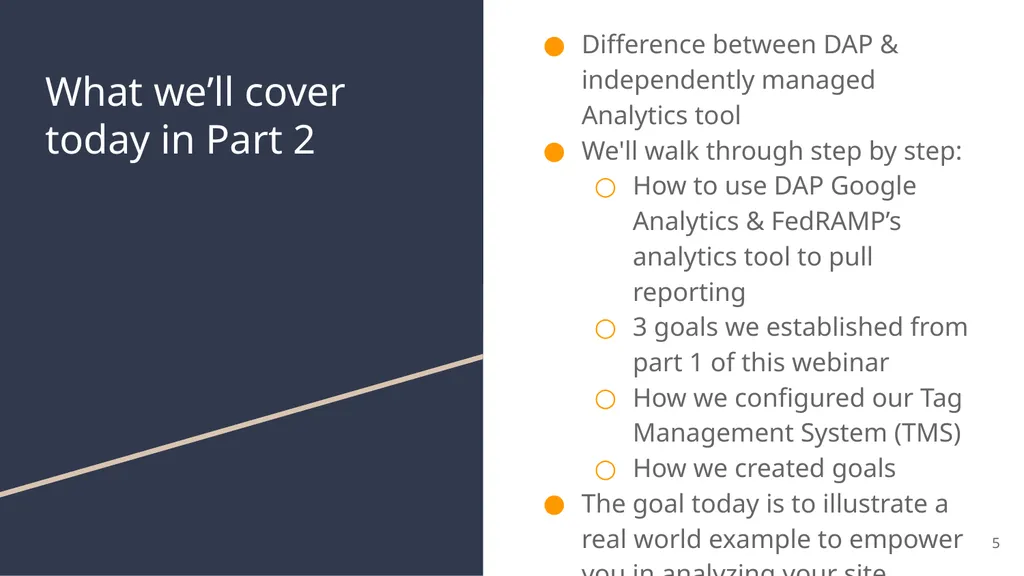
slide5. What we’ll cover today in Part 2 Difference between DAP & independently managed Analytics tool
We'll walk through step by step:
How to use DAP Google Analytics & FedRAMP’s analytics tool to pull reporting
3 goals we established from part 1 of this webinar
How we configured our Tag Management System (TMS)
How we created goals
The goal today is to illustrate a real world example to empower you in analyzing your site 5<br>
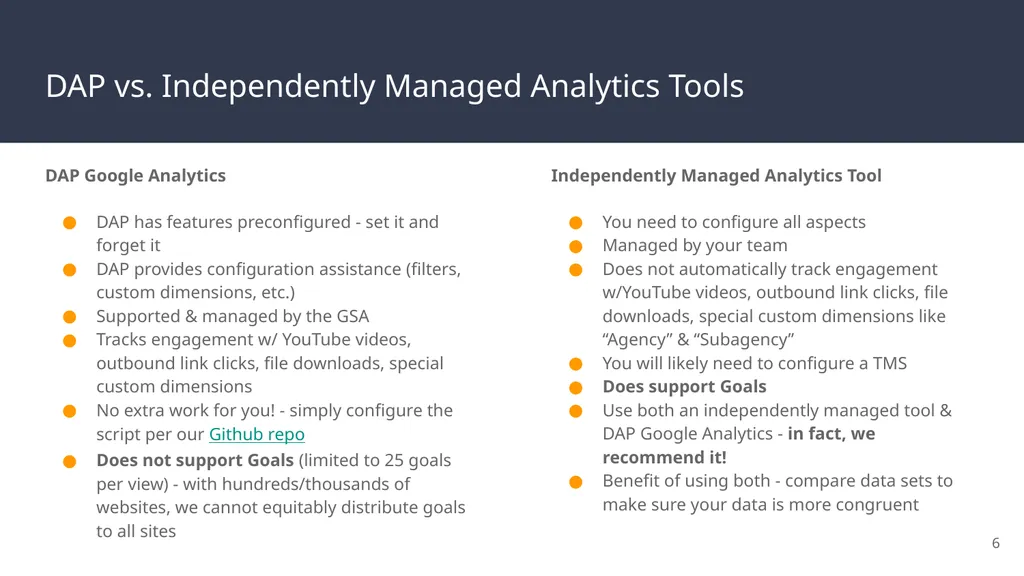
slide6. DAP vs. Independently Managed Analytics Tools DAP Google Analytics
DAP has features preconfigured - set it and forget it
DAP provides configuration assistance (filters, custom dimensions, etc.)
Supported & managed by the GSA
Tracks engagement w/ YouTube videos, outbound link clicks, file downloads, special custom dimensions
No extra work for you! - simply configure the script per our Github repo
Does not support Goals (limited to 25 goals per view) - with hundreds/thousands of websites, we cannot equitably distribute goals to all sites Independently Managed Analytics Tool
You need to configure all aspects
Managed by your team
Does not automatically track engagement w/YouTube videos, outbound link clicks, file downloads, special custom dimensions like “Agency” & “Subagency”
You will likely need to configure a TMS
Does support Goals
Use both an independently managed tool & DAP Google Analytics - in fact, we recommend it!
Benefit of using both - compare data sets to make sure your data is more congruent 6<br>
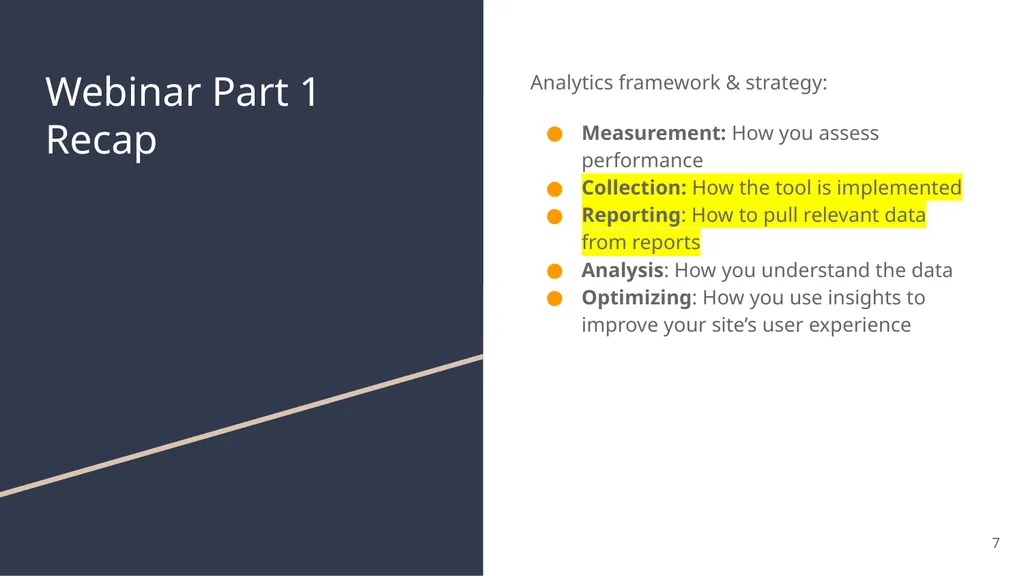
slide7. Webinar Part 1 Recap Analytics framework & strategy:
Measurement: How you assess performance
Collection: How the tool is implemented
Reporting: How to pull relevant data from reports
Analysis: How you understand the data
Optimizing: How you use insights to improve your site’s user experience 7<br>
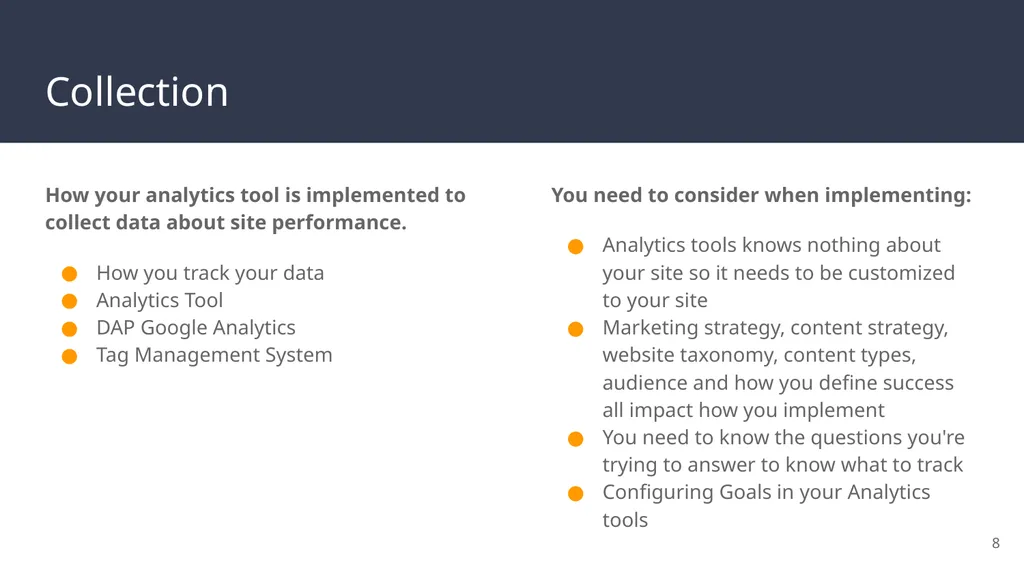
slide8. Collection How your analytics tool is implemented to collect data about site performance.
How you track your data
Analytics Tool
DAP Google Analytics
Tag Management System You need to consider when implementing:
Analytics tools knows nothing about your site so it needs to be customized to your site
Marketing strategy, content strategy, website taxonomy, content types, audience and how you define success all impact how you implement
You need to know the questions you're trying to answer to know what to track
Configuring Goals in your Analytics tools 8<br>
slide9. Reporting Objectives How your team identifies and pulls relevant data sets from DAP Google Analytics.
Using your Website mission, goals & KPIs
How to pull reporting in your Analytics tools and DAP Google Analytics 9<br>
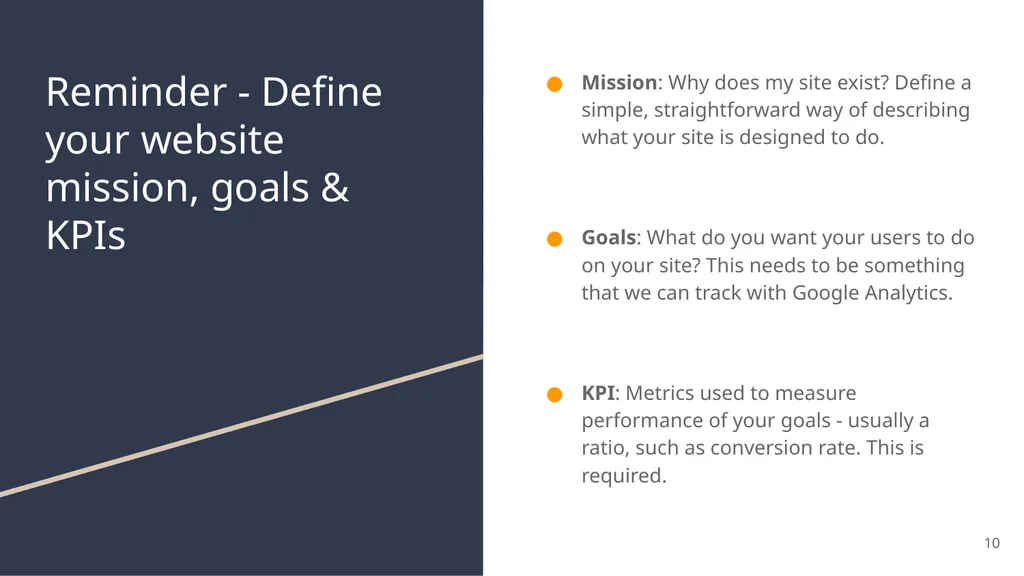
slide10. Reminder - Define your website mission, goals & KPIs Mission: Why does my site exist? Define a simple, straightforward way of describing what your site is designed to do.
Goals: What do you want your users to do on your site? This needs to be something that we can track with Google Analytics.
KPI: Metrics used to measure performance of your goals - usually a ratio, such as conversion rate. This is required. 10<br>
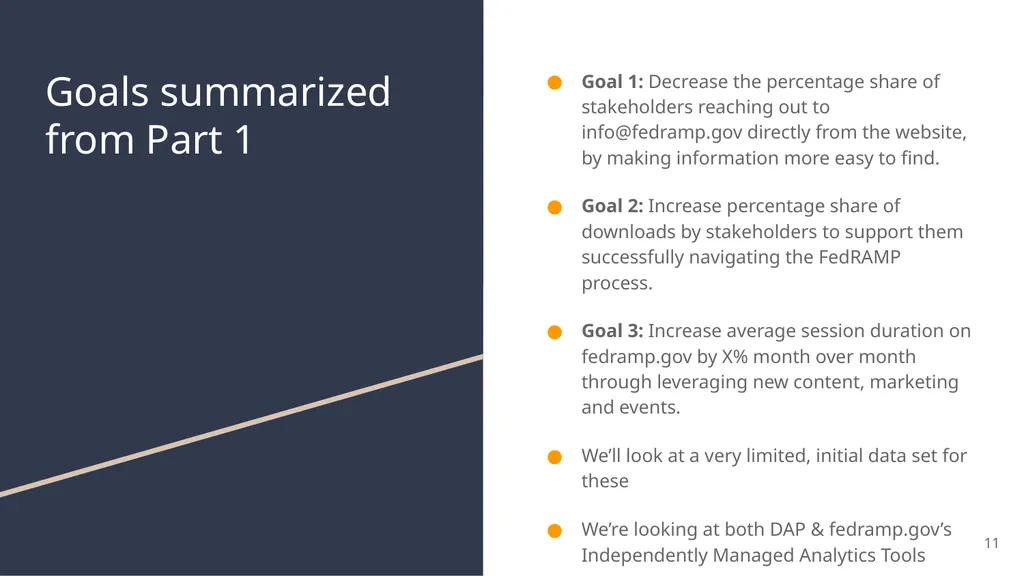
slide11. Goals summarized from Part 1 Goal 1: Decrease the percentage share of stakeholders reaching out to info@fedramp.gov directly from the website, by making information more easy to find.
Goal 2: Increase percentage share of downloads by stakeholders to support them successfully navigating the FedRAMP process.
Goal 3: Increase average session duration on fedramp.gov by X% month over month through leveraging new content, marketing and events.
We’ll look at a very limited, initial data set for these
We’re looking at both DAP & fedramp.gov’s Independently Managed Analytics Tools 11<br>
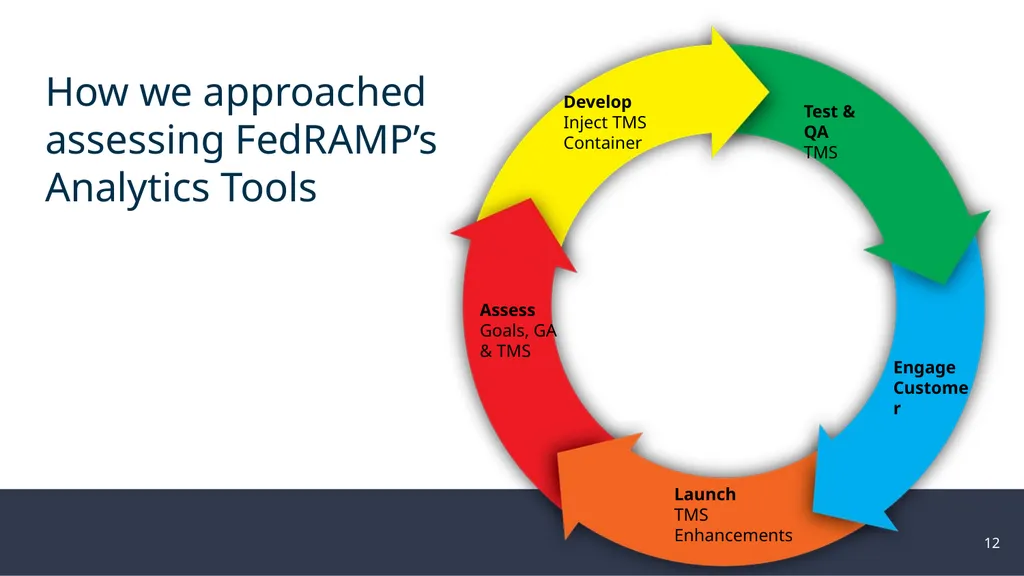
slide12. How we approached assessing FedRAMP’s Analytics Tools Assess
Goals, GA & TMS Develop
Inject TMS Container Test & QA
TMS Engage
Customer Launch
TMS Enhancements 12<br>
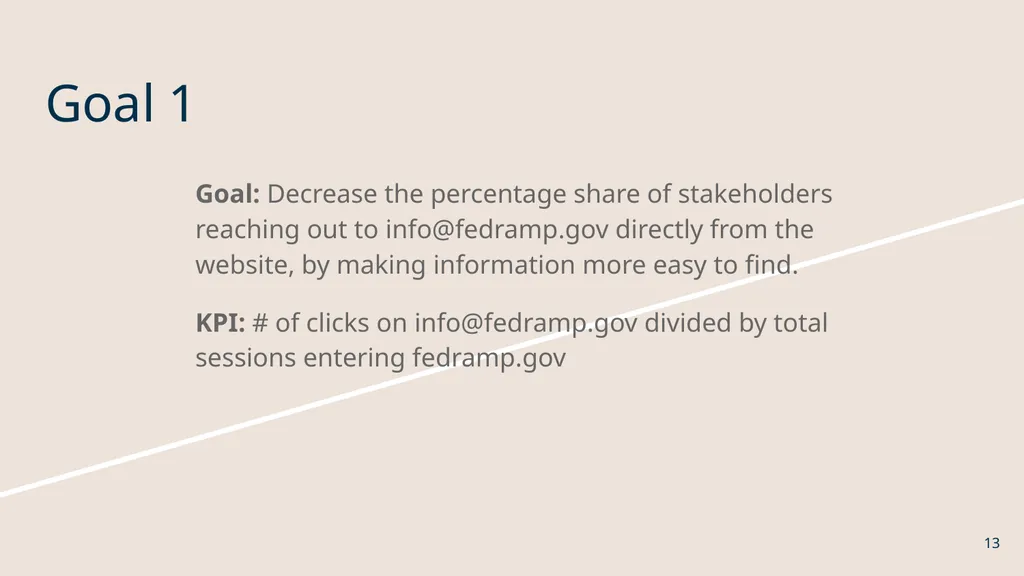
slide13. Goal 1 Goal: Decrease the percentage share of stakeholders reaching out to info@fedramp.gov directly from the website, by making information more easy to find.
KPI: # of clicks on info@fedramp.gov divided by total sessions entering fedramp.gov 13<br>
slide14. Let’s speak with the FedRAMP team Why is this goal meaningful to your team?
How does this goal fit into your larger strategic vision for fedramp.gov?
How do you use this goal in real world terms to make decisions? 14<br>
slide15. How did we approach figuring out this goal? In DAP, we know we have event reporting for mailto link clicks
We also implemented mailto tracking in the Independently Managed Analytics Tools via a tag manager 15<br>
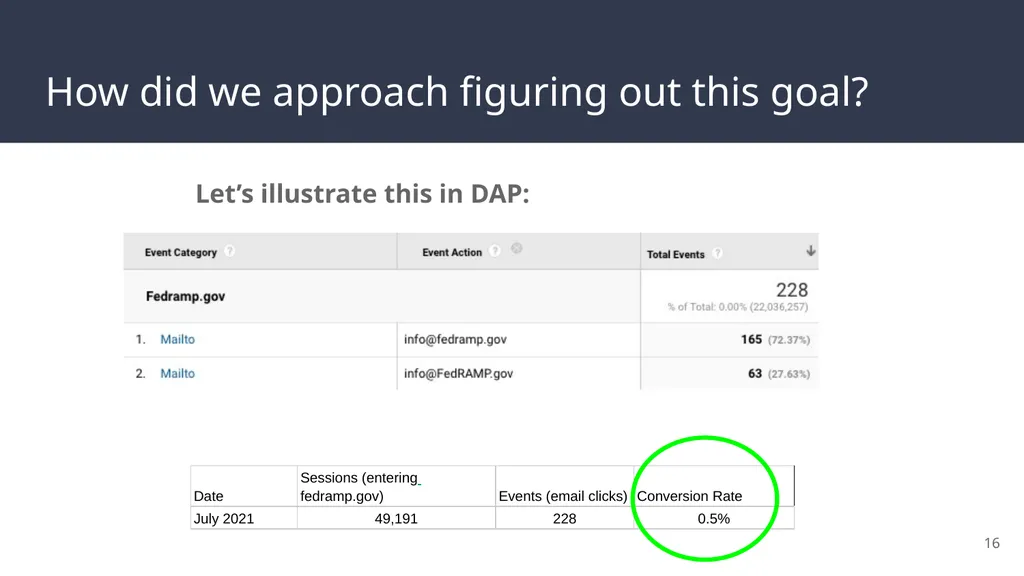
slide16. How did we approach figuring out this goal? Let’s illustrate this in DAP: 16<br>
slide17. How did we approach figuring out this goal? In FedRAMP’s independently managed analytics tool:
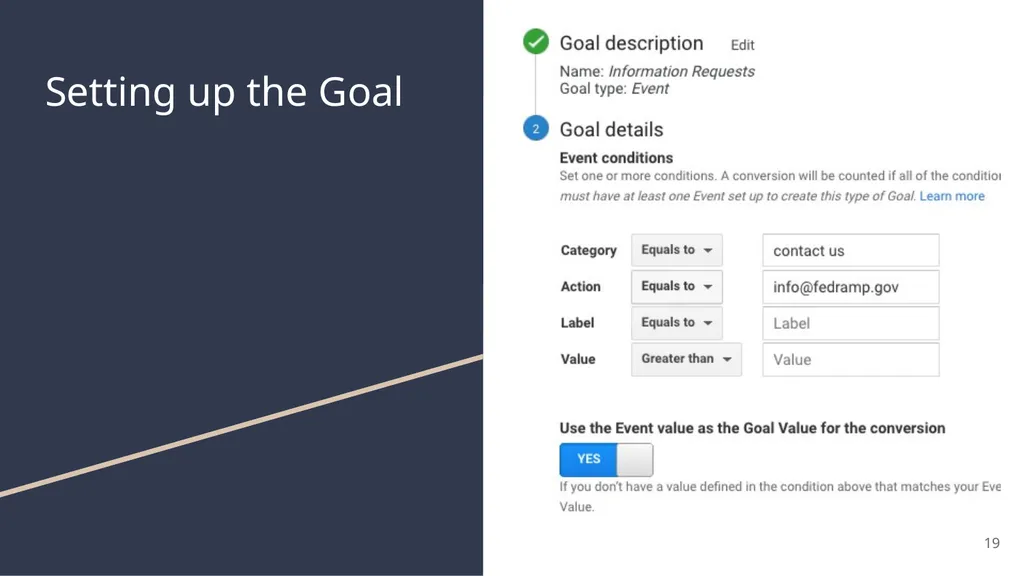
We set up Events for mailto link clicks using a TMS
FedRAMP wanted Goals configured in their independently managed analytics tool to track performance
Required next step - set up events for mailto link clicks in our TMS 17<br>
slide18. Let's demo how we addressed this in our TMS 18<br>
slide19. Setting up the Goal 19<br>
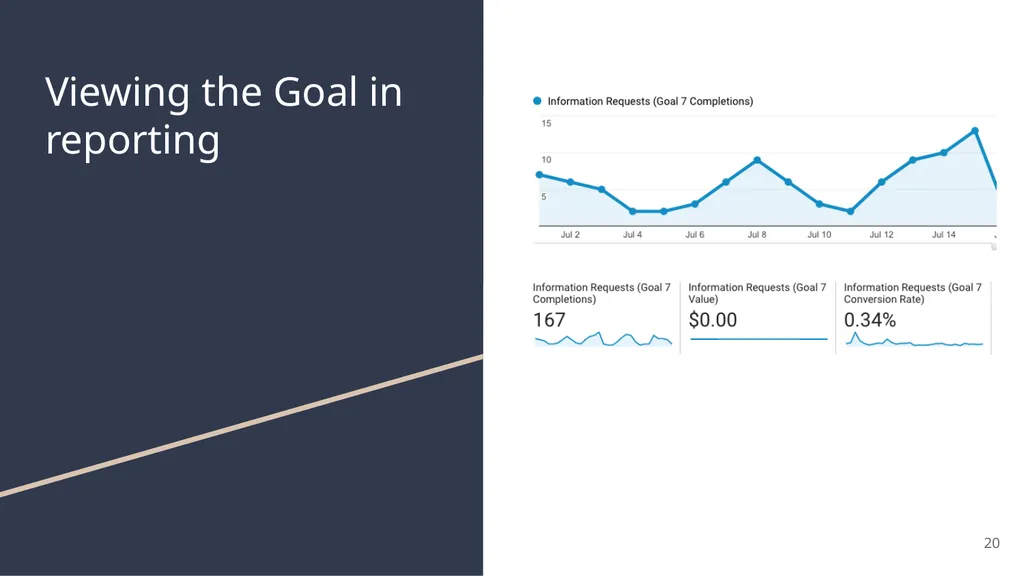
slide20. Viewing the Goal in reporting 20<br>
slide21. Let’s chat with the FedRAMP team 21 Now that we’ve demonstrated the data...
How does FedRAMP plan to take action?<br>
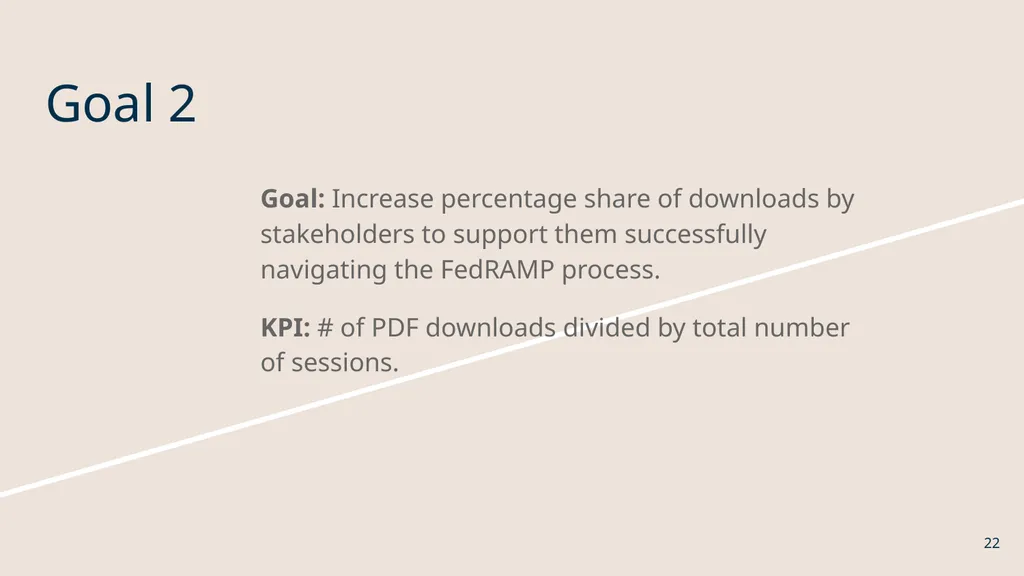
slide22. Goal 2 Goal: Increase percentage share of downloads by stakeholders to support them successfully navigating the FedRAMP process.
KPI: # of PDF downloads divided by total number of sessions. 22<br>
slide23. Let’s speak with the FedRAMP team Why is this goal meaningful to your team?
How does this goal fit into your larger strategic vision for fedramp.gov?
How do you use this goal in real world terms to make decisions? 23<br>
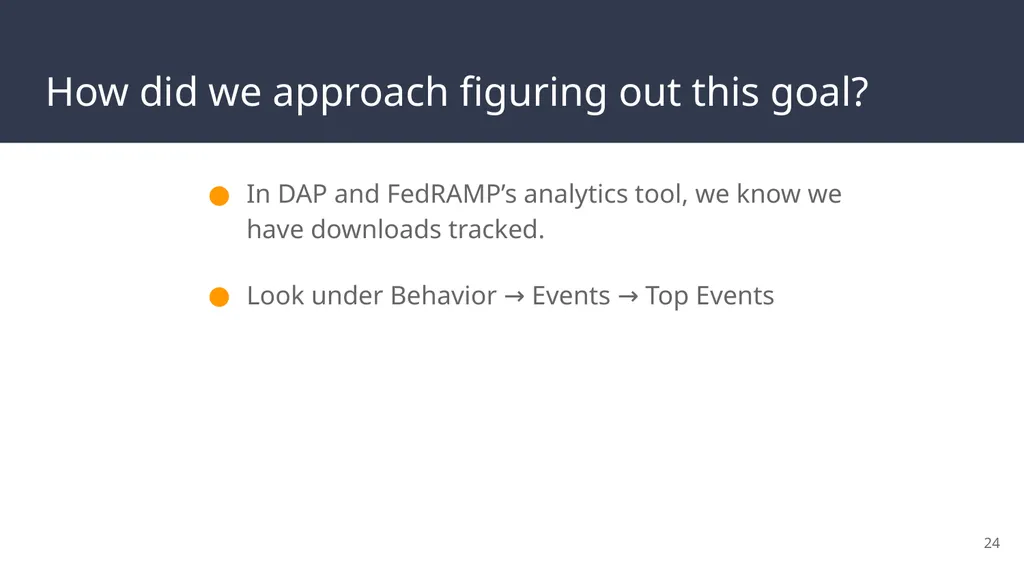
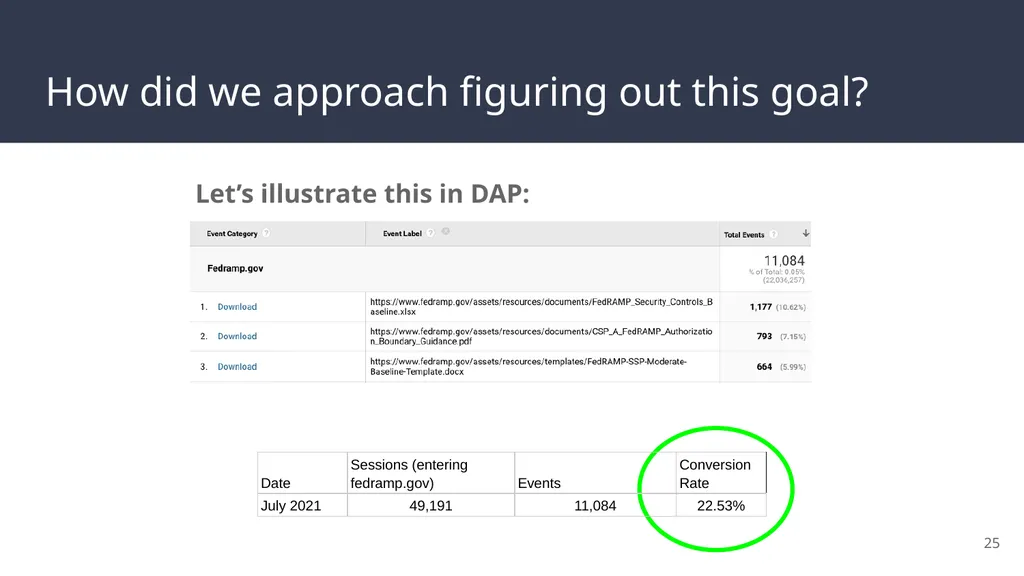
slide24. How did we approach figuring out this goal? In DAP and FedRAMP’s analytics tool, we know we have downloads tracked.
Look under Behavior → Events → Top Events 24<br>
slide25. How did we approach figuring out this goal? Let’s illustrate this in DAP: 25<br>
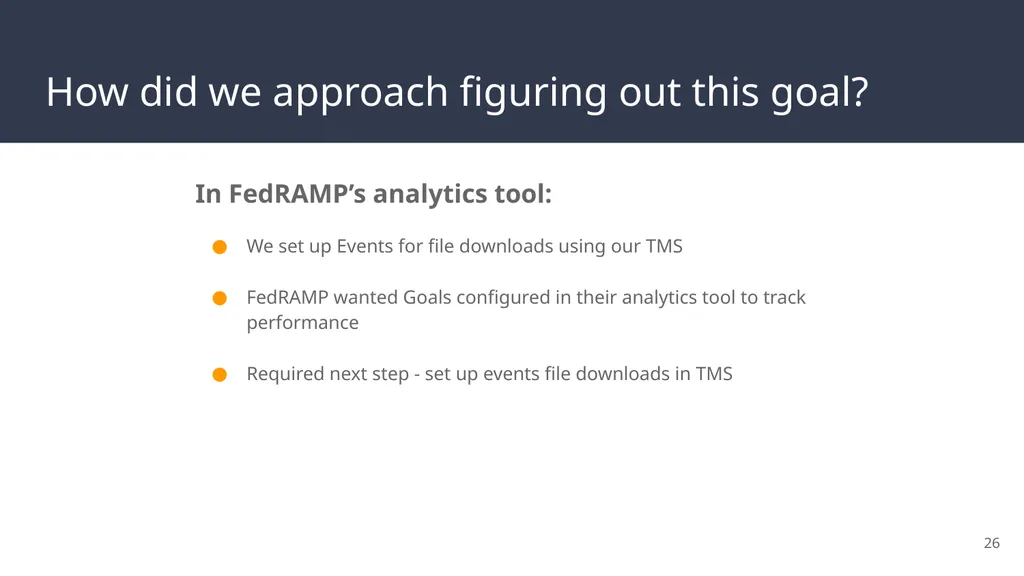
slide26. How did we approach figuring out this goal? In FedRAMP’s analytics tool:
We set up Events for file downloads using our TMS
FedRAMP wanted Goals configured in their analytics tool to track performance
Required next step - set up events file downloads in TMS 26<br>
slide27. Let's demo how we addressed this in our TMS 27<br>
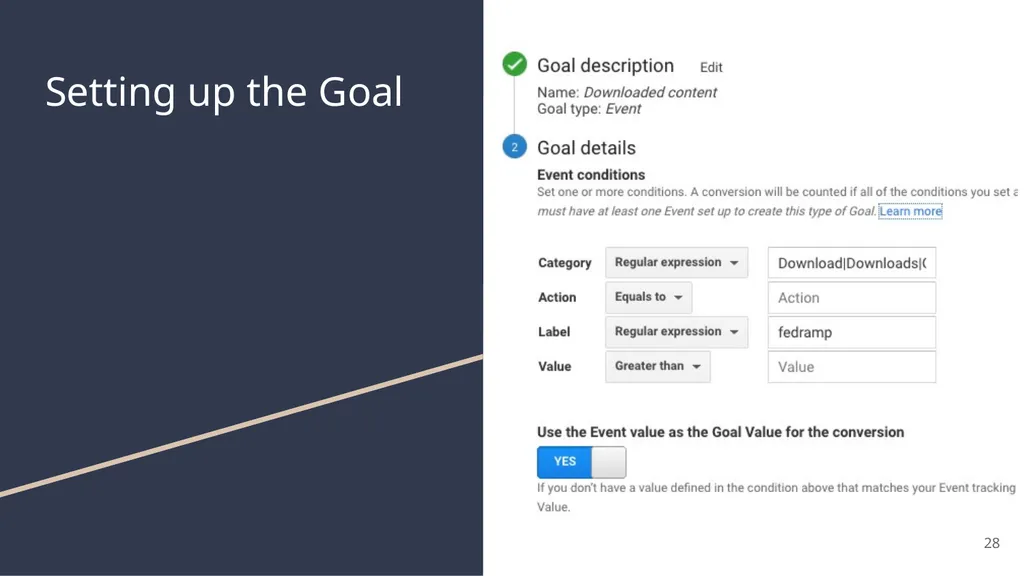
slide28. Setting up the Goal 28<br>
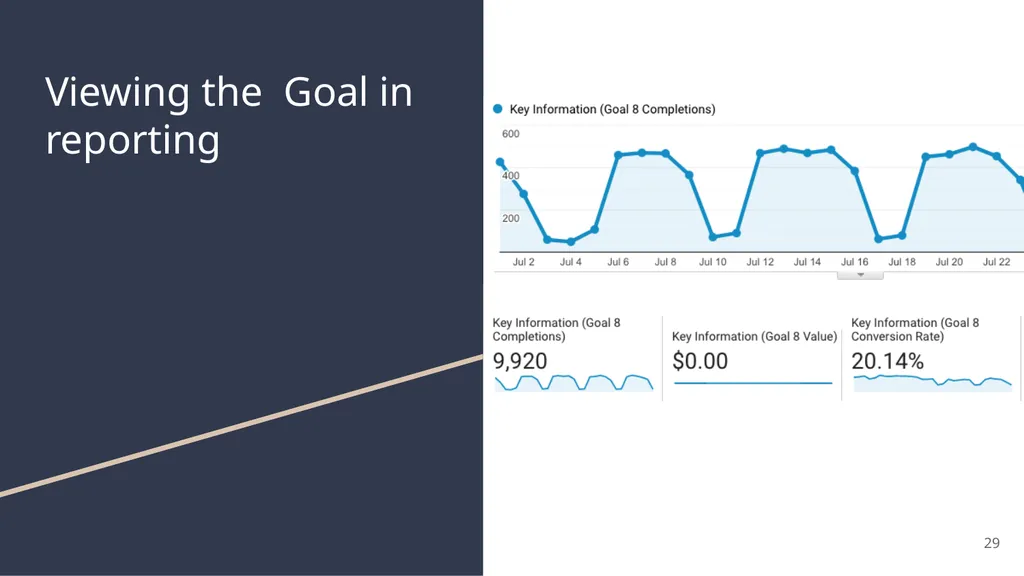
slide29. Viewing the Goal in reporting 29<br>
slide30. Let’s chat with the FedRAMP team 30 Now that we’ve demonstrated the data...
How does FedRAMP plan to take action?<br>
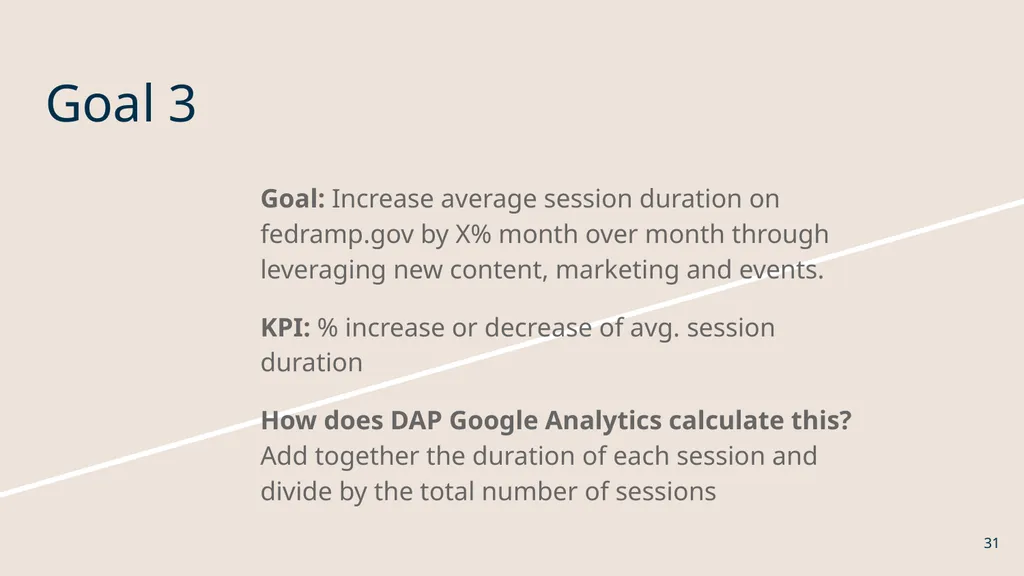
slide31. Goal 3 Goal: Increase average session duration on fedramp.gov by X% month over month through leveraging new content, marketing and events.
KPI: % increase or decrease of avg. session duration
How does DAP Google Analytics calculate this? Add together the duration of each session and divide by the total number of sessions 31<br>
slide32. Let’s speak with the FedRAMP team Why is this goal meaningful to your team?
How does this goal fit into your larger strategic vision for fedramp.gov?
How do you use this goal in real world terms to make decisions? 32<br>
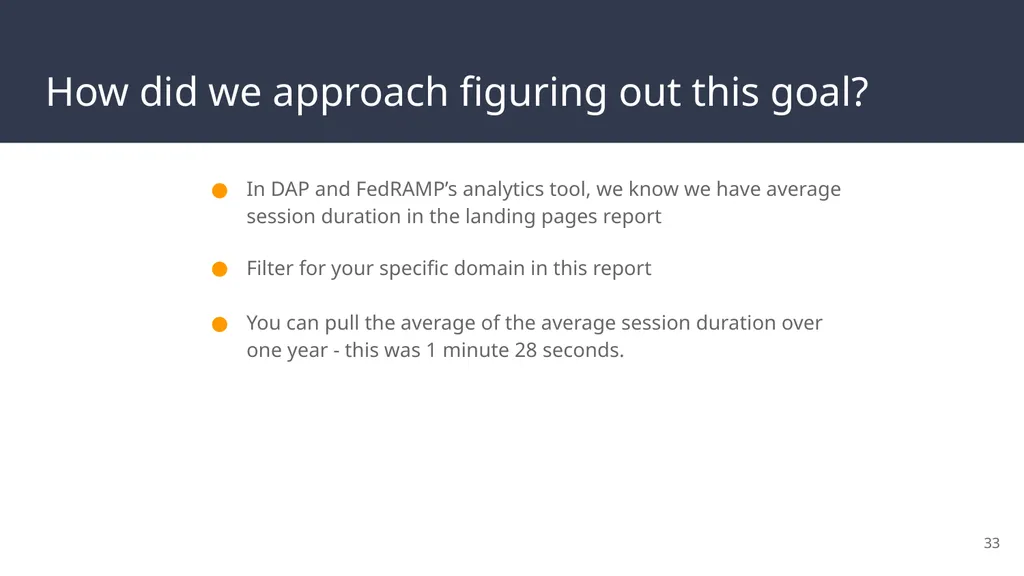
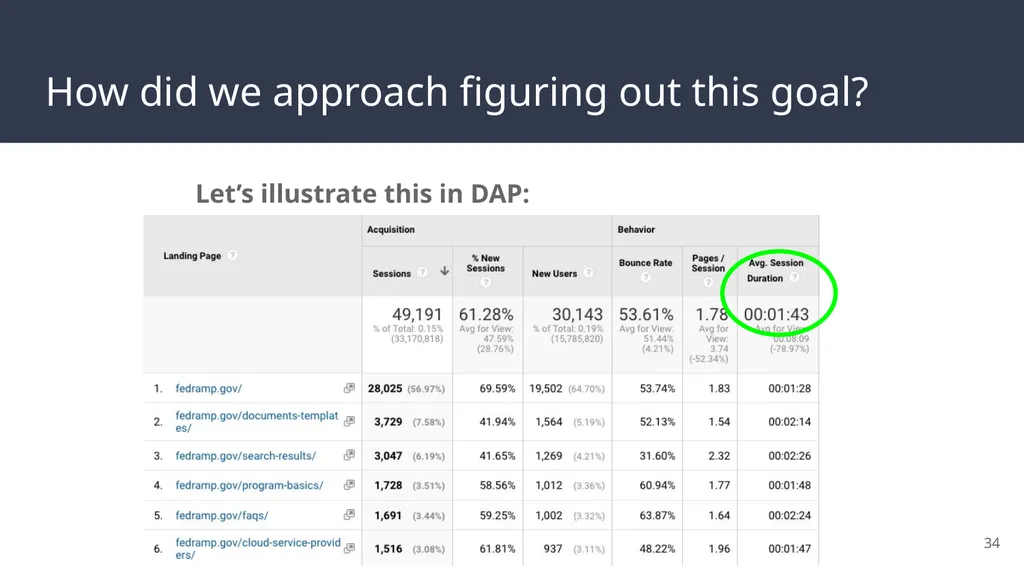
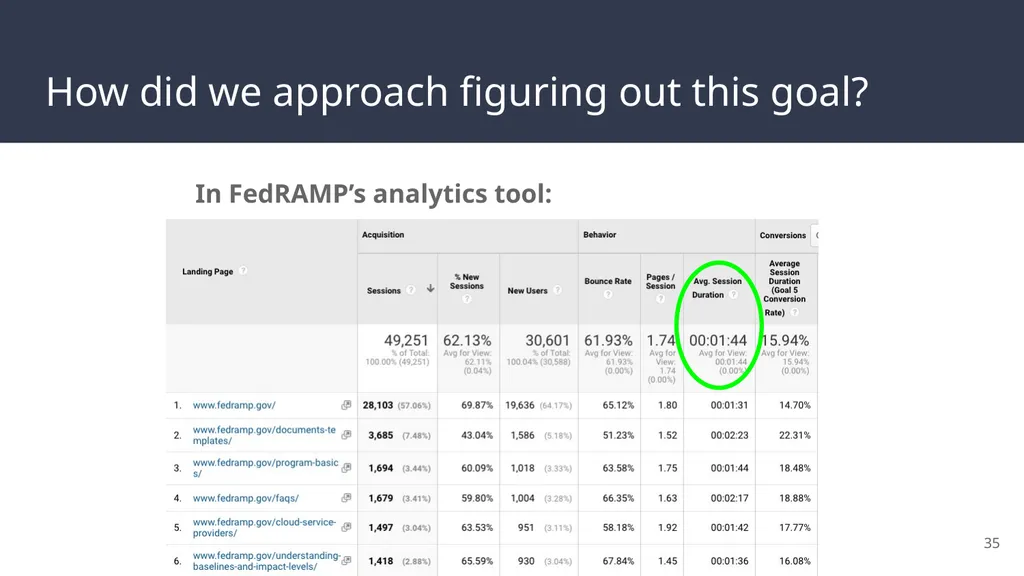
slide33. How did we approach figuring out this goal? In DAP and FedRAMP’s analytics tool, we know we have average session duration in the landing pages report
Filter for your specific domain in this report
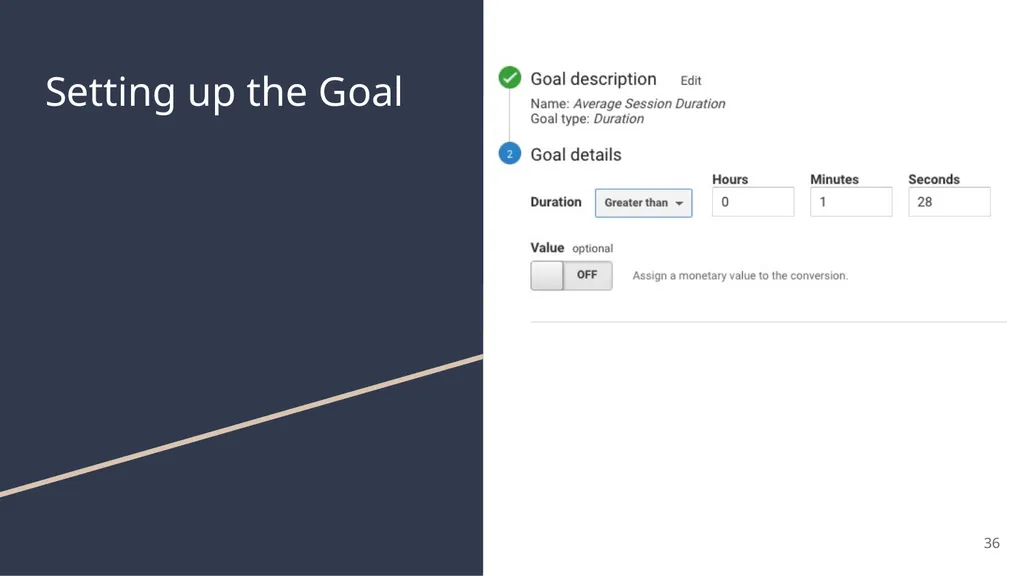
You can pull the average of the average session duration over one year - this was 1 minute 28 seconds. 33<br>
slide34. How did we approach figuring out this goal? Let’s illustrate this in DAP: 34<br>
slide35. How did we approach figuring out this goal? In FedRAMP’s analytics tool: 35<br>
slide36. Setting up the Goal 36<br>
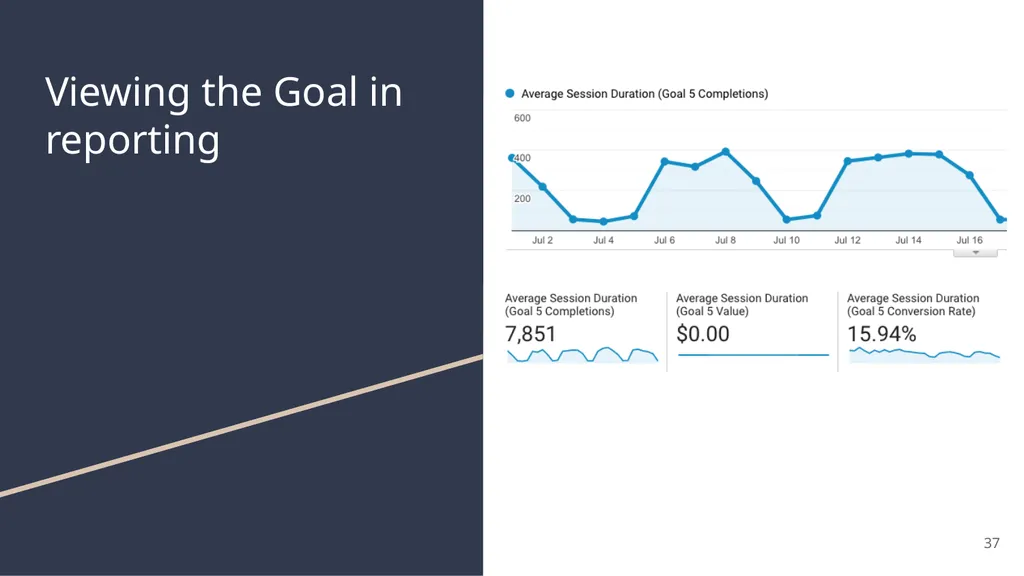
slide37. Viewing the Goal in reporting 37<br>
slide38. Let’s chat with the FedRAMP team 38 Now that we’ve demonstrated the data...
How does FedRAMP plan to take action?<br>
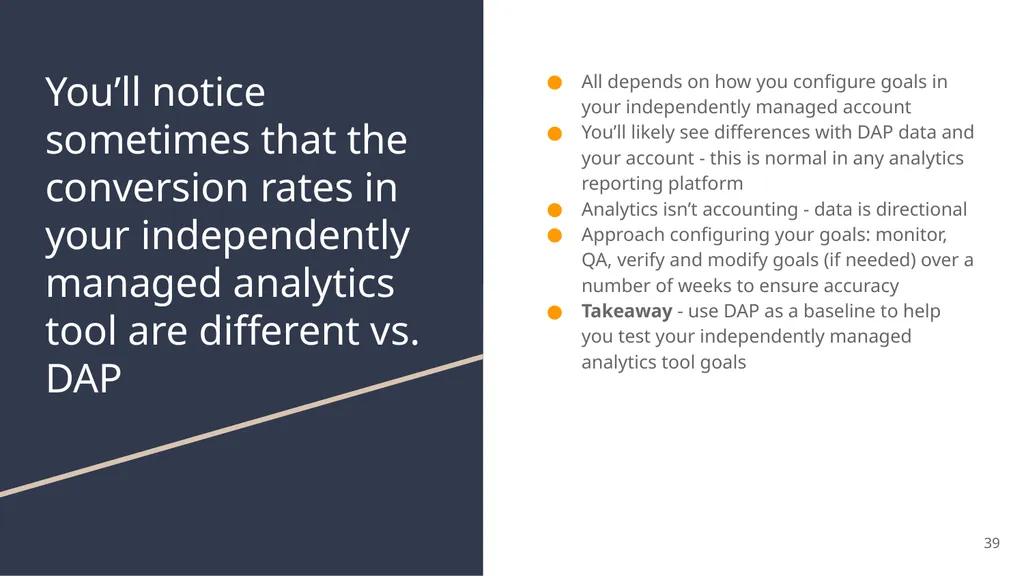
slide39. You’ll notice sometimes that the conversion rates in your independently managed analytics tool are different vs. DAP All depends on how you configure goals in your independently managed account
You’ll likely see differences with DAP data and your account - this is normal in any analytics reporting platform
Analytics isn’t accounting - data is directional
Approach configuring your goals: monitor, QA, verify and modify goals (if needed) over a number of weeks to ensure accuracy
Takeaway - use DAP as a baseline to help you test your independently managed analytics tool goals 39<br>
slide40. So that was a lot! Questions? 40<br>
slide41. Thank you! Please fill out the survey - we appreciate feedback.
Please contact us at dap@support.digitalgov.gov 41<br>
slide2. Overview Second webinar in a 2 part series
If you didn’t attend part 1 which was focused on strategy, be on the lookout for an upcoming blog summary on digital.gov.
Please note - you’ll see both DAP (paid version) and independently managed analytics tool.
What is FedRAMP? 2<br>
slide3. A big thank you to the FedRAMP team Partnering with just some of our colleagues on the FedRAMP team in our 2 part webinar series.
Thank you
Betsy Steele
Matt Silber
Janelle Thalls
Bailey Feldman 3<br>
slide4. Quick Recap of
Part 1 We presented Analytics Case Study Part 1: Assessment
What is analytics strategy?
Brief Overview of our methodology
Website Mission, Goals & Key Performance Indicators (KPIs)
Defined 3 specific goals 4<br>
slide5. What we’ll cover today in Part 2 Difference between DAP & independently managed Analytics tool
We'll walk through step by step:
How to use DAP Google Analytics & FedRAMP’s analytics tool to pull reporting
3 goals we established from part 1 of this webinar
How we configured our Tag Management System (TMS)
How we created goals
The goal today is to illustrate a real world example to empower you in analyzing your site 5<br>
slide6. DAP vs. Independently Managed Analytics Tools DAP Google Analytics
DAP has features preconfigured - set it and forget it
DAP provides configuration assistance (filters, custom dimensions, etc.)
Supported & managed by the GSA
Tracks engagement w/ YouTube videos, outbound link clicks, file downloads, special custom dimensions
No extra work for you! - simply configure the script per our Github repo
Does not support Goals (limited to 25 goals per view) - with hundreds/thousands of websites, we cannot equitably distribute goals to all sites Independently Managed Analytics Tool
You need to configure all aspects
Managed by your team
Does not automatically track engagement w/YouTube videos, outbound link clicks, file downloads, special custom dimensions like “Agency” & “Subagency”
You will likely need to configure a TMS
Does support Goals
Use both an independently managed tool & DAP Google Analytics - in fact, we recommend it!
Benefit of using both - compare data sets to make sure your data is more congruent 6<br>
slide7. Webinar Part 1 Recap Analytics framework & strategy:
Measurement: How you assess performance
Collection: How the tool is implemented
Reporting: How to pull relevant data from reports
Analysis: How you understand the data
Optimizing: How you use insights to improve your site’s user experience 7<br>
slide8. Collection How your analytics tool is implemented to collect data about site performance.
How you track your data
Analytics Tool
DAP Google Analytics
Tag Management System You need to consider when implementing:
Analytics tools knows nothing about your site so it needs to be customized to your site
Marketing strategy, content strategy, website taxonomy, content types, audience and how you define success all impact how you implement
You need to know the questions you're trying to answer to know what to track
Configuring Goals in your Analytics tools 8<br>
slide9. Reporting Objectives How your team identifies and pulls relevant data sets from DAP Google Analytics.
Using your Website mission, goals & KPIs
How to pull reporting in your Analytics tools and DAP Google Analytics 9<br>
slide10. Reminder - Define your website mission, goals & KPIs Mission: Why does my site exist? Define a simple, straightforward way of describing what your site is designed to do.
Goals: What do you want your users to do on your site? This needs to be something that we can track with Google Analytics.
KPI: Metrics used to measure performance of your goals - usually a ratio, such as conversion rate. This is required. 10<br>
slide11. Goals summarized from Part 1 Goal 1: Decrease the percentage share of stakeholders reaching out to info@fedramp.gov directly from the website, by making information more easy to find.
Goal 2: Increase percentage share of downloads by stakeholders to support them successfully navigating the FedRAMP process.
Goal 3: Increase average session duration on fedramp.gov by X% month over month through leveraging new content, marketing and events.
We’ll look at a very limited, initial data set for these
We’re looking at both DAP & fedramp.gov’s Independently Managed Analytics Tools 11<br>
slide12. How we approached assessing FedRAMP’s Analytics Tools Assess
Goals, GA & TMS Develop
Inject TMS Container Test & QA
TMS Engage
Customer Launch
TMS Enhancements 12<br>
slide13. Goal 1 Goal: Decrease the percentage share of stakeholders reaching out to info@fedramp.gov directly from the website, by making information more easy to find.
KPI: # of clicks on info@fedramp.gov divided by total sessions entering fedramp.gov 13<br>
slide14. Let’s speak with the FedRAMP team Why is this goal meaningful to your team?
How does this goal fit into your larger strategic vision for fedramp.gov?
How do you use this goal in real world terms to make decisions? 14<br>
slide15. How did we approach figuring out this goal? In DAP, we know we have event reporting for mailto link clicks
We also implemented mailto tracking in the Independently Managed Analytics Tools via a tag manager 15<br>
slide16. How did we approach figuring out this goal? Let’s illustrate this in DAP: 16<br>
slide17. How did we approach figuring out this goal? In FedRAMP’s independently managed analytics tool:
We set up Events for mailto link clicks using a TMS
FedRAMP wanted Goals configured in their independently managed analytics tool to track performance
Required next step - set up events for mailto link clicks in our TMS 17<br>
slide18. Let's demo how we addressed this in our TMS 18<br>
slide19. Setting up the Goal 19<br>
slide20. Viewing the Goal in reporting 20<br>
slide21. Let’s chat with the FedRAMP team 21 Now that we’ve demonstrated the data...
How does FedRAMP plan to take action?<br>
slide22. Goal 2 Goal: Increase percentage share of downloads by stakeholders to support them successfully navigating the FedRAMP process.
KPI: # of PDF downloads divided by total number of sessions. 22<br>
slide23. Let’s speak with the FedRAMP team Why is this goal meaningful to your team?
How does this goal fit into your larger strategic vision for fedramp.gov?
How do you use this goal in real world terms to make decisions? 23<br>
slide24. How did we approach figuring out this goal? In DAP and FedRAMP’s analytics tool, we know we have downloads tracked.
Look under Behavior → Events → Top Events 24<br>
slide25. How did we approach figuring out this goal? Let’s illustrate this in DAP: 25<br>
slide26. How did we approach figuring out this goal? In FedRAMP’s analytics tool:
We set up Events for file downloads using our TMS
FedRAMP wanted Goals configured in their analytics tool to track performance
Required next step - set up events file downloads in TMS 26<br>
slide27. Let's demo how we addressed this in our TMS 27<br>
slide28. Setting up the Goal 28<br>
slide29. Viewing the Goal in reporting 29<br>
slide30. Let’s chat with the FedRAMP team 30 Now that we’ve demonstrated the data...
How does FedRAMP plan to take action?<br>
slide31. Goal 3 Goal: Increase average session duration on fedramp.gov by X% month over month through leveraging new content, marketing and events.
KPI: % increase or decrease of avg. session duration
How does DAP Google Analytics calculate this? Add together the duration of each session and divide by the total number of sessions 31<br>
slide32. Let’s speak with the FedRAMP team Why is this goal meaningful to your team?
How does this goal fit into your larger strategic vision for fedramp.gov?
How do you use this goal in real world terms to make decisions? 32<br>
slide33. How did we approach figuring out this goal? In DAP and FedRAMP’s analytics tool, we know we have average session duration in the landing pages report
Filter for your specific domain in this report
You can pull the average of the average session duration over one year - this was 1 minute 28 seconds. 33<br>
slide34. How did we approach figuring out this goal? Let’s illustrate this in DAP: 34<br>
slide35. How did we approach figuring out this goal? In FedRAMP’s analytics tool: 35<br>
slide36. Setting up the Goal 36<br>
slide37. Viewing the Goal in reporting 37<br>
slide38. Let’s chat with the FedRAMP team 38 Now that we’ve demonstrated the data...
How does FedRAMP plan to take action?<br>
slide39. You’ll notice sometimes that the conversion rates in your independently managed analytics tool are different vs. DAP All depends on how you configure goals in your independently managed account
You’ll likely see differences with DAP data and your account - this is normal in any analytics reporting platform
Analytics isn’t accounting - data is directional
Approach configuring your goals: monitor, QA, verify and modify goals (if needed) over a number of weeks to ensure accuracy
Takeaway - use DAP as a baseline to help you test your independently managed analytics tool goals 39<br>
slide40. So that was a lot! Questions? 40<br>
slide41. Thank you! Please fill out the survey - we appreciate feedback.
Please contact us at dap@support.digitalgov.gov 41<br>